Ichimoku Cloud & CandlesThe Ichimoku Cloud is a hybrid indicator combining numerous technical indicators that show support and resistance levels, as well as indicating momentum and trend direction. Ichimoku does so by taking multiple, pre-set price moving averages and plotting them on the chart in line form. It also uses these inputs to create a "cloud" which intends to forecast where the price may find support or resistance in the future. Refer to standard, and widely available, Ichimoku Cloud technical publications and/or YT videos for information on how to trade using the Ichimoku Cloud.
This indicator uses standard/default Ichimoku settings. The difference between this indicator and standard Ichimoku indicators is that the candle colors are based on price relative to the Tenkan-sen and Kijun-sen, and as such are painted lime, fuchsia and gray. Lime price candles indicate that price is in an uptrend; fuchsia candles indicate a downtrend; gray is no identifiable trend, or neutral.
Support

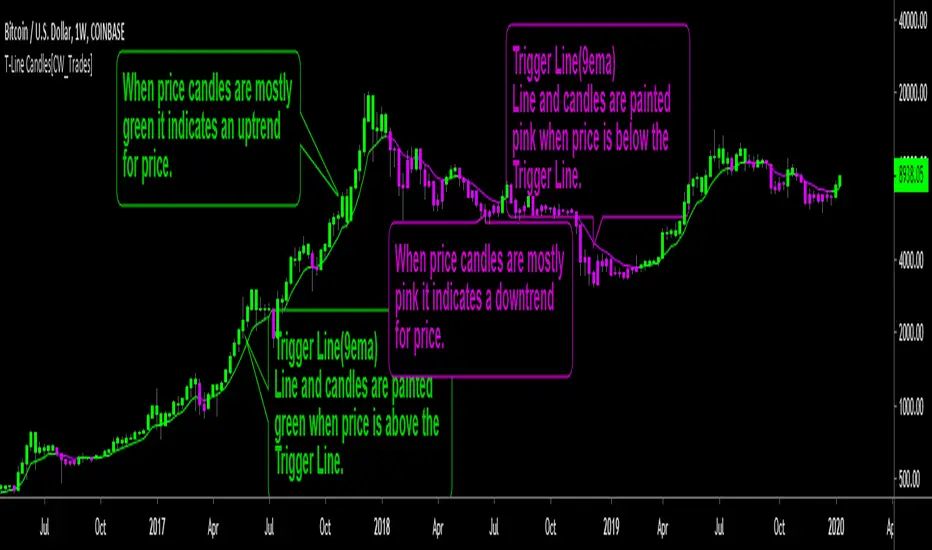
Trigger Line CandlesThis is a trend indicator utilizing a 9-period exponential moving average, known as the Trigger Line. When price is above the Trigger Line both the candles and Trigger Line are colored green, indicating an uptrend for price. Price will tend to find support at the Trigger Line when trending above the Trigger Line. When price is below the Trigger Line both the candles and the Trigger Line are colored pink, indicating a downtrend for price. Price will tend to find resistance at the Trigger Line when trending below the Trigger Line.
Coloring price candles based on price relation to the Trigger Line paints a clearer picture of the true short-term trend behind price, rather than traditional price candles which only paint price in two colors representing individual candle up and down movement while no short-term trend identification is utilized.
Indicator inputs are editable; candle colors and T-Line can be turned on/off.
Indicator inspired by Stephen Bigalow's T-Line strategy.
Market StructureMarket Structure
The Market Structure is important to be able to establish areas of rejection or possible break,
to determine channels, points of possible reversals or trend breaks.
So we can use them as support and resistance zones for stoploss and take profit.
- This indicator will automatically show the market structure.
- Allows you to calculate the levels with the closing of the candles as well as with the highs and lows
- You can change the number of levels on the screen with the intensity adjustment
- Extended levels are shown as well as at the end of the graph to avoid noise when making technical analysis
- Visually you can modify the style, color, thickness of the level lines
- This indicator is multi-time, so you can check the structure of other temporalities, for example see the levels corresponding to 1D while the graph is H4
- Green lines are the resitance levels and red lines are support levels, these will automatically change color according to the current price
BTC 1W
EURUSD 1W
ETHUSDT 1D

[PX] Lookback LevelHey guys,
this indicator detects support and resistance level based on the number of times a level got tested in a certain range.
How does it work?
In the user input settings, you will be able to choose between two modes "Tested Level" and "Untested Level".
"Tested Level" will be detected by the number of times a certain low or high got tested in the "Lookback"-range, while fitting in the "Deviation"-range of the specific high or low. A crossing of the level is allowed. The "Untested Level" work the same way, but crossings of the level will eliminate it.
The indicator is highly dependent on which input you will use. Please play around with the settings and see how it works on different timeframes and symbols.
As always, it comes with styling options for the levels.
If some of you find it useful, please leave a like and hit the follow button :)
Happy trading,
paaax

Auto-fibsAutomatically plots Fibonacci Retracement levels.
Uses the all time high (ATH) for a specified number of days back, and the lowest value since the ATH, to plot the levels.

Liens Support & Resistances + Trend following v2
1. Previous daily Support and resistance levels ( Not showing on chart - Needs to be used on lower tf )
2. Previous Weekly Support and resistance levels
Blue circles = Weekly Support
Yellow circles = Weekly resistance
This setting is currently set to "0 days" so when you open the script it wont show.
On chart previous weekly is set to "10 weeks"
3. Auto Support and resistance levels targeting Highs and lows(wicks).
Auto color change
Support = always green
resistance = always red.
4. Trendfollowing Using the 20 ema
Bars change color when price is over/under ema.

Liens Support and resistance + trend following1. Two different support and resistance levels. One that focuses on price action and one for wicks. (Wicks needs to be turned on)
3. 20 ema trendfollowing. Bars change color. when price is over/under ema.
4. Bar color levels also work with rsi levels. Currently set to 0-100. If you only want bars to change color when the rsi is overbough/oversold. simply just change the levels to 70-30 or whatever you like :)

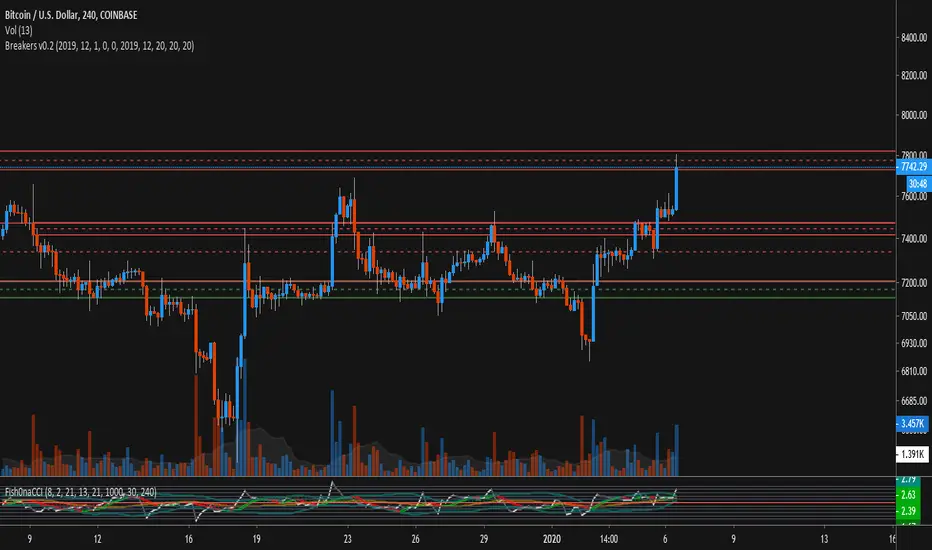
bg_Breakers_orderBlocks_detection (Breakers)Version 0.1
Using Pivots / Swing Point detection, this script plots the final swing candle's body span from top to bottom with an extended horizontal line, with a mid-channel point at 50% between open and close.
Once the trend changes, these zones serve as support and resistance zones, and can help identify breakouts from ranges and probable reversal points moving forward.
To avoid clutter, the script allows you to select a specific date-range (start / end date) which the rule will only apply and plot for.
Other customizable options are the length in bars of the pivot/swing point detection, which is defaulted at 20 bars for both highs and lows.
Works best on time-frames 4H, 1D, etc. with some luck to be had in occasionally shorter time-frames as shown above.
4H:
Pivot Points Daily and WeeklyThis will let trader see Daily and Weekly Pivot points with R/S5.
Daily Pivot point line --> Orange Color
Daily R1-5 ---> Black circles
Daily S1-5 ---> Black circles
Weekly Pivot lines ---> Purple Color
Weekly R1-5 ---> Red Circles
Weekly S1-5 ---> Red Circles

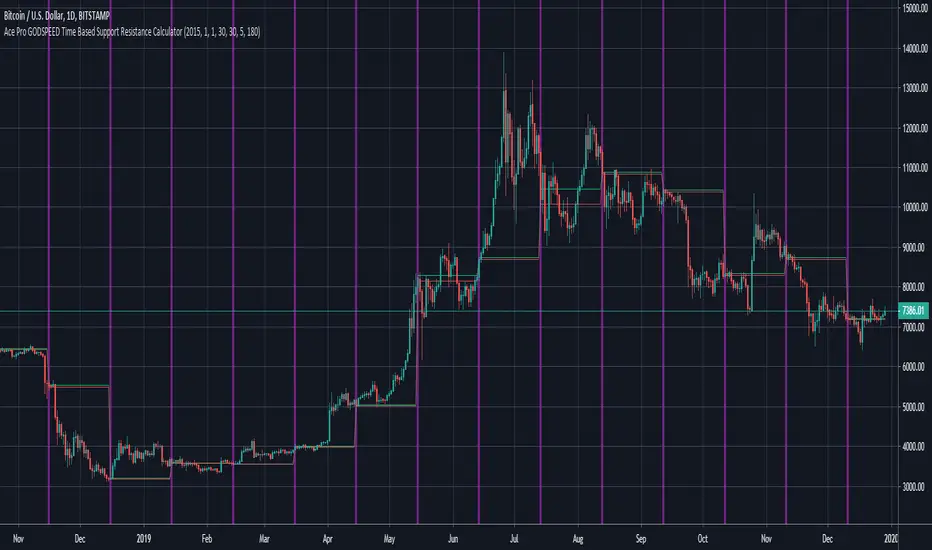
Ace Pro GODSPEED Time Based Support Resistance Calculator [FREE]The Ace Pro GODSPEED Time Based Support Resistance Calculator has two functions.
Please note that this indicator is COMPLETELY CUSTOMIZABLE - TRADERS CAN INPUT THEIR OWN VALUES TO CALCULATE S/R.
Function 1: It marks intervals of time on the daily time-frame with vertical lines as specified by the user
Function 2: It can mark support and resistances with horizontal lines as defined by a set of candles for a specified time interval
Function 1 Explanation:
To mark the intervals on the daily time-frame, traders should utilize the following options:
Start Year
Start Month
Start Date
Days Frequency
Traders can select the start date and duration of each interval. The indicator will automatically mark these intervals on the daily chart with a vertical line.
----------------------------------------------------------------------------------------------------------
Function 2 Explanation:
To mark support and resistances, traders should utilize the following options
Low Time Frame
Low Time Frame Value
High Time Frame Value
Low Time Frame = Specify the time frame on which you would like to VIEW the S/R lines
Low Time Frame Value = Select the value of the candle to take into account. For example, if you want the indicator to calculate using 5-minute candles, specify “5” as the input value. However if you want the indicator to calculate using 10-minute candles, specify “10” as the input value.
High Time Frame Value = Specify the total duration you would like S/R values calculated for before the indicator resets its calculation. For example, if you want each calculation to reset after 180 minutes, use the input value of “180”. However, if you want each calculation to reset after 90 minutes, use the input value of “90”.
IMPORTANT NOTICE: SOME EXCHANGES (CRYPTOCURRENCY) ARE MISSING DATA FOR CERTAIN DATES/PERIODS. THIS MAY AFFECT YOUR CALCULATION. THIS IS ESPECIALLY TRUE ON HIGHER TIME-FRAMES (SUCH AS THE DAILY). PLEASE DO KEEP THIS IN MIND.
[PX] VWAP Gap LevelHello guys,
another day, another method for detecting support and resistance level. This time it's all about the VWAP and daily gaps it might produce.
How does it work?
The indicator detects when a new daily candle begins and the VWAP makes a big move in either direction. Often it produces a gap and this is where the support or resistance level will be plotted. The idea behind it is, that those gaps get filled at some point in time. You can control how big a VWAP movement ("gap") has to be with the "VWAP Movement %" -setting. Also, you can adjust the style of the level.
If you find this indicator useful, please leave a "like" and hit that "follow" button :)
Have fun and happy trading :)))

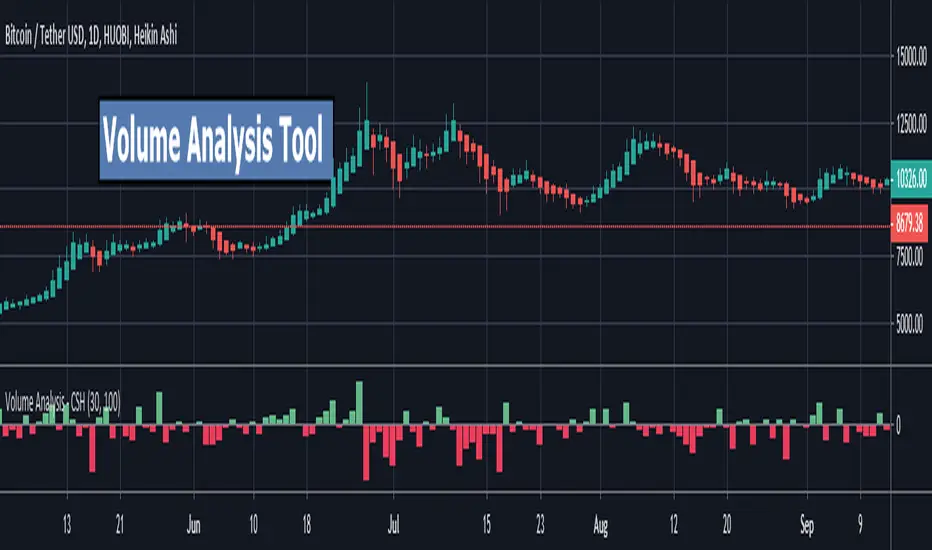
Volume Analysis Tool - CryptoShoots Volume Analysis Tool
Volume Analysis Tool is a technique to simulate tick volume data to get Buying volume and Selling Volume in each bar to any asset .
*** Features
* Delta Volume Mode .
* Detailed Volume mode - Buying and selling for each candle .
* Better understanding to the Accumulation and Distribution using volume analysis easily .
*** Usage
* Turn only one Mode(Delta or Detailed ) ON to let the indicator Shows you its magic .
* Volume Search : by default it's 1 MIN . Note : if you want to change the value understand that the lower the value the better the Accuracy .
//
As a rule of thump use 1 MIN Volume Search for these time frames ( from 5 min to 4 hours ) and 5 min Volume Search for Daily time frame .
[astropark] Support Resistance Trendlines Swing PointDear Followers,
I'm very happy to publish this new tool, which will help you easily find
basic trend momentum (red if a bearish momentum is found, green viceversa)
Support Levels (where you can place your buy orders or short targets)
Resistance Levels (where you can place your sell orders or long targets)
Trendlines , known as diagonal supports and resistances (if price breaks a green one, then it's time to buy/long! otherwise if price breaks a red one, then it's time to sell/short)
Donchian Channel , which will memorize for you latest highs and lows, which may get retested for example
Swing Point , very useful point where to open a position while price holding above or below it
This script:
works on all timeframes
lets you edit each support-resistance cloud settings
lets you activate a third support-resistance cloud if you like
lets you choose if enable only one or disable all of them or whatever combination...
lets you choose to enable or disable trendlines, basic trend, donchian channel, swing point, etc... So very customizable user experience!
This is a premium indicator , so send me a private message in order to get access to this script.

[PX] MTF Standard Deviation LevelHello guys,
once again, I want to show you a different method for detecting support and resistance level. Today's approach is similar to the one I posted recently, but the way the level will be detected is different. I call it the multi-timeframe standard deviation level.
How does it work?
The method is similar to the way Bollinger Bands work. First, the indicator calculates the standard deviation, which can be influenced by the "Sensitivity"- and "Length"-setting.
Sensitiitiy - the higher the value, the fewer level will be shown
Length - simply the length for the standard deviation formula
Second, the detected value will be added (for resistance level) or substracted (for support level) from the current close. Once the upper or lower boundaries are crossed, a level will appear and keeps moving until the up- or downward movement finishes. Then the level will settle and stay in place.
Again, as seen in my previous indicator, you can control all the different styles and colors for the levels. The best part is, the whole thing works in a multi-timeframe fashion. In an example, you could select the "Daily" level and plot them on a 4-hour chart.
If you find this indicator useful, please leave a "like" and hit that "follow" button :)
Have fun, happy trading and once again Merry Christmas :)))

ChaosSN Automatic Price TargetsThis script will figure out if we're currently in an uptrend or downtrend and will plot price targets automatically.
-Blue price lines are likely soft stops (not always).
-Green price lines indicates we're currently in an uptrend for that timeframe and provides some hard stop resistances.
-Red price lines indicates we're currently in a downtrend for that timeframe and provides some hard stop supports.

bg_FibCastVersion 1.0
A simple script to place horizontal lines where fib levels are, over a given period of candles, on a specified or charted time-frame. Includes the option to fib-retrace a "sub-zone" or the space between Fibonacci levels.
In The Depicted Example Above:
- Large white Fibonacci Lines from 377 Daily Candle Range, Gray "Sub-Fib" levels are plotted in "Zone 4" of the 377 1D Fib. Re-trace. (Zone 4 is between the 0.5 and 0.618, Zone 3 is between 0.618 and 0.786, etc.)
- Optional 1.618 Fib Extension is available for the main Fibonacci indicator, but is not shown here (Disabled/Hidden).
- Supports multiple time-frames, which is also depicted above. (377 Daily Candles used on 12-Hour chart.)

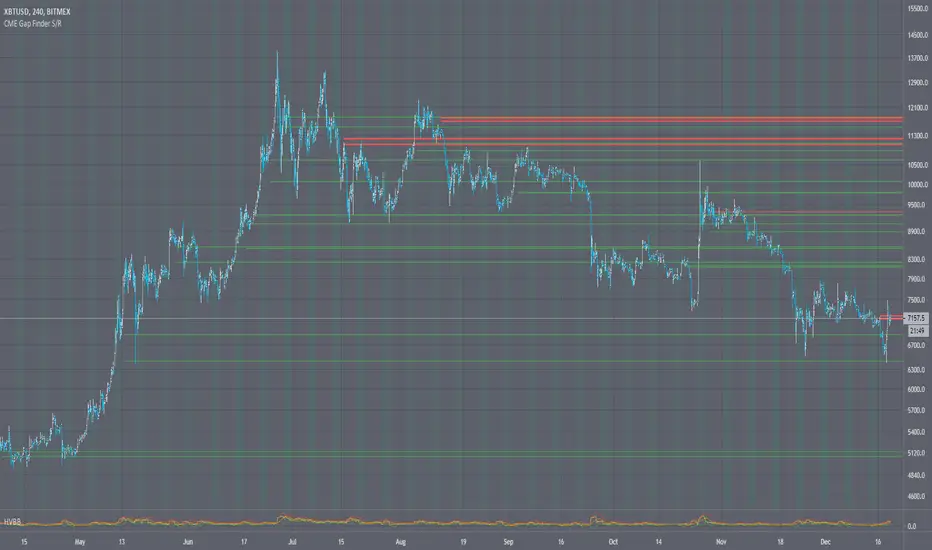
CME Bitcoin Gap Finder Orderblock Support ResistanceCME Bitcoin Gap Finder Orderblock Support Resistance
Intro
I had a backlog of scripts to release, and so everyone is getting some Christmas gifts early!
I have been watching CME gaps and how they relate to BTC for over a year now. I find they make good orderblock support/resistance areas.
Description
There is a limitation to how many lines I can draw with the new pine script functions. So for instance if you want to see the gaps from 2018 I have included a date range selector (similar to how a backtest works). This way you can only display the gaps from the dates ranges you want to see.
There's also the ability to check for gaps on the daily, 12h, 4h, and 1h charts. I recommend using 12H. But know that depending on what period you choose it will effect the size of the gaps, so experiment and see what works for you.
Lastly I included the ability to have background highlights whenever CME is closed on the weekend, just for visual reference.
You can use this indicator on any BTC ticker, and it will show you where the CME gaps are (without having to switch/reference the CME chart).
👍 We hope you enjoyed this indicator and find it useful! We post free crypto analysis, strategies and indicators regularly. This is our 74th script on Tradingview!
💬Check my Signature for other information
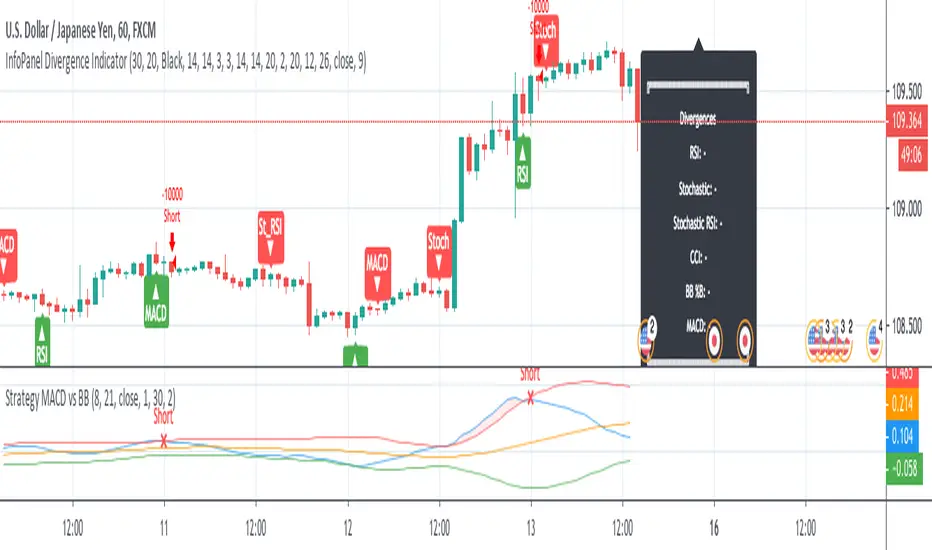
Strategy MACD vs BBStrategy based on MACD and Bollinger Bands, where BBs are calculatend from macd signal.
Strategy doesn't open at breakout of bands but it waits for a pullback.
Upper and lower bands are used as resistance and support.
There are various parameters that can be optimized.
I have also a study with alerts.
Please use comment section for any feedback or cointact me if you need support.
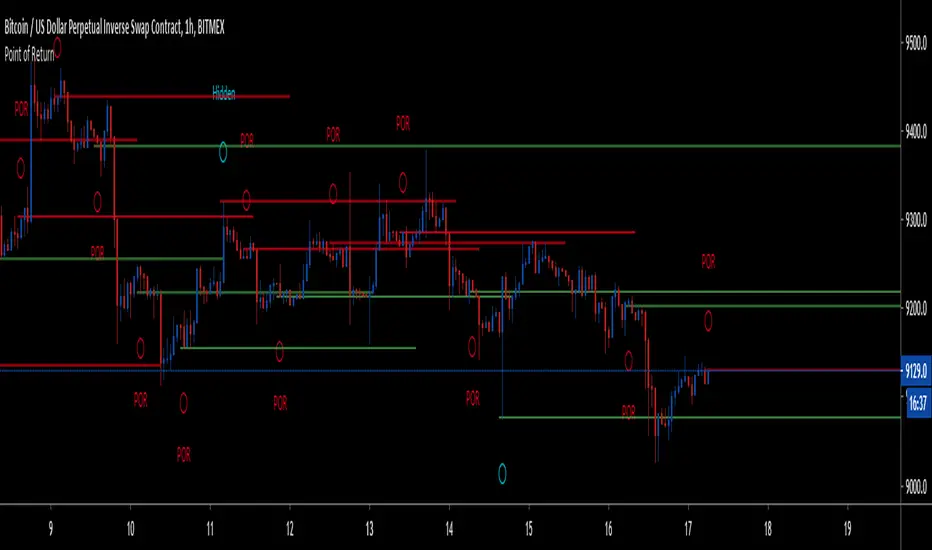
Point of Return - Dynamic Price Reaction RangesThis is one of the many parts of my upcoming strategy, and used by me on daily basis.
This indicator incorporates various price action models and candlestick patterns, and combines them together to form a price point which is highly reactive in nature.
In the background it works on multitude of permutations and combinations to calculate the price point which tell us exactly where price will most likely react in the future, removing rooms for errors while drawing support and resistance .
This can be used on multiple ways:
1. Chop indication - As soon as the indication pops up, it marks a price which is most likely start of a chop zone and break from either direction marks end of the chop zone.
2. Point of Return - As soon as a the price moves away from the chop zone, it will most likely return to the indicated price before moving in the direction of the break, giving us high RR trades.
3. Dynamic Support and Resistance - This also acts as a dynamic support and resistance and apart from your already established S/R you can incorporate these price points as your decision maker or breakers.
PS : This is not to be used as a Buy/Sell signals and is only should act as confirmation of what you already know and to gauge the market sentiments.
There is a hidden easter egg on this page and chart which gives you preview of the upcoming indicator. Have fun finding out.
You can reach me here on my DM for more details.
Below are the few snaps from different timeframes:
1. 4H XBTUSD -
2. 2H XBTUSD -
3. 8H XBTUSD -
Stock Analysis SoftwareStock Analysis Software is a full trading setup and style that is meant for swing trading stocks, but can also be used for Forex, cryptocurrencies, indices and commodities. Whatever your choice of trading style (Intraday, Scalping, Swing trading, Investing) or trading instrument is (FX, Futures, Cryptos, Stocks) I can tailor it for you specifically. For example if you want to use it for trading Forex intraday I will show you how to use it for that.
The software consists of 11 indicators, 7 are custom and 4 are common and well known indicators available on Tradingview. The system itself is part software and part learning my specific pattern finding techniques. There is no one without the other. This is a complete system
This trading system is something I have developed over the last 10 years through extensive research and development and is now available on this platform.
The indicators used are mostly screening for trend breakouts, support and resistance, specific candle patterns, overextended, volume spikes and more.
This is a system that can be taught easily if one is motivated to learn.
The setup includes a video guide and a live one-on-one full breakdown on how to use it to your benefit.

Heatmap - Support & Resistance (Volume Clusters)Heatmap - Support & Resistance (Volume Clusters)
The Heatmap is based on the real traded volume.
The Heatmap can help identify the levels of Support and Resistance , thus validating other indicators' Oversold or Overbought conditions.
Small blocks don't have much significance. On the other hand, bigger and brighter ones would mean strong levels of Support or Resistance .
Alerts are available to be set to fire whenever the Support or Resistance levels are reached.
Related tools:
• Volume Delta
• CVD
• Counters Ratio

Fibonacci BandsFibonacci Bands are derived from Fibonacci ratios expansion from a fixed moving average.
These bands help traders find key areas of support and resistance . "Fibonacci bands" are
computed by adding a Fibonacci ratio distance (Up and Down) from a "key moving" average
(21, 34, 89 periods). An 8 period average of "True range" is computed. The multiples of
Fibonacci ratios of this range are added to the fixed moving average to compute Fibonacci
Bands
One of the best ways to find trend reversals is to watch the price action near the extreme bands
(both lower and higher). Markets tend to reverse when prices trade outside of the band for a
few bars and again trade inside the bands. After reversals, markets also tend to trade from one
extreme band to the other end (opposite) of the extreme bands.

Scalp Master V1.1This version has added support and resistance to help traders identify the best entry and exit points.
Also, we included a linear regression band to identify the last period's trend, the prices would normally swing between the upper and lower dotted white line and it gives a good starting point for traders to identify possible bounces or rejection moments of the price.
