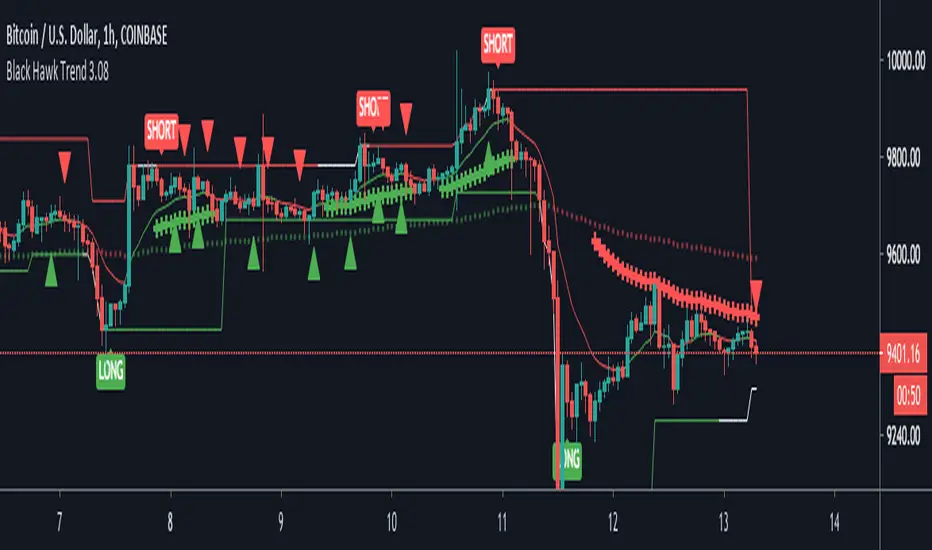
Trade Range Indicator BASIC - AltSumo.com Ideal for automatically updating the traderanges on a hourly, daily, weekly or monthly timeframe . You don't have to add support/resistance lines manually anymore. Just choose the desired range timeframe and the indicator will add the the ranges on the chart....
An indicator that plots the daily ATR upper and lower levels on a chart. This is a TradingView re-write from Trader Dante's dATR indicator.
Experimental support / resistance lines inspired by the ichimoku indicator.
This is a trend line inspired by the Ichimoku indicator. Feel free to change the time frame depending on what you're looking at. Feel free to use it as resistance / support levels or even figure something out yourself.
Support/resistance zones Green = support Red= resistance
An utility tool that plots a dynamic level using the opening price of each year on the chart. Allows to highlight the change in the price relative to this level.
This is an indicator that draws support and resistance zones / levels based on price action in and around Keltner Channels. There are 3 different modes; Draw zones based on price breaking the upper band Draw zones based on price breaking the lower band Draw zones if price stays within the bands for a prolonged period of time. You can also decide if...
Indicator returns an average of 5 SMAs. an interesting point that I have noticed that the price has several times reacted on it. Note 1: Do not just use this as a criterion for buying and selling, use as one more aid. Note 2: It is possible to leave in the chart all the averages, if you feel it...
Volume Area Profile (Индикатор горизонтальных объемов) Данные введены для графика GC!- Futures Gold - Дата: 20 мая 2019 Индикатор интегрирует данные полученные Вами после анализа кластерного графика объемов цены и строит зоны профиля объемных уровней поддержки и сопротивления Необходимо отредактировать входные параметры: Resistance_max - верхняя граница зоны...
THE BEST FOREX, BINARY OPTIONS, AND CRYPTO INDICATORS FOR TRADINGVIEW.COM Green = Support Zones Red = Resistance Zones The basic trading method for using support and resistance is to buy/long near support in uptrends, and to sell/short near resistance in downtrends. Also included in this indicator are a Higher High, Lower High, Higher Low, and Lower Low...
This script finds pivot highs and pivot lows then calculates higher highs & lower lows. And also it calculates support/resistance by using HH-HL-LL-LH points. Generally HH and HL shows up-trend, LL and LH shows down-trend. If price breaks resistance levels it means the trend is up or if price breaks support level it means the trend is down, so the script...
Support and Resistance Levels -This indicador show automatically the support and resistance levels. - Allows you to select the amount and importance of the S/R levels. -This indicator allows to overlay a custom timefame S/R levels. -You can activate notification alerts for any of the conditions. -Works in any timeframe or market like Forex, Crypto,...
"Levels Generator with Fibs" is an easy to use and a well coded script that can be used by traders of all levels from beginners to advanced professionals. What does the script do? Plots the support and resistance levels automatically based on user preference of Local or Global levels from indicator settings. Plots Fibonacci retracement levels...
Automatic Fibonacci Support and Resistance derived from the recent Average True Range. This tool is used as a guideline for where mathematically evident support and resistances are estimated to be. Unlike typical methods, this will adjust as candles print and the ATR expands or contracts assisting the user in ensuring realistic price targets relative to the...