Periodic Linear Regressions [LuxAlgo]The Periodic Linear Regressions (PLR) indicator calculates linear regressions periodically (similar to the VWAP indicator) based on a user-set period (anchor).
This allows for estimating underlying trends in the price, as well as providing potential supports/resistances.
🔶 USAGE
The Periodic Linear Regressions indicator calculates a linear regression over a user-selected interval determined from the selected "Anchor Period".
The PLR can be visualized as a regular linear regression (Static), with a fit readjusting for new data points until the end of the selected period, or as a moving average (Rolling), with new values obtained from the last point of a linear regression fitted over the calculation interval. While the static method line is prone to repainting, it has value since it can further emphasize the linearity of an underlying trend, as well as suggest future trend directions by extrapolating the fit.
Extremities are included in the indicator, these are obtained from the root mean squared error (RMSE) between the price and calculated linear regression. The Multiple setting allows the users to control how far each extremity is from the other.
Periodic Linear Regressions can be helpful in finding support/resistance areas or even opportunities when ranging in a channel.
The anchor - where a new period starts - can be shown (in this case in the top right corner).
The shown bands can be visualized by enabling Show Extremities in settings ( Rolling or Static method).
The script includes a background gradient color option for the bands, which only applies when using the Rolling method.
The indicator colors can be suggestive of the detected trend and are determined as follows:
Method Rolling: a gradient color between red and green indicates the trend; more green if the output is rising, suggesting an uptrend, and more red if it is decreasing, suggesting a downtrend.
Method Static: green if the slope of the line is positive, suggesting an uptrend, red if negative, suggesting a downtrend.
🔶 DETAILS
🔹 Anchor Type
When the Anchor Type is set to Periodic , the indicator will be reset when the "Anchor Period" changes, after which calculations will start again.
An anchored rolling line set at First Bar won't reset at a new session; it will continue calculating the linear regression from the first bar to the last; in other words, every bar is included in the calculation. This can be useful to detect potential long-term tops/bottoms.
Note that a linear regression needs at least two values for its calculation, which explains why you won't see a static line at the first bar of the session. The rolling linear regression will only show from the 3rd bar of the session since it also needs a previous value.
🔹 Rolling/Static
When Anchor Type is set at Periodic , a linear regression is calculated between the first bar of the chosen session and the current bar, aiming to find the line that best fits the dataset.
The example above shows the lines drawn during the session. The offered script, though, shows the last calculated point connected to the previous point when the Rolling method is chosen, while the Static method shows the latest line.
Note that linear regression needs at least two values, which explains why you won't see a static line at the first bar of the session. The rolling line will only show from the 3rd bar of the session since it also needs a previous value.
🔶 SETTINGS
Method: Indicator method used, with options: "Static" (straight line) / "Rolling" (rolling linear regression).
Anchor Type: "Periodic / First Bar" (the latter works only when "Method" is set to "Rolling").
Anchor Period: Only applicable when "Anchor Type" is set at "Periodic".
Source: open, high, low, close, ...
Multiple: Alters the width of the bands when "Show Extremities" is enabled.
Show Extremities: Display one upper and one lower extremity.
🔹 Color Settings
Mono Color: color when "Bicolor" is disabled
Bicolor: Toggle on/off + Colors
Gradient: Background color when "Show extremities" is enabled + level of gradient
🔹 Dashboard
Show Dashboard
Location of dashboard
Text size
支撐和阻力

Key Zone LocatorThe "Key Locator" indicator identifies important price levels on a chart by analyzing historical data. It does this by:
Counting Touches: It calculates how many times the price touches each level within a specified period. This helps identify levels that the market frequently interacts with, which can indicate significant support or resistance.
Measuring Volume: It also sums up the trading volume at each level during the same period. High volume at a particular level can suggest strong interest or activity, making that level more significant.s based on historical market activity.
By combining these two metrics—touches and volume—the indicator highlights the most important price level on the chart, helping traders make informed decisions based on where the market has shown significant activity in the past.
Level Calculation:
The indicator first identifies the highest and lowest prices over a specified period, which is determined by the length parameter. It then divides this price range into 200 equal segments, creating potential key levels across the chart. Each segment represents a level where the price might show significant activity.
Metric Calculation:
For each of these levels, the indicator calculates two key metrics. First, it counts how many times the price touches or crosses each level during the specified period. Second, it sums up the trading volume associated with these touches at each level. This dual analysis helps in identifying levels that are not only frequently interacted with but also have substantial trading activity.
Normalization:
To facilitate comparison between different levels, the indicator normalizes both the touch count and the volume for each level to a scale from 0 to 10. This involves dividing each metric by its maximum observed value in the period and scaling it accordingly, ensuring that both metrics are on a comparable scale.
Scoring and Balancing:
Each level is assigned a score based on a weighted average of its normalized touch and volume scores. The weight_balance parameter allows users to adjust the emphasis between touches and volume. A higher weight on touches will prioritize levels frequently interacted with, while more emphasis on volume will highlight levels with significant trading activity.
Identify Key Level:
Finally, the indicator identifies the level with the highest combined score as the most significant. This key level is plotted on the chart in red, providing traders with a visual indication of potential areas of support or resistance based on historical data.
This comprehensive approach allows traders to pinpoint where crucial market activity has occurred, aiding them in making strategic decisions based on historical price behavior and trading volumes.
Please note that while the "Key Locator" indicator provides valuable insights based on historical data, it does not guarantee future performance or outcomes. Trading involves risks, and it's important to use this tool in conjunction with other analysis methods and risk management strategies. Always consider your financial situation and consult with a financial advisor if necessary before making trading decisions.

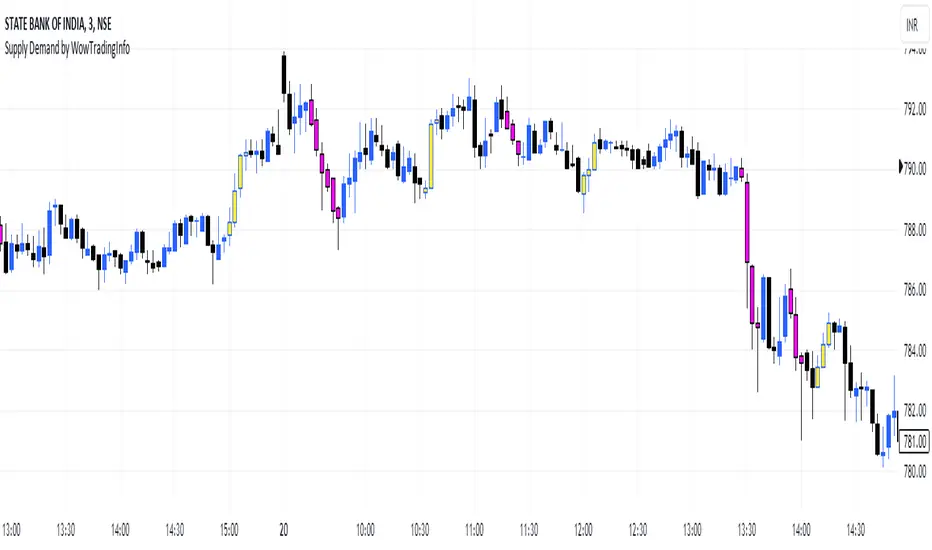
Supply Demand by WowTradingInfoThis indicator identifies supply and demand zones based on price action, which is a crucial concept for technical analysis. Supply zones represent areas where the price has historically shown selling pressure, while demand zones show areas with strong buying interest.
Explanation:
Rally-Base-Rally (RBR):
A rally is defined as a price movement where the percentage increase between the current high and the previous low.
A base is defined as a period of consolidation where price stays within a narrow range, with low volatility.
A RBR pattern is detected when a rally occurs, followed by a base, and then another rally.
Drop-Base-Drop (DBD):
A drop is identified when the price decrease between the current low and the previous high.
A DBD pattern is detected when a drop occurs, followed by a base, and then another drop.
Zone Marking:
RBR Zones are drawn with repaint the candles color as yellow (where buyers are likely to step in).
DBD Zones are drawn with repaint the candles color as pink (where sellers are likely to step in).
Example Use Case:
Rally-Base-Rally: When you see a yellow zone, it suggests that price rallied, consolidated, and is likely to rally again. It can be used as a potential demand zone.
Drop-Base-Drop: pink zones indicate that price dropped, consolidated, and may drop again. It can be used as a potential supply zone.
This script will help you automatically detect and visualize RBR and DBD patterns on your TradingView chart. These zones can provide valuable insights into areas where price may react due to past buying or selling pressure.
Thrax - Intraday Market Pressure ZonesTHRAX - INTRADAY MARKET PRESSURE ZONES
This indicator identifies potential support and resistance zones based on areas of significant market pressure. It dynamically plots these zones and adjusts their visibility based on real-time price action and user-defined thresholds. The indicator is useful for traders seeking to understand intraday market pressure, visualize zones of potential price reversals, and analyze volume imbalances at critical levels.
1. Support/Resistance Zones: Wherever the price retraces significantly from its high a support zone is drawn and when it retraces significantly from it low a resistance zone is drawn. The significant retracing is measured by the wick threshold percentage. For instance, if set to 75%, it implies price retracement of 75% either from high or from low for a particular candel
Volume delat: Displays volume delta information where the zones are formed. This can be used by trader to consider only those zones where delta is significant.
2. Breakout Detection: Monitors for price breakouts beyond established zones, deleting zones that are invalidated by price movement. when the price breaks a given zone with the threshold, it is considered to be mitigated and chances of trend continuation is decent.
Candle Coloring: Uses color codes (green, red, and yellow) to represent bullish, bearish, and indecisive (doji) candles, aiding quick visual assessment.
INPUTS
1. Wick Threshold (%) : Sets the minimum wick percentage required for a candle to be considered a support or resistance candidate.
2. Breakout Threshold (%) : Determines the percentage above or below a support or resistance zone that defines a breakout condition. if breaks a zone with the set threshold then the zone will be considered mititgated.
3. Max Number of Support/Resistance Zones : Limits the maximum number of support/resistance zones displayed on the chart, ranging from 1 to 5.
4. Show Wick Percentage Labels : Toggles the display of percentage values for upper and lower wicks on each candle.
TRADE SETUP
Identifying Entry Points: Look for the formation of support or resistance zones. Wait for price to retrace to these zones. if you are willing to take risk, you can consider even zones with low delta. If you want to be more cautious you should consider zones with high delta.
Volume Confirmation: Use the volume information to confirm the strength of the zone. Strong volume differences (displayed as labels) can indicate significant market pressure at these levels.
Breakout Trades: If price breaks through a support/resistance zone by more than the breakout threshold, consider this a signal for a potential trend continuation in the breakout direction.
Risk Management: Set stop-loss levels slightly outside of the identified zones to minimize risk in case of false breakouts. This can be set in input setting for breakout threshold.
Bonus Tip : Mark your significant highs and lows from where prices have retraced multiple times in the near past and if the zone is near these levels it can serve s a strong candidate of support or resistance
Therefore, in conclusion monitor the zones, based on delta and volume presence filter out the zone, wait for price retracement to the zone, intiate the trade with stop loss below zone with a set percentage.
Support and ResistanceThis indicator, titled "Support and Resistance," is designed to identify and display key price levels based on volume and pivot points. It's a versatile tool that can be adapted for different market views and timeframes.
Key Features
Market View Options
The indicator offers three market view settings:
Short term
Standard
Long term
These settings affect the lookback periods used in calculations, allowing users to adjust the indicator's sensitivity to market movements.
Volume-Based Levels
The indicator calculates support and resistance levels using a rolling Point of Control (POC) derived from volume data. This approach helps identify price levels where the most trading activity has occurred.
Pivot Points
In addition to volume-based levels, the indicator incorporates pivot points to identify potential support and resistance areas.
Customizable Appearance
Users can adjust:
Number of lines to display (1-8)
Colors for support and resistance levels
Line thickness based on level importance
Calculation Methods
Rolling POC
The indicator uses a custom function f_rolling_poc to calculate the rolling Point of Control. This function analyzes volume distribution across price levels within a specified lookback period.
Pivot Points
Both standard and quick pivot points are calculated using the rolling POC as input, rather than traditional price data.
Level Importance
The indicator assigns importance to each level based on:
Number of touches (how often price has interacted with the level)
Duration (how long the level has been relevant)
This importance score determines the thickness of the displayed lines.
Unique Aspects
Dynamic Line Thickness: Lines become thicker when levels overlap, highlighting potentially stronger support/resistance areas.
Adaptive Coloring: The color of each line changes dynamically based on whether the current price is above or below the level, indicating whether it's acting as support or resistance.
Flexible Time Frames: The market view options allow the indicator to be easily adapted for different trading styles and timeframes.
Potential Uses
This indicator could be valuable for:
Identifying key price levels for entry and exit points
Recognizing potential breakout or breakdown levels
Understanding the strength of support and resistance based on line thickness
Adapting analysis to different market conditions and timeframes
Overall, this "Support and Resistance" indicator offers a sophisticated approach to identifying key price levels, combining volume analysis with pivot points and providing visual cues for level importance and current market position.
This Support and Resistance indicator is provided for informational and educational purposes only. It should not be considered as financial advice or a recommendation to buy or sell any security. The indicator's calculations are based on historical data and may not accurately predict future market movements. Trading decisions should be made after thorough research and consultation with a licensed financial advisor. The creator of this indicator is not responsible for any losses incurred from its use. Past performance does not guarantee future results. Use at your own risk.
Price Action Volumetric Breaker Blocks [UAlgo]The Price Action Volumetric Breaker Blocks indicator is designed to identify and visualize significant price levels in the market. It combines concepts of price action, volume analysis, and market structure to provide traders with a comprehensive view of potential support and resistance areas. This indicator identifies "breaker blocks," which are price zones where the market has shown significant interest in the past.
These blocks are created based on swing highs and lows, and are further analyzed using volume data to determine their strength. The indicator also tracks market structure shifts, providing additional context to price movements.
By visualizing these key levels and market structure changes, traders can gain insights into potential areas of price reversal or continuation, helping them make more informed trading decisions.
🔶 Key Features
Dynamic Breaker Block Identification: The indicator automatically detects and draws breaker blocks based on swing highs and lows. These blocks represent areas of potential support and resistance.
Volume-Weighted Strength Analysis: Each breaker block is analyzed using volume data to determine its bullish and bearish strength. This is visually represented by the proportion of green (bullish) and red (bearish) coloring within each block.
Market Structure Break (MSB) and Break of Structure (BOS): The indicator identifies and labels Market Structure Breaks (MSB) and Break of Structure (BOS) events, providing context to larger market trends.
Customizable Settings:
- Adjustable swing length for identifying pivot points
- Option to show a specific number of recent breaker blocks
- Choice between wick or close price for violation checks
- Toggle to hide overlapping blocks for cleaner analysis
Violation Detection: Automatically detects when a breaker block has been violated (broken through), either by wick or close price, depending on user settings.
Overlap Control: Provides an option to hide overlapping order blocks, ensuring that the chart remains clean and easy to read when multiple blocks are detected in close proximity.
🔶 Interpreting Indicator
Breaker Blocks:
Breaker blocks are key areas where the price moves through and invalidates a previously identified order block. The indicator detects a breaker block when the price violates an order block by exceeding its high or low (depending on whether it's a bullish or bearish block). This violation is determined by either the wick or the close of a candle, depending on the user's selection in the "Violation Check" setting. When a breaker block is detected, the indicator removes the violated order block from the chart, signaling that the zone is no longer relevant for future price action.
Bullish Breaker Block: This occurs when a bearish order block (red) is violated by the price closing above the block’s top boundary or when the wick surpasses this level. It signals that a prior bearish structure has been invalidated, and the market may shift to a bullish trend.
Bearish Breaker Block: This occurs when a bullish order block (teal) is violated by the price closing below the block’s bottom boundary or when the wick drops below it. It suggests that a previous bullish structure has been broken, indicating potential bearish momentum.
Market Structure Labels:
"MSB" (Market Structure Break) labels indicate a potential change in trend direction.
"BOS" (Break of Structure) labels confirm the continuation of the current trend after breaking a significant level.
Block Strength:
A block with more green indicates stronger bullish interest.
A block with more red indicates stronger bearish interest.
The relative sizes of the green and red portions show the balance of power between buyers and sellers at that level.
🔶 Disclaimer
Use with Caution: This indicator is provided for educational and informational purposes only and should not be considered as financial advice. Users should exercise caution and perform their own analysis before making trading decisions based on the indicator's signals.
Not Financial Advice: The information provided by this indicator does not constitute financial advice, and the creator (UAlgo) shall not be held responsible for any trading losses incurred as a result of using this indicator.
Backtesting Recommended: Traders are encouraged to backtest the indicator thoroughly on historical data before using it in live trading to assess its performance and suitability for their trading strategies.
Risk Management: Trading involves inherent risks, and users should implement proper risk management strategies, including but not limited to stop-loss orders and position sizing, to mitigate potential losses.
No Guarantees: The accuracy and reliability of the indicator's signals cannot be guaranteed, as they are based on historical price data and past performance may not be indicative of future results.

Dynamic Resistance and Support LinesThis script is designed to dynamically plot support and resistance lines based on full-dollar and half-dollar price levels relative to the close price on a chart. The script is particularly useful for day traders and scalpers, as it helps visualize key psychological price levels that often act as support and resistance zones in volatile and fast-moving markets in real time.
Key Features:
Dynamic Resistance and Support Levels:
Full-dollar levels: These are calculated by rounding the close price to the nearest full dollar and then extending the levels by adding and subtracting increments of 1 (e.g., $1, $2, $3).
Half-dollar levels: These are calculated by adding and subtracting 0.5 increments to the nearest full-dollar price, providing additional reference points. The historical full-dollar levels remain where support and resistance may have occurred in the past.
Extend Lines:
You can toggle whether the support and resistance lines are extended to the right, left, or both directions. This allows flexibility in projecting potential future areas of support or resistance.
Custom Line Extension:
The user can set the number of bars (or time periods) that the support and resistance lines will extend, giving control over how long the levels remain on the chart.
Color-Coded Lines:
Red lines represent full-dollar resistance and support levels.
Blue lines represent half-dollar levels, making it easy to differentiate between key psychological price zones.
Line Flexibility:
The script allows the lines to extend both left and right on the chart, making it useful for analyzing historical price action or projecting future price movements. The number of bars for extension is customizable, allowing for tailored setups.
Nearest Full Dollar Plot:
The nearest full-dollar price level is plotted as a yellow circle on the chart. This serves as a quick visual cue for traders to monitor price proximity to critical levels.
Benefits in Day Trading, Scalping, and Volatile Markets:
Visualizing Key Psychological Levels:
Full-dollar and half-dollar price levels often act as psychological barriers for traders. This script helps traders easily identify these levels, which are important in both fast-moving markets and during sideways consolidation.
Improved Decision-Making:
By automatically drawing these support and resistance levels, the script helps day traders and scalpers make quicker and more informed decisions, especially in volatile markets where every second counts.
Adaptability to Market Conditions:
The flexibility of extending lines based on trader preferences allows the user to adapt the script to various market conditions, such as high volatility or trend-based trading, providing a clear view of potential breakout or reversal areas.
Better Risk Management:
Having predefined support and resistance levels helps traders better manage risk, as these levels can act as logical areas for setting stop losses or taking profits.
This script is especially valuable for traders looking to capitalize on quick market movements or identify key entry and exit points during market volatility.
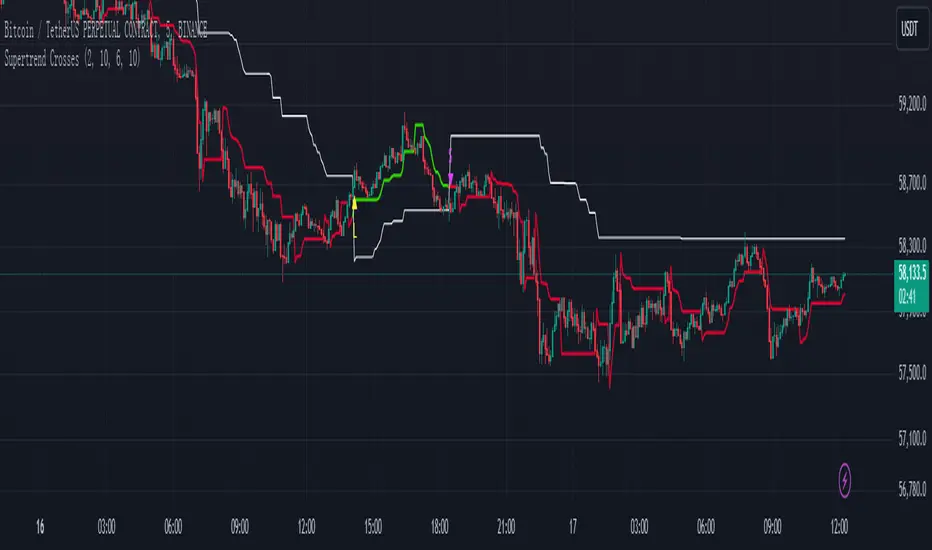
Supertrend Crosses_AITSupertrend Crosser
Overview:
The "Supertrend Crosses" indicator is a technical analysis tool that combines two Supertrend lines with different parameters to generate buy and sell signals based on their crossovers. The indicator uses color coding to visualize the market trend and provides alerts for potential trade entries.
1. Settings and Inputs:
Supertrend A:
Factor: Multiplier for the ATR (Average True Range), which determines the sensitivity of Supertrend A.
ATR Period: Number of periods used to calculate the ATR for Supertrend A.
Supertrend B:
Factor: Multiplier for the ATR, which determines the sensitivity of Supertrend B.
ATR Period: Number of periods used to calculate the ATR for Supertrend B.
2. Indicator Components:
Supertrend A:
Plotted on the chart using dynamic coloring:
Green when Supertrend A is above Supertrend B.
Red when Supertrend A is below Supertrend B.
Supertrend B:
Plotted on the chart in white color to provide a visual reference for the crossover signals.
3. Crossover Signals:
Long Signal:
Triggered when Supertrend A crosses above Supertrend B.
A yellow upward triangle ("L") is displayed on the chart below the price bar.
Short Signal:
Triggered when Supertrend A crosses below Supertrend B.
A fuchsia downward triangle ("S") is displayed on the chart above the price bar.
4. How to Use the Indicator:
Identifying Trend Changes:
When Supertrend A crosses above Supertrend B, it indicates a potential upward trend, generating a buy signal.
Conversely, when Supertrend A crosses below Supertrend B, it suggests a potential downward trend, generating a sell signal.
Signal Visualization:
Yellow "L" markers indicate long entry points (buy signals).
Fuchsia "S" markers indicate short entry points (sell signals).
Alerts:
The indicator is equipped with alert conditions for both long and short signals. Users can set up alerts in TradingView to receive notifications when these signals occur.
5. Customization:
Supertrend Parameters:
The factors and ATR periods for Supertrend A and B can be adjusted in the settings to fit different market conditions and trading strategies.
Show Signals Option:
The user can toggle the display of the buy and sell signals on the chart through the "Show Signals?" checkbox in the settings.
6. Visual Representation:
Lines:
Supertrend A: Plotted with dynamic coloring based on its relation to Supertrend B.
Supertrend B: Plotted in white for a clear reference.
Markers:
"L" (yellow) for long signals and "S" (fuchsia) for short signals are plotted on the chart at the point of crossover.
7. Alerts Setup:
Buy Signal Alert: Alerts the user when Supertrend A crosses above Supertrend B.
Sell Signal Alert: Alerts the user when Supertrend A crosses below Supertrend B.
8. Advantages:
Simple and Effective: This indicator simplifies trend identification by using crossovers of two Supertrend lines.
Customizable: The indicator's parameters can be tailored to suit different trading styles and asset classes.
Alerts: Provides alert functionality to ensure traders do not miss trading opportunities.
9. Usage Tips:
Combine with Other Indicators: For more reliable signals, consider using this indicator in conjunction with other technical analysis tools like RSI, MACD, or support and resistance levels.
Risk Management: Always use appropriate risk management techniques, such as stop-loss orders, to protect your capital.
The "Supertrend Crosses" indicator offers a straightforward approach to identifying potential trend reversals and trade entries using the crossover of two Supertrend lines. It provides clear visual signals and alert notifications, making it a valuable tool for traders looking to incorporate trend-following strategies.
Support Resistance DynamicsThe Support Resistance Dynamics indicator is an advanced technical analysis tool designed to identify and visualize key support and resistance levels in real-time. This innovative indicator stands out from traditional support and resistance tools by employing a dynamic approach that adapts to market conditions.
Key Features:
Dynamic Level Calculation: Unlike static support and resistance indicators, this tool continuously updates levels based on recent price action, providing traders with the most relevant and up-to-date information.
Logarithmic Scale Option: The indicator offers a unique logarithmic scale feature, essential for analyzing long-term trends or assets with significant price changes. This allows for more accurate level plotting across various timeframes and price ranges.
Customizable Display: Users can adjust the number of support and resistance lines displayed, allowing for a clean and uncluttered chart view while focusing on the most significant levels.
Adaptive Slope Calculation: The indicator uses an innovative approach to calculate the slope of support and resistance lines, offering options from dynamic adaptation to fixed long-term periods. This ensures the lines remain relevant in both trending and ranging markets.
Enhanced Visualization: With customizable line colors, styles, and transparency, traders can easily distinguish between support and resistance levels, improving chart readability and analysis.
Flexible Period Settings: From dynamic calculations based on recent pivots to fixed long-term periods, the indicator adapts to various trading styles and timeframes.
The Support Resistance Dynamics indicator is particularly useful for:
Identifying potential reversal points in trends
Setting more accurate entry and exit points for trades
Placing stop-loss orders with greater precision
Recognizing breakout levels for potential new trends
By combining dynamic calculation methods with customizable visual elements, this indicator provides traders with a powerful tool for market analysis. Whether you're a day trader looking for short-term opportunities or a long-term investor analyzing macro trends, the Support Resistance Dynamics indicator offers valuable insights to enhance your trading strategy.
This indicator is provided for informational and educational purposes only. It should not be considered as financial advice or a recommendation to buy or sell any financial instrument. Past performance is not indicative of future results. Trading involves significant risk of loss. Users should conduct their own research and due diligence before making any investment decisions. The creator of this indicator is not responsible for any losses incurred from its use. Always test thoroughly on demo accounts before applying to live trading.

Relative volume zone + Smart Order Flow Dynamic S/ROverview:
The Relative Volume Zone + Smart Order Flow with Dynamic S/R indicator is designed to help traders identify key trading opportunities by combining multiple technical components. This script integrates relative volume analysis, order flow detection, VWAP, RSI filtering, and dynamic support and resistance levels to offer a comprehensive view of the market conditions. It is particularly effective on shorter timeframes (M5, M15), making it suitable for scalping and day trading strategies.
Key Components:
1. Relative Volume Zones:
• The script calculates the relative volume by comparing the current volume with the average volume over a defined lookback period (volLookback). When the relative volume exceeds a specified multiplier (volMultiplier), it indicates a high volume zone, signaling potential accumulation or distribution areas.
• Purpose: Identifies high-volume trading zones that may act as significant support or resistance, indicating possible entry or exit points.
2. Smart Order Flow Analysis:
• The indicator uses Volume Delta (the difference between buying and selling volume) and a Cumulative Delta to detect order imbalances in the market.
• Order Imbalance is identified using a moving average of the Volume Delta (orderImbalance), which helps highlight hidden buying or selling pressure.
• Purpose: Reveals market sentiment by showing whether buyers or sellers dominate the market, aiding in the identification of trend reversals or continuations.
3. VWAP (Volume Weighted Average Price):
• VWAP is calculated over a default daily length (vwapLength) to show the average price a security has traded at throughout the day, based on both volume and price.
• Purpose: Provides insight into the fair value of the asset, indicating whether the market is in an accumulation or distribution phase.
4. RSI (Relative Strength Index) Filter:
• RSI is used to filter buy and sell signals, preventing trades in overbought or oversold conditions. It is calculated using a specified period (rsiPeriod).
• Purpose: Reduces false signals and improves trade accuracy by only allowing trades when RSI conditions align with volume and order flow signals.
5. Dynamic Support and Resistance Levels:
• The script dynamically plots support and resistance levels based on recent swing highs and lows (swingLookback).
• Purpose: Identifies potential reversal zones where price action may change direction, allowing for more precise entry and exit points.
How It Works:
• Buy Signal:
A buy signal is generated when:
• The price enters a high-volume zone.
• The price crosses above a 5-period moving average.
• The cumulative delta shows more buying pressure (cumulativeDelta > SMA of cumulativeDelta).
• The RSI is below 70 (not in overbought conditions).
• Sell Signal:
A sell signal is generated when:
• The price enters a high-volume zone.
• The price crosses below a 5-period moving average.
• The cumulative delta shows more selling pressure (cumulativeDelta < SMA of cumulativeDelta).
• The RSI is above 30 (not in oversold conditions).
• Dynamic Support and Resistance Lines:
Drawn based on recent swing highs and lows, these lines provide context for potential price reversals or breakouts.
• VWAP and Order Imbalance Lines:
Plotted to show the average traded price and highlight order flow shifts, helping to validate buy/sell signals.
How to Use:
1. Apply the Indicator:
Add the script to your chart and adjust the settings to match your trading style and preferred timeframe (optimized for M5/M15).
2. Interpret the Signals:
Use the buy and sell signals in conjunction with dynamic support/resistance, VWAP, and order imbalance lines to identify high-probability trade setups.
3. Monitor Alerts:
Set alerts for significant order flow events to receive notifications when there is a positive or negative order imbalance, indicating potential market shifts.
What Makes It Unique:
This script is unique because it combines multiple market analysis tools — relative volume zones, smart order flow, VWAP, RSI filtering, and dynamic support/resistance — to provide a well-rounded, multi-dimensional view of the market. This integration allows traders to make more informed decisions by validating signals across various indicators, enhancing overall trading accuracy and effectiveness.

FiboTrace.V33FiboTrace.V33 - Advanced Fibonacci Retracement Indicator is a powerful and visually intuitive Fibonacci retracement indicator designed to help traders identify key support and resistance levels across multiple timeframes. Whether you’re a day trader, swing trader, or long-term investor, FiboTrace.V33 provides the essential tools needed to spot potential price reversals and continuations with precision.
Key Features:
• Dynamic Fibonacci Levels: Automatically plots the most relevant Fibonacci retracement levels based on recent swing highs and lows, ensuring you always have the most accurate and up-to-date levels on your chart.
• Gradient Color Zones: Easily distinguish between different Fibonacci levels with visually appealing gradient color fills. These zones help you quickly identify key areas of price interaction, making your analysis more efficient.
• Customizable Levels: Tailor FiboTrace.V33 to your trading style by adjusting the Fibonacci levels and colors to match your preferences. This flexibility allows you to focus on the levels most relevant to your strategy.
• Multi-Timeframe Versatility: Works seamlessly across all timeframes, from 1-minute charts for day traders to weekly and monthly charts for long-term investors. The indicator adapts to your trading horizon, providing reliable signals in any market environment.
• Confluence Alerts: Receive alerts when price enters zones where multiple Fibonacci levels overlap, indicating strong support or resistance. This feature helps you catch high-probability trade setups without constantly monitoring the charts.
How to Use:
• Identify Entry and Exit Points: Use the plotted Fibonacci levels to determine potential entry and exit points. Price retracements to key Fibonacci levels can signal opportunities to enter trades in the direction of the prevailing trend.
• Spot Reversals and Continuations: Watch for price action around the gradient color zones. A bounce off a Fibonacci level may indicate a trend continuation, while a break could signal a potential reversal.
• Combine with Other Indicators: For best results, consider using FiboTrace.V33 in conjunction with other technical indicators, such as moving averages, RSI, or MACD, to confirm signals and enhance your trading strategy.
Timeframe Recommendations:
• Shorter Timeframes (1-minute to 1-hour): Ideal for quick, intraday trades, though signals might be more prone to noise due to rapid market fluctuations.
• Medium Timeframes (4-hour to daily): Perfect for swing trading, offering more reliable Fibonacci levels that capture broader market trends.
• Longer Timeframes (weekly to monthly): Best for long-term investors, where Fibonacci levels act as strong support and resistance based on significant market moves.
• General Tip: Fibonacci retracement levels are more reliable on higher timeframes, but combining them with other indicators like moving averages or RSI can enhance signal accuracy across any timeframe.
Why FiboTrace.V33?
FiboTrace.V33 is more than just a Fibonacci retracement tool—it’s an essential part of any trader’s toolkit. Its intuitive design and advanced features help you stay ahead of the market, making it easier to identify high-probability trading opportunities and manage risk effectively.

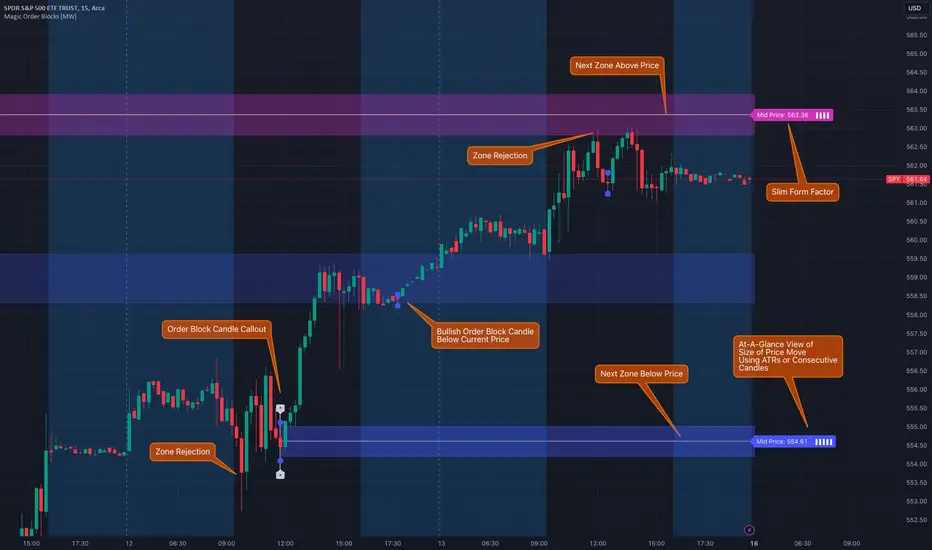
Magic Order Blocks [MW]Add a slim design, minimalist view of the most relevant higher and lower order blocks to your chart. Use our novel method of filtering that uses both the the number of consecutive bullish or bearish candles that follow the order block, and the number of ATRs that the asset’s price changed following the order block. View just the order blocks above and below the current price, or view the backgrounds for each and every one. And, if you're up to it, dig into a comprehensive view of the data for each order block candle.
Settings:
General Settings
Minimum # of Consecutive Bars Following Order Block
Show Bullish Order Blocks Below / Hide Last Bullish Block
Show Bearish Order Blocks Above / Hide Last Bearish Block
Use ATR Filter - Select # of ATRs Below
Closest Order Block is Followed by This Many ATRs
Preferences
Right Offset of Indicator Label
Show Mid-Line from Recent Order Block Indicator Label
Use ATRs Instead of Consecutive Candles in Label Indicator
Show Timestamp of Recent Order Block
Show Large Order Block Detail Labels
Show Small Order Block Labels
Background Settings
Show Background for Recent Order Block Indicator Label
# of Backgrounds to Show Before Now
Show All Bullish Order Block Backgrounds
Show All Bearish Order Block Backgrounds
Calculations
This indicator creates a matrix of each order block that is followed by the user-specified number of consecutive bullish or bearish candles. The data can be further filtered by the number of ATRs that the price moves after the order block - also user-defined. The most recent bearish order block above the current price takes arrays from the initial filtered matrix of arrays, filters once more by the “mid-price” of the order block (the average between the order block candle high and low) and selects the last element from this order block matrix. The same follows for the latest bearish order block above the current price.
How to Use
An order block refers to a price range or zone on a chart where large institutional orders have been placed, causing a significant shift in market direction. These zones are crucial because they often indicate areas of strong buying or selling interest, which can lead to future support or resistance levels. Traders use order blocks to identify potential points of market reversal or continuation.
The Magic Order Blocks default view shows the most recent overhead bearish order block above the current price, and the most recent bullish order block below. These can presumably act as support or resistance levels, because they reflect the last price where a significant price move occurred. “Significant” meaning that the order block candle was followed by many consecutive bullish or bearish candles. Based on the user-defined settings, it can also mean that price moved multiples of the asset's average true range (ATR). More consecutive candles means that the duration of the move lasted a long time. A higher ATR move indicates that the price moved impulsively in one direction.
The default view also shows a label to the right of the current price that provides the price level, the time stamp of the order block (optional), and a sequence of bars that show the significance of the level. By default, these bars represent the number of ATRs that price rose or fell following the order block, but they can be toggled to show the number of consecutive bullish or bearish candles that followed the order block.
Although the default view provides the zones that are most relevant to the current price, past order block candles can also be identified visually with labels as well with translucent backgrounds color-coded for bullish or bearish bias. Overlapping backgrounds can identify an area that has been repeatedly been an area of support or resistance.
A detailed view of each order block can also be viewed the includes the following data points:
Bar Index
Timestamp
Consecutive Accumulated Volume
Consecutive Bars
Price Change over Consecutive Bars
Price/Volume Ratio Over Consecutive Bars
Mid Price of Order Block
High Price of Order Block
Low Price of Order Block
ATRs over Consecutive Bars
- Other Usage Notes and Limitations:
The calculations used only provide an estimated relationship or a close approximation, and are not exact.
It's important for traders to be aware of the limitations of any indicator and to use them as part of a broader, well-rounded trading strategy that includes risk management, fundamental analysis, and other tools that can help with reducing false signals, determining trend direction, and providing additional confirmation for a trade decision. Diversifying strategies and not relying solely on one type of indicator or analysis can help mitigate some of these risks.
Things to keep in mind. Longer timeframes don’t necessarily have a as many consecutive candle drops or gains as with shorter timeframes, so be sure to adjust your settings when moving to 1 hour, 1 day, or 1 week timeframes from 1 minute, 5 minute, or 15 minute timeframes.
DP-OCR MTF & MA 2024This script developed is designed for multi-timeframe analysis of previous open, close, and range, with additional signal plots based on various percentage extension levels. It also incorporates EMA calculations for crossover strategies. Here's a quick breakdown of what the script does:
Key Features:
1. Timeframes:
o Two separate timeframes (TF1 and TF2), which can be set by the user (e.g., 15 mins, 30 mins, daily, etc.). The script computes price actions and extensions for both timeframes. For better analysis, use Daily in TF1 and Weekly in TF2
2. Extension Levels:
o Calculates and plots 10%, 21%, 31%, 51%, and 61% extensions (both positive and negative) for each timeframe.
o The most commonly used extension levels are 61%, 31%, -61%, and -21%.
o These extension levels can be turned on or off by the user.
3. Open/Close/Range:
o Tracks the high, low, open, and close for both timeframes.
o Highlights open/close gaps.
o Plots the previous high/low range for both timeframes with a fill and different colors based on price movement.
How to Use:
• You can toggle specific extension levels on or off in the script’s settings.
• For example, when price hits a +61% extension, it could signal a breakout, and when it hits a -61% extension, it may indicate a potential retracement.
• Use these levels in conjunction with your price action analysis to set entry/exit points or stop-loss levels.
4. Today’s Open:
o Plots today’s opening price for both timeframes.
How to Use:
• Use today’s open as a key reference point to determine the day’s price action.
• Compare today’s open with the previous high/low or extension levels to evaluate possible trends or reversals.
5. EMA Calculations:
o The script calculates 5, 15, and 20 period EMAs and plots them on the chart.
o Additional EMA crossover signals can be included for strategy optimization.
How to Use:
• Observe the EMAs for potential crossover signals. For example, a 5-period EMA crossing above a 15-period or 20-period EMA may signal a buy opportunity, while a crossover in the opposite direction may signal a sell.
• Combine the EMA crossovers with extension levels or previous price data to refine your entries and exits.
Customizations Available:
• Users can select whether to display extension levels for either timeframe.
• The script allows automatic adaptation to intraday, daily, weekly, or monthly timeframes based on the current chart settings.
Moreover, the extension levels are calculated based on the previous period’s range, with the most commonly usable extension levels being 61, 31, -61, and -21. These levels are often used for identifying potential price retracements, breakouts, or reversal points in technical analysis.

Volatility Trend Bands [UAlgo]The Volatility Trend Bands is a trend-following indicator that combines the concepts of volatility and trend detection. Built using the Average True Range (ATR) to measure volatility, this indicator dynamically adjusts upper and lower bands around price movements. The bands act as dynamic support and resistance levels, making it easier to identify trend shifts and potential entry and exit points.
With the ATR multiplier, this indicator effectively captures volatility-based shifts in the market. The use of midline values allows for accurate trend detection, which is displayed through color-coded signals on the chart. Additionally, this tool provides clear buy and sell signals, accompanied by intuitive graphical markers for ease of use.
The Volatility Trend Bands is ideal for traders seeking an adaptive trend-following method that responds to changing market conditions while maintaining robust volatility control.
🔶 Key Features
Dynamic Support and Resistance: The indicator utilizes volatility to create dynamic bands. The upper band acts as resistance, and the lower band acts as support for the price. Wider bands indicate higher volatility, while narrower bands indicate lower volatility.
Customizable Inputs
You can tailor the indicator to your strategy by adjusting the:
Price Source: Select the price data (e.g., closing price) used for calculations.
ATR Length: Define the lookback period for the Average True Range (ATR) volatility measure.
ATR Multiplier: This factor controls the width of the volatility bands relative to the ATR value.
Color Options: Choose colors for the bands and signal arrows for better visualization.
Visual Signals: Arrows ("▲" for buy, "▼" for sell) appear on the chart when the trend changes, providing clear entry point indications.
Alerts: Integrated alerts for both buy and sell conditions, allowing you to receive notifications for potential trade opportunities.
🔶 Interpreting Indicator
Upper and Lower Bands: The upper and lower bands are dynamic, adjusting based on market volatility using the ATR. These bands serve as adaptive support and resistance levels. When price breaks above the upper band, it indicates a potential bullish breakout, signaling a strong uptrend. Conversely, a break below the lower band signals a bearish breakout, indicating a downtrend.
Buy/Sell Signals: The indicator provides clear buy and sell signals at breakout points. A buy signal ("▲") is generated when the price breaks above the upper band, suggesting the start of a bullish trend. A sell signal ("▼") is triggered when the price breaks below the lower band, indicating the beginning of a bearish trend. These signals help traders identify potential entry and exit points at key breakout levels.
Color-Coded Bars: The bars on the chart change color based on the trend direction. Teal bars represent bullish momentum, while purple bars signify bearish momentum. This color coding provides a quick visual cue about the market's current direction.
🔶 Disclaimer
Use with Caution: This indicator is provided for educational and informational purposes only and should not be considered as financial advice. Users should exercise caution and perform their own analysis before making trading decisions based on the indicator's signals.
Not Financial Advice: The information provided by this indicator does not constitute financial advice, and the creator (UAlgo) shall not be held responsible for any trading losses incurred as a result of using this indicator.
Backtesting Recommended: Traders are encouraged to backtest the indicator thoroughly on historical data before using it in live trading to assess its performance and suitability for their trading strategies.
Risk Management: Trading involves inherent risks, and users should implement proper risk management strategies, including but not limited to stop-loss orders and position sizing, to mitigate potential losses.
No Guarantees: The accuracy and reliability of the indicator's signals cannot be guaranteed, as they are based on historical price data and past performance may not be indicative of future results.

Dynamic ConfluenceThe Dynamic MA Confluence Indicator is a powerful tool designed to simplify your trading experience by automatically identifying the most influential moving average (MA) lengths on your chart. Whether you're using Simple Moving Averages (SMA) or Exponential Moving Averages (EMA), this indicator helps you pinpoint the MA length that holds the greatest confluence, allowing you to make informed trading decisions with ease.
How It Works:
This indicator analyzes a wide range of moving averages, from short-term to long-term, to determine which ones are closest to each other. By setting a "Proximity Percentage," you can control how close these MAs need to be to be considered as having confluence. The indicator then calculates the average of these close MAs to establish a dynamic support or resistance level on your chart.
Why Use This Indicator?
Automatic Optimization: Unsure of which MA length to apply? The indicator automatically highlights the MA length with the most confluence, giving you a clear edge in identifying significant market levels.
Adaptability: Choose between SMA and EMA to suit your trading strategy and market conditions.
Enhanced Decision-Making: By focusing on the MA length with the greatest influence, you can better anticipate market movements and adjust your strategies accordingly.
Customizable Sensitivity: Adjust the Proximity Percentage to fine-tune the indicator's sensitivity, ensuring it aligns with your trading preferences.
Key Feature:
Current Key Confluence MA Length: Displayed in an optional table, this feature shows the MA length that currently has the most impact on the confluence level, providing you with actionable insights at a glance.
Whether you're a seasoned trader or just starting, the Dynamic MA Confluence Indicator offers a streamlined approach to understanding market dynamics, helping you trade smarter and with more confidence. This presentation text is designed to clearly communicate the purpose, functionality, and benefits of the indicator, making it easy for users to understand its value and how it can enhance their trading strategies.
The Dynamic MA Confluence Indicator is a tool designed to assist traders in analyzing market trends. It should not be considered as financial advice or a guarantee of future performance. Trading involves significant risk, and it is possible to lose more than your initial investment. Users should conduct their own research and consider their financial situation before making trading decisions. Always consult with a financial advisor if you are unsure about any trading strategies or decisions. This disclaimer is intended to remind users of the inherent risks in trading and the importance of conducting their own due diligence.

[DarkTrader] Strong High LowThe Strong High Low indicator calculates strong high and low pivots based on price action and the Average True Range (ATR). The calculation for both the high and low pivots involves analyzing recent candle behavior to identify significant levels where price reversal is likely. Specifically, it looks for consecutive bearish or bullish candles to determine whether a strong high or low has been established.
Indicator In Use :
For strong highs, the indicator checks if three consecutive candles are bearish, meaning their closing price is lower than their opening price. It further examines prior candles to confirm that they followed a specific pattern where a reversal could occur. If one of these earlier candles closed higher than it opened, the indicator assumes that this was a strong high, and it records either the high of the second or third candle from the pattern, depending on their relationship to each other.
Similarly, for strong lows, the indicator searches for three consecutive bullish candles where the close is higher than the open. The algorithm then reviews prior candles in the sequence to ensure that the market condition supports a potential low pivot. If an earlier candle closes lower than it opens, it marks this as a strong low. The final low point for the pivot is chosen based on a comparison between the second and third candles of the pattern.
Once the high and low pivots are determined, the indicator adjusts these levels using the ATR value. The ATR is added to the strong high pivot and subtracted from the strong low pivot to create slightly modified levels. This helps accommodate market volatility by widening the range of the high and low pivots, making the levels more reliable in reflecting potential reversal zones.
Finally, the strong high and low pivot lines are drawn on the chart, extending both to the left and right of the current price, based on the user-defined offset values. These lines give a visual cue of where key resistance and support levels exist, with labels marking the exact pivot values for easy reference.

[DarkTrader] Range Level ProbabilityThis indicator calculates and visualizes significant price levels, such as swing highs, swing lows, and mid-price levels, using advanced mathematical functions and statistical methods. It aims to provide traders with insights into potential support and resistance areas by analyzing past price swings and their statistical properties.
Usage :
Identifying Support and Resistance: The projected swing high and swing low levels can act as potential support and resistance zones. Traders can use these levels to anticipate where the price might reverse or experience a pause in its movement.
Trend Analysis: By analyzing the mid-price level and its relationship to the swing high and low, traders can gain insights into the current market trend and potential price direction.
Customizing for Different Periods: Traders can adjust the input parameters, such as the period for calculating the mean and standard deviation, to tailor the indicator to different timeframes and market conditions.
Enhancing Trading Decisions: The indicator provides additional context for trading decisions by combining statistical analysis with visual projections, helping traders make more informed choices and manage risk effectively.
Key Features :
Statistical Analysis: The indicator utilizes statistical techniques to estimate the probability of future price movements. It calculates the likelihood of price reaching certain levels based on historical data, providing a probabilistic view of potential price targets.
Dynamic Range Calculation: It dynamically calculates important price levels based on a defined period. This period is adjustable, allowing traders to customize the indicator to fit different market conditions and trading strategies.
Customizable Appearance: Traders can customize the colors of the projected lines and labels, making it easier to distinguish between different levels and adjust the visual representation to their preferences.
Real-Time Updates: The indicator updates in real time with each new price bar, ensuring that the projected levels reflect the most current market conditions.
The indicator projects key price levels on the chart, including :
Swing High: The highest price level within a specified period.
Swing Low: The lowest price level within the same period.
Mid-Price: The average price between the swing high and swing low.
These levels are drawn as horizontal lines on the chart, extending into the future, which helps traders anticipate potential support and resistance zones.

[DarkTrader] Dynamic Level ProjectionThis indicator designed to enhance market analysis by projecting key price levels based on recent highs and lows. This script stands out by offering unique dynamic projections that are tailored to the latest market conditions, making it a valuable tool for both short-term and long-term traders.
Level Projection uses proprietary methods to dynamically project levels above and below recent price extremes. It employs two distinct scaling methods—Short Multiply (SM) and Long Multiply (LM)—to calculate these levels. The SM method is used to project resistance levels above recent highs, while the LM method projects support levels below recent lows. This approach ensures that the projected levels are responsive to current market trends and volatility.
How It Works :
The indicator analyzes recent market data to determine the highest and lowest prices over a customizable lookback period. Using the OHLC Lookback parameter, traders can set the duration for which these extreme prices are calculated. Based on these extremes, the indicator projects additional levels using the defined scaling methods. The result is a series of levels that help identify potential support and resistance zones in real time.
Customization Options :
Level Parameter: Defines the lengths for different projected levels.
OHLC Resolution: Selects the timeframe for OHLC data used in calculations.
Box Padding / Height: Controls the visual spacing of the projected levels on the chart.
Start Color and Extend Color: Customize the colors of the projected levels for better visual differentiation.
Real-Time Updates :
The indicator is designed to update in real-time, recalculating and redrawing levels with each new bar. This ensures that traders always see the most current projections and can make timely decisions based on the latest market data.
How to Use :
Traders should apply the indicator to their charts and customize the parameters according to their trading strategy. The projected levels will help in identifying potential support and resistance zones, which can be used to make informed trading decisions and manage risk effectively.

Support Resistance UltimateThe "Support Resistance ULTIMATE" indicator is a comprehensive tool for traders on the TradingView platform, designed to identify key support and resistance levels using two primary techniques: pivot points and volume data. This indicator provides flexibility and customization, allowing traders to adapt it to their specific trading strategies.
KEY FEATURES
Pivot-Based Levels:
This feature calculates support and resistance levels using pivot points, which are derived from the high, low, and close prices of previous trading periods. Pivot points are crucial for forecasting potential market turning points.
Users can customize the pivot calculation by selecting the source type (either 'Close' or 'High/Low') and adjusting the lookback periods for both the left and right sides of the pivot calculation. This flexibility allows traders to adapt the indicator to different market conditions and timeframes.
Volume-Based Levels:
This option focuses on identifying support and resistance levels based on volume data, specifically the Point of Control (POC). The POC represents the price level with the highest traded volume during a specific time period, reflecting a consensus value among market participants.
The indicator includes a rolling POC calculation, allowing traders to dynamically assess areas of significant trading interest that may serve as support or resistance zones.
ADVANTAGES
Customization and Flexibility:
Traders can choose between pivot-based and volume-based levels or use both simultaneously, depending on their analysis needs. This dual approach provides a comprehensive view of market dynamics, accommodating various trading styles.
The indicator offers customizable color settings for support and resistance lines, enhancing chart readability and allowing traders to personalize their visual analysis.
Enhanced Market Insights:
By utilizing pivot points, traders can identify potential reversal or consolidation points, aiding in the prediction of market trends and the establishment of strategic entry and exit points.
Volume-based levels provide insights into market sentiment and participation, highlighting areas of strong support or resistance based on trading volume. This can improve risk management and trade execution by identifying high-probability trading zones.
Importance Scoring:
The indicator calculates the importance of each level based on the number of touches and the duration it holds. This scoring system helps traders assess the strength of support and resistance levels, with thicker lines indicating more significant levels.
This indicator is intended for educational and informational purposes only and should not be considered financial advice. Trading involves significant risk, and you should consult with a financial advisor before making any trading decisions. The performance of this indicator is not guaranteed, and past results do not predict future performance. Use at your own risk.

First Candle High Low LevelsDescription
The "First Candle High Low Levels" Pine Script indicator is designed to highlight the high and low levels of the first candle of the day on your TradingView chart. It works across different timeframes and specifically handles the Indian stock market trading hours (9:15 AM to 3:30 PM IST). The script draws a box from the start to the end of the trading session, visually marking the price range defined by the first candle of the day. Traders can customize the box's border color, fill color, and line width.
Features
Customizable Timeframe: Users can select the desired timeframe for the first candle (e.g., 5-minute, 15-minute, etc.).
Custom Box Appearance: Options to adjust the border color, fill color, and line width of the drawn box.
Auto Reset for Each New Day: The high and low of the first candle are reset daily to mark the start of the next trading day.
Accurate Market Session Handling: The box is drawn from the start of the first candle to the end of the trading session (3:30 PM IST).
Usage
Adding to Chart: Apply the script by copying it into the Pine Script editor in TradingView. Once added, the script will automatically draw a box representing the high and low of the first candle of the day.
Select Timeframe: You can adjust the First Candle Timeframe input to define which timeframe candle will be used for marking the high and low. For example, if you choose a 5-minute timeframe, the high and low of the first 5-minute candle will be used.
Customization:
Adjust the Border Color and Box Fill Color through the input settings to match your chart's style.
Modify the Box Line Width to make the box lines more or less prominent.

CARNAC Trading - Dynamic Support and Resistance LevelsThe **CARNAC Trading - Dynamic Support and Resistance Levels** indicator is designed to help traders identify key support and resistance levels on any chart timeframe. This indicator dynamically detects major support and resistance levels based on historical price pivots and displays them as lines on the chart. The levels are color-coded for easy identification—**green lines** represent support levels below the current price, while **red lines** represent resistance levels above the current price.
Key Features:
- Dynamic Support/Resistance Detection**: Automatically identifies the strongest support and resistance levels on the chart.
- Timeframe Selection**: Allows users to choose a specific timeframe for detecting support and resistance levels, independent of the chart's timeframe.
- Pivot Strength and Lookback Period**: Customizable inputs to control how far back the indicator looks and how strong the pivots need to be for support/resistance detection.
- Level Limitation**: Limits the number of support and resistance lines to keep charts clean, ensuring only the most relevant levels are displayed.
---
How to Use the Indicator:
Inputs and Settings:
1. **Lookback Period**: Defines how many bars back the indicator will consider for detecting support and resistance levels. You can adjust this depending on how much historical data you want to include. A larger value will capture more significant levels, while a smaller value focuses on more recent price action.
2. **Pivot Strength**: This setting determines how significant a high or low must be to qualify as a pivot. A higher pivot strength will capture stronger, more critical levels, while a lower value will detect more frequent, minor pivots.
3. **Max Levels Above/Below Price**: This controls the maximum number of support and resistance levels displayed on each side of the current price. Keeping this number low helps reduce clutter and focuses on the most important levels.
4. **Timeframe for Support/Resistance Detection**: Select the timeframe used for detecting support and resistance levels, which can differ from the chart's timeframe. This is helpful when you're trading on shorter timeframes but want to see key levels from a higher timeframe (e.g., detecting daily levels while trading intraday).
---
Visualization:
- **Green Lines**: Represent support levels below the current price. These are potential areas where buying interest may increase, and the price could bounce upwards.
- **Red Lines**: Represent resistance levels above the current price. These are potential areas where selling interest may increase, and the price could fall downwards.
---
Example Usage:
1. **Identifying Support and Resistance Zones**: Use this indicator to identify critical support and resistance zones. These are areas where the price has historically reversed or paused, making them ideal for setting entry, exit, stop-loss, or take-profit levels.
2. **Trend Analysis**: By observing which side of the current price the majority of lines are on (more red or more green), traders can gauge whether the market is facing more resistance or support, helping them align with the current trend.
3. **Timeframe Flexibility**: You can choose to detect support and resistance levels from higher timeframes (e.g., Daily or Weekly) while trading on lower timeframes (e.g., 15-minute or 1-hour charts). This gives you a macro-level view of key price levels while executing trades on the micro-level.
---
Recommendations:
- **Swing Traders**: Use this indicator with a larger lookback period and higher pivot strength to capture major long-term support and resistance levels.
- **Scalpers and Intraday Traders**: Use shorter lookback periods and lower pivot strengths to detect key levels within a shorter timeframe.
By customizing the inputs and tailoring them to your trading style, this indicator can provide valuable insights into price levels where significant buying or selling activity is likely to occur, helping you make more informed trading decisions.
Revenue GridDescription:
The Revenue Grid indicator helps traders and investors visualize a stock’s valuation by plotting horizontal lines based on its price-to-sales (P/S) ratio. This tool displays how the stock price compares to multiples of its total revenue per share, giving a clear perspective on valuation benchmarks.
Fundamental Concept:
The price-to-sales ratio compares a company’s stock price to its revenue per share. It’s used to evaluate whether a stock is overvalued or undervalued based on its revenue.
This indicator offers a unique way to view this ratio by applying Fibonacci multiples to the revenue per share. It plots lines at these multiples to show how the stock price measures up against different valuation levels.
How It Works:
Data Inputs:
Total Revenue (TR): The company’s revenue over the past twelve months.
Total Shares Outstanding (TSO): The total number of shares in circulation.
Calculation:
Calculates the revenue per share (TR/TSO).
Plots lines at fixed Fibonacci multiples (e.g., 1x, 2x, 3x, 5x, 8x, 13x) of the revenue per share value.
How to Use:
1. Add the "Revenue Grid" indicator to your chart by searching for it in the indicator library and applying it.
2. Observe the lines plotted on the chart. If these lines are trending upwards, it indicates that the revenue is increasing.
3. Analyze how historical prices trend relative to these lines. Look for periods where the stock price supports around specific multiples, you can easily get a sense of overvaluation or undervaluation in certain periods.
Use this information to guide further analysis and investment decisions.
Benefits:
1. Clear Valuation View: Easily see how the company’s revenue translates into stock price levels.
2. Investment Insight: Identify if the stock price is lagging behind revenue growth, which might signal a buying opportunity.
3. Historical Context: Understand how the market has historically valued the company and assess the current valuation.
Do let me know your feedbacks in comments. Happy Investing :)

Grid Bot Parabolic [xxattaxx]🟩 The Grid Bot Parabolic, a continuation of the Grid Bot Simulator Series , enhances traditional gridbot theory by employing a dynamic parabolic curve to visualize potential support and resistance levels. This adaptability is particularly useful in volatile or trending markets, enabling traders to explore grid-based strategies and gain deeper market insights. The grids are divided into customizable trade zones that trigger signals as prices move into new zones, empowering traders to gain deeper insights into market dynamics and potential turning points.
While traditional grid bots excel in ranging markets, the Grid Bot Parabolic’s introduction of acceleration and curvature adds new dimensions, enabling its use in trending markets as well. It can function as a traditional grid bot with horizontal lines, a tilted grid bot with linear slopes, or a fully parabolic grid with curves. This dynamic nature allows the indicator to adapt to various market conditions, providing traders with a versatile tool for visualizing dynamic support and resistance levels.
🔑 KEY FEATURES 🔑
Adaptable Grid Structures (Horizontal, Linear, Curved)
Buy and Sell Signals with Multiple Trigger/Confirmation Conditions
Secondary Buy and Secondary Sell Signals
Projected Grid Lines
Customizable Grid Spacing and Zones
Acceleration and Curvature Control
Sensitivity Adjustments
📐 GRID STRUCTURES 📐
Beyond its core parabolic functionality, the Parabolic Grid Bot offers a range of grid configurations to suit different market conditions and trading preferences. By adjusting the "Acceleration" and "Curvature" parameters, you can transform the grid's structure:
Parabolic Grids
Setting both acceleration and curvature to non-zero values results in a parabolic grid.This configuration can be particularly useful for visualizing potential turning points and trend reversals. Example: Accel = 10, Curve = -10)
Linear Grids
With a non-zero acceleration and zero curvature, the grid tilts to represent a linear trend, aiding in identifying potential support and resistance levels during trending phases. Example: Accel =1.75, Curve = 0
Horizontal Grids
When both acceleration and curvature are set to zero, the indicator reverts to a traditional grid bot with horizontal lines, suitable for ranging markets. Example: Accel=0, Curve=0
⚙️ INITIAL SETUP ⚙️
1.Adding the Indicator to Your Chart
Locate a Starting Point: To begin, visually identify a price point on your chart where you want the grid to start.This point will anchor your grid.
2. Setting Up the Grid
Add the Grid Bot Parabolic Indicator to your chart. A “Start Time/Price” dialog will appear
CLICK on the chart at your chosen start point. This will anchor the start point and open a "Confirm Inputs" dialog box.
3. Configure Settings. In the dialog box, you can set the following:
Acceleration: Adjust how quickly the grid reacts to price changes.
Curve: Define the shape of the parabola.
Intervals: Determine the distance between grid levels.
If you choose to keep the default settings, with acceleration set to 0 and curve set to 0, the grid will display as traditional horizontal lines. The grid will align with your selected price point, and you can adjust the settings at any time through the indicator’s settings panel.
⚙️ CONFIGURATION AND SETTINGS ⚙️
Grid Settings
Accel (Acceleration): Controls how quickly the price reacts to changes over time.
Curve (Curvature): Defines the overall shape of the parabola.
Intervals (Grid Spacing): Determines the vertical spacing between the grid lines.
Sensitivity: Fine tunes the magnitude of Acceleration and Curve.
Buy Zones & Sell Zones: Define the number of grid levels used for potential buy and sell signals.
* Each zone is represented on the chart with different colors:
* Green: Buy Zones
* Red: Sell Zones
* Yellow: Overlap (Buy and Sell Zones intersect)
* Gray: Neutral areas
Trigger: Chooses which part of the candlestick is used to trigger a signal.
* `Wick`: Uses the high or low of the candlestick
* `Close`: Uses the closing price of the candlestick
* `Midpoint`: Uses the middle point between the high and low of the candlestick
* `SWMA`: Uses the Symmetrical Weighted Moving Average
Confirm: Specifies how a signal is confirmed.
* `Reverse`: The signal is confirmed if the price moves in the opposite direction of the initial trigger
* `Touch`: The signal is confirmed when the price touches the specified level or zone
Sentiment: Determines the market sentiment, which can influence signal generation.
* `Slope`: Sentiment is based on the direction of the curve, reflecting the current trend
* `Long`: Sentiment is bullish, favoring buy signals
* `Short`: Sentiment is bearish, favoring sell signals
* `Neutral`: Sentiment is neutral. No secondary signals will be generated
Show Signals: Toggles the display of buy and sell signals on the chart
Chart Settings
Grid Colors: These colors define the visual appearance of the grid lines
Projected: These colors define the visual appearance of the projected lines
Parabola/SWMA: Adjust colors as needed. These are disabled by default.
Time/Price
Start Time & Start Price: These set the starting point for the parabolic curve.
* These fields are automatically populated when you add the indicator to the chart and click on an initial location
* These can be adjusted manually in the settings panel, but he easiest way to change these is by directly interacting with the start point on the chart
Please note: Time and Price must be adjusted for each chart when switching assets. For example, a Start Price on BTCUSD of $60,000 will not work on an ETHUSD chart.
🤖 ALGORITHM AND CALCULATION 🤖
The Parabolic Function
At the core of the Parabolic Grid Bot lies the parabolic function, which calculates a dynamic curve that adapts to price action over time. This curve serves as the foundation for visualizing potential support and resistance levels.
The shape and behavior of the parabola are influenced by three key user-defined parameters:
Acceleration: This parameter controls the rate of change of the curve's slope, influencing its tilt or steepness. A higher acceleration value results in a more pronounced tilt, while a lower value leads to a gentler slope. This applies to both curved and linear grid configurations.
Curvature: This parameter introduces and controls the curvature or bend of the grid. A higher curvature value results in a more pronounced parabolic shape, while a lower value leads to a flatter curve or even a straight line (when set to zero).
Sensitivity: This setting fine-tunes the overall responsiveness of the grid, influencing how strongly the Acceleration and Curvature parameters affect its shape. Increasing sensitivity amplifies the impact of these parameters, making the grid more adaptable to price changes but potentially leading to more frequent adjustments. Decreasing sensitivity reduces their impact, resulting in a more stable grid structure with fewer adjustments. It may be necessary to adjust Sensitivity when switching between different assets or timeframes to ensure optimal scaling and responsiveness.
The parabolic function combines these parameters to generate a curve that visually represents the potential path of price movement. By understanding how these inputs influence the parabola's shape and behavior, traders can gain valuable insights into potential support and resistance areas, aiding in their decision-making process.
Sentiment
The Parabolic Grid Bot incorporates sentiment to enhance signal generation. The "Sentiment" input allows you to either:
Manually specify the market sentiment: Choose between 'Long' (bullish), 'Short' (bearish), or 'Neutral'.
Let the script determine sentiment based on the slope of the parabolic curve: If 'Slope' is selected, the sentiment will be considered 'Long' when the curve is sloping upwards, 'Short' when it's sloping downwards, and 'Neutral' when it's flat.
Buy and Sell Signals
The Parabolic Grid Bot generates buy and sell signals based on the interaction between the price and the grid levels.
Trigger: The "Trigger" input determines which part of the candlestick is used to trigger a signal (wick, close, midpoint, or SWMA).
Confirmation: The "Confirm" input specifies how a signal is confirmed ('Reverse' or 'Touch').
Zones: The number of "Buy Zones" and "Sell Zones" determines the areas on the grid where buy and sell signals can be generated.
When the trigger condition is met within a buy zone and the confirmation criteria are satisfied, a buy signal is generated. Similarly, a sell signal is generated when the trigger and confirmation occur within a sell zone.
Secondary Signals
Secondary signals are generated when a regular buy or sell signal contradicts the prevailing sentiment. For example:
A buy signal in a bearish market (Sentiment = 'Short') would be considered a "secondary buy" signal.
A sell signal in a bullish market (Sentiment = 'Long') would be considered a "secondary sell" signal.
These secondary signals are visually represented on the chart using hollow triangles, differentiating them from regular signals (filled triangles).
While they can be interpreted as potential contrarian trade opportunities, secondary signals can also serve other purposes within a grid trading strategy:
Exit Signals: A secondary signal can suggest a potential shift in market sentiment or a weakening trend. This could be a cue to consider exiting an existing position, even if it's currently profitable, to lock in gains before a potential reversal
Risk Management: In a strong trend, secondary signals might offer opportunities for cautious counter-trend trades with controlled risk. These trades could utilize smaller position sizes or tighter stop-losses to manage potential downside if the main trend continues
Dollar-Cost Averaging (DCA): During a prolonged trend, the parabolic curve might generate multiple secondary signals in the opposite direction. These signals could be used to implement a DCA strategy, gradually accumulating a position at potentially favorable prices as the market retraces or consolidates within the larger trend
Secondary signals should be interpreted with caution and considered in conjunction with other technical indicators and market context. They provide additional insights into potential market reversals or consolidation phases within a broader trend, aiding in adapting your grid trading strategy to the evolving market dynamics.
Examples
Trigger=Wick, Confirm=Touch. Signals are generated when the wick touches the next gridline.
Trigger=Close, Confirm=Touch. Signals require the close to touch the next gridline.
Trigger=SWMA, Confirm=Reverse. Signals are triggered when the Symmetrically Weighted Moving Average reverse crosses the next gridline.
🧠THEORY AND RATIONALE 🧠
The innovative approach of the Parabolic Grid Bot can be better understood by first examining the limitations of traditional grid trading strategies and exploring how this indicator addresses them by incorporating principles of market cycles and dynamic price behavior
Traditional Grid Bots: One-Dimensional and Static
Traditional grid bots operate on a simple premise: they divide the price chart into a series of equally spaced horizontal lines, creating a grid of trading zones. These bots excel in ranging markets where prices oscillate within a defined range. Buy and sell orders are placed at these grid levels, aiming to profit from mean reversion as prices bounce between the support and resistance zones.
However, traditional grid bots face challenges in trending markets. As the market moves in one direction, the bot continues to place orders in that direction, leading to a stacking of positions. If the market eventually reverses, these stacked trades can be profitable, amplifying gains. But the risk lies in the potential for the market to continue trending, leaving the trader with a series of losing trades on the wrong side of the market
The Parabolic Grid Bot: Adding Dimensions
The Parabolic Grid Bot addresses the limitations of traditional grid bots by introducing two additional dimensions:
Acceleration (Second Dimension): This parameter introduces a second dimension to the grid, allowing it to tilt upwards or downwards to align with the prevailing market trend. A positive acceleration creates an upward-sloping grid, suitable for uptrends, while a negative acceleration results in a downward-sloping grid, ideal for downtrends. The magnitude of acceleration controls the steepness of the tilt, enabling you to fine-tune the grid's responsiveness to the trend's strength
Curvature (Third Dimension): This parameter adds a third dimension to the grid by introducing a parabolic curve. The curve's shape, ranging from gentle bends to sharp turns, is controlled by the curvature value. This flexibility allows the grid to closely mirror the market's evolving structure, potentially identifying turning points and trend reversals.
Mean Reversion in Trending Markets
Even in trending markets, the Parabolic Grid Bot can help identify opportunities for mean reversion strategies. While the grid may be tilted to reflect the trend, the buy and sell zones can capture short-term price oscillations or consolidations within the broader trend. This allows traders to potentially pinpoint entry and exit points based on temporary pullbacks or reversals.
Visualize and Adapt
The Parabolic Grid Bot acts as a visual aid, enhancing your understanding of market dynamics. It allows you to "see the curve" by adapting the grid to the market's patterns. If the market shows a parabolic shape, like an upward curve followed by a peak and a downward turn (similar to a head and shoulders pattern), adjust the Accel and Curve to match. This highlights potential areas of interest for further analysis.
Beyond Straight Lines: Visualizing Market Cycle
Traditional technical analysis often employs straight lines, such as trend lines and support/resistance levels, to interpret market movements. However, many analysts, including Brian Millard, contend that these lines can be misleading. They propose that what might appear as a straight line could represent just a small part of a larger curve or cycle that's not fully visible on the chart.
Markets are inherently cyclical, marked by phases of expansion, contraction, and reversal. The Parabolic Grid Bot acknowledges this cyclical behavior by offering a dynamic, curved grid that adapts to these shifts. This approach helps traders move beyond the limitations of straight lines and visualize potential support and resistance levels in a way that better reflects the market's true nature
By capturing these cyclical patterns, whether subtle or pronounced, the Parabolic Grid Bot offers a nuanced understanding of market dynamics, potentially leading to more accurate interpretations of price action and informed trading decisions.
⚠️ DISCLAIMER⚠️
This indicator utilizes a parabolic curve fitting approach to visualize potential support and resistance levels. The mathematical formulas employed have been designed with adaptability and scalability in mind, aiming to accommodate various assets and price ranges. While the resulting curves may visually resemble parabolas, it's important to note that they might not strictly adhere to the precise mathematical definition of a parabola.
The indicator's calculations have been tested and generally produce reliable results. However, no guarantees are made regarding their absolute mathematical accuracy. Traders are encouraged to use this tool as part of their broader analysis and decision-making process, combining it with other technical indicators and market context.
Please remember that trading involves inherent risks, and past performance is not indicative of future results. It is always advisable to conduct your own research and exercise prudent risk management before making any trading decisions.
🧠 BEYOND THE CODE 🧠
The Parabolic Grid Bot, like the other grid bots in this series, is designed with education and community collaboration in mind. Its open-source nature encourages exploration, experimentation, and the development of new grid trading strategies. We hope this indicator serves as a framework and a starting point for future innovations in the field of grid trading.
Your comments, suggestions, and discussions are invaluable in shaping the future of this project. We welcome your feedback and look forward to seeing how you utilize and enhance the Parabolic Grid Bot.
