Adaptive MFT Extremum Pivots [Elysian_Mind]Adaptive MFT Extremum Pivots
Overview:
The Adaptive MFT Extremum Pivots indicator, developed by Elysian_Mind, is a powerful Pine Script tool that dynamically displays key market levels, including Monthly Highs/Lows, Weekly Extremums, Pivot Points, and dynamic Resistances/Supports. The term "dynamic" emphasizes the adaptive nature of the calculated levels, ensuring they reflect real-time market conditions. I thank Zandalin for the excellent table design.
---
Chart Explanation:
The table, a visual output of the script, is conveniently positioned in the bottom right corner of the screen, showcasing the indicator's dynamic results. The configuration block, elucidated in the documentation, empowers users to customize the display position. The default placement is at the bottom right, exemplified in the accompanying chart.
The deliberate design ensures that the table does not obscure the candlesticks, with traders commonly situating it outside the candle area. However, the flexibility exists to overlay the table onto the candles. Thanks to transparent cells, the underlying chart remains visible even with the table displayed atop.
In the initial column of the table, users will find labels for the monthly high and low, accompanied by their respective numerical values. The default precision for these values is set at #.###, yet this can be adjusted within the configuration block to suit markets with varying degrees of volatility.
Mirroring this layout, the last column of the table presents the weekly high and low data. This arrangement is part of the upper half of the table. Transitioning to the lower half, users encounter the resistance levels in the first column and the support levels in the last column.
At the center of the table, prominently displayed, is the monthly pivot point. For a comprehensive understanding of the calculations governing these values, users can refer to the documentation. Importantly, users retain the freedom to modify these mathematical calculations, with the table seamlessly updating to reflect any adjustments made.
Noteworthy is the table's persistence; it continues to display reliably even if users choose to customize the mathematical calculations, providing a consistent and adaptable tool for informed decision-making in trading.
This detailed breakdown offers traders a clear guide to interpreting the information presented by the table, ensuring optimal use and understanding of the Adaptive MFT Extremum Pivots indicator.
---
Usage:
Table Layout:
The table is a crucial component of this indicator, providing a structured representation of various market levels. Color-coded cells enhance readability, with blue indicating key levels and a semi-transparent background to maintain chart visibility.
1. Utilizing a Table for Enhanced Visibility:
In presenting this wealth of information, the indicator employs a table format beneath the chart. The use of a table is deliberate and offers several advantages:
2. Structured Organization:
The table organizes the diverse data into a structured format, enhancing clarity and making it easier for traders to locate specific information.
3. Concise Presentation:
A table allows for the concise presentation of multiple data points without cluttering the main chart. Traders can quickly reference key levels without distraction.
4. Dynamic Visibility:
As the market dynamically evolves, the table seamlessly updates in real-time, ensuring that the most relevant information is readily visible without obstructing the candlestick chart.
5. Color Coding for Readability:
Color-coded cells in the table not only add visual appeal but also serve a functional purpose by improving readability. Key levels are easily distinguishable, contributing to efficient analysis.
Data Values:
Numerical values for each level are displayed in their respective cells, with precision defined by the iPrecision configuration parameter.
Configuration:
// User configuration: You can modify this part without code understanding
// Table location configuration
// Position: Table
const string iPosition = position.bottom_right
// Width: Table borders
const int iBorderWidth = 1
// Color configuration
// Color: Borders
const color iBorderColor = color.new(color.white, 75)
// Color: Table background
const color iTableColor = color.new(#2B2A29, 25)
// Color: Title cell background
const color iTitleCellColor = color.new(#171F54, 0)
// Color: Characters
const color iCharColor = color.white
// Color: Data cell background
const color iDataCellColor = color.new(#25456E, 0)
// Precision: Numerical data
const int iPrecision = 3
// End of configuration
The code includes a configuration block where users can customize the following parameters:
Precision of Numerical Table Data (iPrecision):
// Precision: Numerical data
const int iPrecision = 3
This parameter (iPrecision) sets the precision of the numerical values displayed in the table. The default value is 3, displaying numbers in #.### format.
Position of the Table (iPosition):
// Position: Table
const string iPosition = position.bottom_right
This parameter (iPosition) sets the position of the table on the chart. The default is position.bottom_right.
Color preferences
Table borders (iBorderColor):
// Color: Borders
const color iBorderColor = color.new(color.white, 75)
This parameters (iBorderColor) sets the color of the borders everywhere within the window.
Table Background (iTableColor):
// Color: Table background
const color iTableColor = color.new(#2B2A29, 25)
This is the background color of the table. If you've got cells without custom background color, this color will be their background.
Title Cell Background (iTitleCellColor):
// Color: Title cell background
const color iTitleCellColor = color.new(#171F54, 0)
This is the background color the title cells. You can set the background of data cells and text color elsewhere.
Text (iCharColor):
// Color: Characters
const color iCharColor = color.white
This is the color of the text - titles and data - within the table window. If you change any of the background colors, you might want to change this parameter to ensure visibility.
Data Cell Background: (iDataCellColor):
// Color: Data cell background
const color iDataCellColor = color.new(#25456E, 0)
The data cells have a background color to differ from title cells. You can configure this is a different parameter (iDataColor). You might even set the same color for data as for the titles if you will.
---
Mathematical Background:
Monthly and Weekly Extremums:
The indicator calculates the High (H) and Low (L) of the previous month and week, ensuring accurate representation of these key levels.
Standard Monthly Pivot Point:
The standard pivot point is determined based on the previous month's data using the formula:
PivotPoint = (PrevMonthHigh + PrevMonthLow + Close ) / 3
Monthly Pivot Points (R1, R2, R3, S1, S2, S3):
Additional pivot points are calculated for Resistances (R) and Supports (S) using the monthly data:
R1 = 2 * PivotPoint - PrevMonthLow
S1 = 2 * PivotPoint - PrevMonthHigh
R2 = PivotPoint + (PrevMonthHigh - PrevMonthLow)
S2 = PivotPoint - (PrevMonthHigh - PrevMonthLow)
R3 = PrevMonthHigh + 2 * (PivotPoint - PrevMonthLow)
S3 = PrevMonthLow - 2 * (PrevMonthHigh - PivotPoint)
---
Code Explanation and Interpretation:
The table displayed beneath the chart provides the following information:
Monthly Extremums:
(H) High of the previous month
(L) Low of the previous month
// Function to get the high and low of the previous month
getPrevMonthHighLow() =>
var float prevMonthHigh = na
var float prevMonthLow = na
monthChanged = month(time) != month(time )
if (monthChanged)
prevMonthHigh := high
prevMonthLow := low
Weekly Extremums:
(H) High of the previous week
(L) Low of the previous week
// Function to get the high and low of the previous week
getPrevWeekHighLow() =>
var float prevWeekHigh = na
var float prevWeekLow = na
weekChanged = weekofyear(time) != weekofyear(time )
if (weekChanged)
prevWeekHigh := high
prevWeekLow := low
Monthly Pivots:
Pivot: Standard pivot point based on the previous month's data
// Function to calculate the standard pivot point based on the previous month's data
getStandardPivotPoint() =>
= getPrevMonthHighLow()
pivotPoint = (prevMonthHigh + prevMonthLow + close ) / 3
Resistances:
R3, R2, R1: Monthly resistance levels
// Function to calculate additional pivot points based on the monthly data
getMonthlyPivotPoints() =>
= getPrevMonthHighLow()
pivotPoint = (prevMonthHigh + prevMonthLow + close ) / 3
r1 = (2 * pivotPoint) - prevMonthLow
s1 = (2 * pivotPoint) - prevMonthHigh
r2 = pivotPoint + (prevMonthHigh - prevMonthLow)
s2 = pivotPoint - (prevMonthHigh - prevMonthLow)
r3 = prevMonthHigh + 2 * (pivotPoint - prevMonthLow)
s3 = prevMonthLow - 2 * (prevMonthHigh - pivotPoint)
Initializing and Populating the Table:
The myTable variable initializes the table with a blue background, and subsequent table.cell functions populate the table with headers and data.
// Initialize the table with adjusted bgcolor
var myTable = table.new(position = iPosition, columns = 5, rows = 10, bgcolor = color.new(color.blue, 90), border_width = 1, border_color = color.new(color.blue, 70))
Dynamic Data Population:
Data is dynamically populated in the table using the calculated values for Monthly Extremums, Weekly Extremums, Monthly Pivot Points, Resistances, and Supports.
// Add rows dynamically with data
= getPrevMonthHighLow()
= getPrevWeekHighLow()
= getMonthlyPivotPoints()
---
Conclusion:
The Adaptive MFT Extremum Pivots indicator offers traders a detailed and clear representation of critical market levels, empowering them to make informed decisions. However, users should carefully analyze the market and consider their individual risk tolerance before making any trading decisions. The indicator's disclaimer emphasizes that it is not investment advice, and the author and script provider are not responsible for any financial losses incurred.
---
Disclaimer:
This indicator is not investment advice. Trading decisions should be made based on a careful analysis of the market and individual risk tolerance. The author and script provider are not responsible for any financial losses incurred.
Kind regards,
Ely
Supports

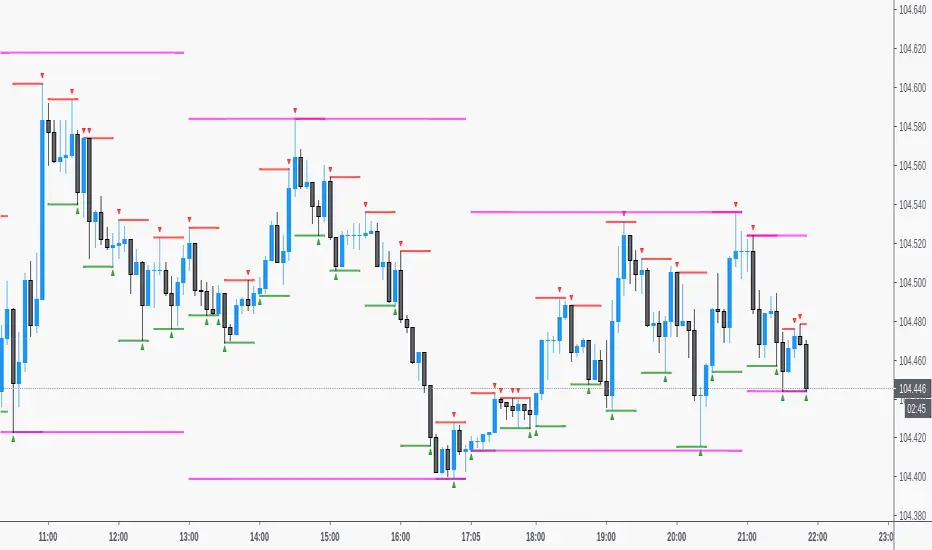
Support and Resistancewhat is "Support and Resistance"?
it is a support and resistance indicator.
what it does?
it draw support and resistance zones on the chart.
how it does it?
It determines the zones where the price leaves with a big candle after going horizontal for a while as support or resistance zones according to the price movement direction. while doing this, it compares the size of the candles and the elapsed time.
how to use it?
Red zones represent resistance and green zones represent support. You can buy in the support zone or sell in the resistance zone. my advice is to make your own interpretation by taking into account the price movement with different indicators. they are considered useful if there is a closure beyond the zones. otherwise, they continue to be shifted to the right.
notice: As new zones are created, old ones may disappear. so it might be wise to draw boxes using drawing tools where the old zones are.
Support and resistance are very important concepts for technical analysis. so I am thinking of updating and improving this indicator many times in the long run. but I couldn't wait long to post it.
examples:

Multi Oscillators Price LevelsThis script draws price levels corresponding to the highest price reached in overbought situations, and the lowest price reached in oversold situations, depending on the oscillator and the timeframe the user has configured.
These levels correspond, most of time, to good supports and resistances prices.
Price levels drawings can be based on the following indicators:
Stochastic RSI (default)
Stochastic CCI
RSI
CCI
You can customize this indicator with the following options:
Source: The candle source to use in indicators calculation
Source Indicator: The indicator on which you cant to base your levels
Timeframe: The timeframe on which you want to apply the selected indicator, and calculate levels
Show supports/resistances: enable/disable price levels, depending on there status (overbought - resistances) / (oversold - supports)
Lines width: width of price levels. (set to 10 by default in order to draw "zones")
Supports/Resistances source: Select the candle data you cant to use to draw supports and resistances levels
Extend levels: Select the line extension for price levels
Levels color: Select the desired color for price levels
And of course , all parameters corresponding to the supported indicators (Stoch, RSI, CCI)
Here are a few examples of different configurations:
This script will probably be modified in the future, don't hesitate to suggest any improvement.

High Volume Price Levels x3This script detects recent huge volume areas to help you finding out good support and resistance levels.
For each of the 3 periods (defaults : 100, 200, 500) a new line will be drawn from the last time the volume amount exceeded n% (default 99%) of the highest volume on the same period, to the next occurence.
Most of time, these lines represent strong support and resistance levels which can be helpful in your technical analysis.
Options:
Volume trigger level: represents the minimum % of the highest volume within the given period on which you want to draw a new price level. (But higher this % is, stronger the levels will be)
Periods: The reference periods for high volume detection.
Show period: Enable/Disable the use of any period.
Period Color: Select a color correspondig to each period.
Show current levels only: Disable drawing of previous levels, to display current levels only.
Extend last level: Extend current lines to right/left/both or none sides of your chart.
Notes:
Sometimes, the last detected level from every periods can be the same at the same moment. In this situation, you'll only see one or two of the lines instead of three.
I'd like to figure out how to continuously draw every interesting levels without making the chart unreadable. Of course this script will be updated if I find a good way to do it.
Feel free to suggest any improvements/modifications.
Example:
Toltecas Tendencies, Supports and Resistances V2Trend Lines, Supports and Resistances.
Triangles indicators for confirmations buy/sell.
Use for binaries (1M-3M-5M)
- LRG_Channel_TF_mins_D_W_M = 30
- Range = 1
- SML_Channel_TF_mins_D_W_M = 240
Use for forex/cryptocurrencies/indices (15M-1H-4H)
- LRG_Channel_TF_mins_D_W_M = D
- Range = 1
- SML_Channel_TF_mins_D_W_M = W