BBWW 2.0 Revised EN# Expert Review: BBWW 2.0 (Bollinger Bands Wing Waves)
**Verdict:** This is not just an indicator, but a full-fledged **system for visualizing market regimes**. Unlike standard Bollinger Bands, which only show volatility and deviation, BBWW 2.0 decodes **crowd psychology**, separating price movements into momentum phases (Fear/Greed) and decay phases (Correction).
This is a tool for **trend** and **swing** traders operating on volatility breakouts.
---
## How It Works: Under the Hood
At its core lies the classic mathematics of standard deviation, enhanced by advanced digital filters (Gaussian, Butterworth, SWMA).
The main "feature" of the indicator is the **Wing Waves** algorithm, which analyzes three vectors simultaneously:
1. Direction of the Basis (central line).
2. Dynamics of the Upper Band (expansion/contraction).
3. Dynamics of the Lower Band (expansion/contraction).
The combination of these vectors creates 4 market states:
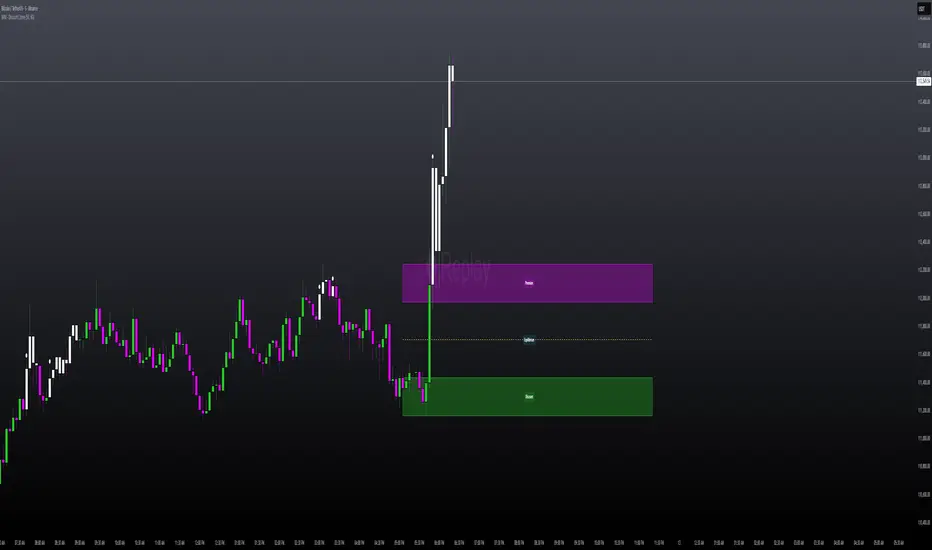
### 1. Greed Impulse (Color: Olive)
* **Logic:** Basis rising + Channel expanding upwards.
* **Meaning:** Aggressive buying. Volatility is increasing in the direction of the trend. This is the most profitable phase for holding long positions. Shorting here is suicide.
### 2. Greed Correction (Color: Maroon)
* **Logic:** Basis is still rising, but the lower band has started to pull up (volatility contraction).
* **Meaning:** Buyers are exhausting, taking profits. Momentum has faded, the market is drifting or preparing for a reversal.
### 3. Fear Impulse (Color: Fuchsia)
* **Logic:** Basis falling + Channel expanding downwards.
* **Meaning:** Panic selling. Strong downward impulsive movement. The best time to hold shorts or stay out of the market (for spot).
### 4. Fear Correction (Color: Teal)
* **Logic:** Basis falling, but the upper band has started to decline (contraction).
* **Meaning:** "Dead cat bounce" or bottom stabilization. Sellers are closing positions, volatility is dropping. Dangerous to open new shorts.
---
## Trading Strategies and Recommendations
As a professional trader, I recommend using BBWW 2.0 as follows:
### Strategy 1: "Surfing the Waves" (Trend Following)
Works perfectly on 1H, 4H, and 1D timeframes.
* **ENTRY:** Enter a trade when a "Correction" phase changes to an "Impulse" phase.
* *Long:* Change from Maroon (Correction) → to Olive (Greed). This is a signal that consolidation is over and the trend has resumed.
* *Short:* Change from Teal (Correction) → to Fuchsia (Fear).
* **EXIT:** As soon as the color changes to a correction phase, tighten your stop-loss or take partial profits.
### Strategy 2: "The Squeeze"
BBWW excels at showing moments when the spring is coiling.
* If you see a prolonged period of "Correction" (bands narrowing), and price is squeezed between the Basis and one of the bands — get ready for a breakout.
* Use **Basis Line touches** during a trend as an entry point to add to a position. In a strong trend, price often tests the middle (Basis) and bounces off it.
### Strategy 3: Noise Filtering
* Enable **Gaussian** or **Butterworth** filter in settings instead of the standard SMA. This removes market noise and provides a smoother Basis Line, reducing false signals in sideways markets (flat).
---
## Nuances and Risks
1. **Sideways Market (Flat):** Like any trend tool, BBWW will give false signals in a narrow range. Colors will change frequently, and bands will be horizontal.
* *Solution:* Do not trade if the Basis Line is flat (horizontal). Wait for a slope.
2. **Lag:** Any MA (Moving Average) has lag. The signal for a phase change (e.g., start of Fear) comes when the move has already started. Do not try to catch the absolute tops and bottoms. Capture the "body" of the move.
3. **Period Settings:**
* For scalping (5m-15m): Reduce period to 14-16.
* For medium-term (4H-1D): Leave at 20 or increase to 50 to filter for the global trend.
### Summary
BBWW 2.0 is a powerful visual assistant. It removes the emotional component of trading by answering the main questions: *"Is it greed or fear right now?"* and *"Is volatility rising or falling?"*.
**Best Application:** Cryptocurrencies and volatile stocks, where pump and dump phases (volatility expansions) are most pronounced.
Swing

Timed Swing Points [Free +] | cephxsTimed Swing Points | cephxs
This indicator is published under the Mozilla Public License 2.0. © cephxs, © fstarcapital
1. OVERVIEW
Timed Swing Points (TSP) highlights the timing of recent confirmed swing highs and lows and annotates them with context-aware time labels. Instead of drawing traditional pivot shapes and cluttering the chart, this streamlined free edition focuses on the temporal structure: WHEN pivots occur, not just WHERE . It helps discretionary traders quickly scan for clustering of swings around repeating intraday minutes or higher‑timeframe day names.
2. WHAT IT DOES
Detects swing highs and lows using a sensitivity factor (len)
Adds a time (or day name on daily timeframe) label at each qualified swing
Optional filtering to only show labels during defined "key time" minute windows
Automatically adapts label content to timeframe:
Intraday: HH:MM (24h or 12h model depending future input extension)
Daily: Full or abbreviated weekday names
Respects a maximum number of displayed swing points to keep charts clean
3. CORE FEATURES
Swing Detection: Uses ta.pivothigh(len, len) / ta.pivotlow(len, len); a pivot is confirmed only after enough bars pass, avoiding repaint on the current bar.
Time Labeling: Places labels offset back to the pivot bar index (bar_index - len).
Key Time Filtering: When enabled, labels only show if the pivot's minute is inside one of three windows: 00–10, 24–36, 50–59 minutes. These windows target common liquidity / volatility phases.
Day Name Mode: On daily timeframe, labels display full (e.g., Monday) or abbreviated (e.g., Mon) day names depending on the Full Day Names setting.
Point Limiting: Oldest labels are removed once Maximum Points Displayed is exceeded.
Clean Visual Footprint: Shape markers and lines are disabled in this free build (internally set to constants). Focus remains on time annotation density rather than price level persistence.
4. INPUTS & PARAMETERS
Sensitivity (len): Default 2. Swing pivot width. Higher = fewer, broader swings
Maximum Points Displayed: Default 10. Caps number of recent swing labels retained
Show Time Labels: Default true. Master toggle for all time labels
Key Times Only: Default true. Restricts labels to predefined minute windows
Prefix: Default blank. Optional text prepended to each label
High Time Color: Default red. Text color for swing high labels
Low Time Color: Default blue. Text color for swing low labels
Text Size: Default Small. Controls label text size (Tiny → Huge)
Full Day Names: Default true. Show full weekday names on daily timeframe
Internal Constants (Not User-Adjustable):
Shape display flags (show_high, show_low) set false
Line display and deletion logic present but disabled
Timezone currently fixed to America/New_York in Automatic mode; DST handled by TradingView engine
5. HOW SWING TIME IS DETERMINED
For each bar the script evaluates pivot conditions
A pivot is confirmed only after the right width (len) bars complete—the label is then placed len bars back
Time extraction uses the pivot's bar timestamp and converts:
Intraday: Formats HH:MM (24-hour). Infrastructure exists for future 12h toggle
Daily: Converts timestamp to a weekday name
Key time filter checks the pivot's minute bucket. If outside defined windows and filter is active, the label is skipped
6. TIME WINDOWS LOGIC (KEY TIMES ONLY)
Minutes 00–10 → Opening sequence & initial liquidity sweep
Minutes 24–36 → Post initial rotation / mid-hour inflection zone
Minutes 50–59 → Pre hour close / micro-structure reshuffle
ICT Traders: View as macros and note when macros form swing points
This pattern helps isolate intraday zones where structural shifts frequently occur, reducing noise from less consequential pivot timings.
7. USAGE GUIDELINES
Start with Sensitivity = 2 or 3 for most liquid intraday symbols. Increase on higher timeframes to avoid excessive clustering
Key Times Only ON: Ideal for focusing on session rotation pivots. OFF: Use for full discovery when studying custom time behaviors
Combine with volume profile or divergence tools to qualify time-labeled swings (e.g., a swing forming at 09:30 NY vs. random mid-bar)
Apply on lower timeframes (1–15m) to map recurring patterns or on Daily to see weekly rhythm changes
8. PERFORMANCE & LIMITATIONS
Efficient: Only stores arrays of recent labels and prunes aggressively
No Alerts: Current version does not fire alerts (Future Pro+ variant may include swing-time alerting)
Timezone: Fixed to America/New_York
9. BEST PRACTICES
Use a neutral chart theme; contrasting label colors amplify swing clusters
When analyzing historical pattern reliability, temporarily raise Maximum Points Displayed to 50–100 then revert to lighter values for live trading
Prefix field: Add a tag like "T:" if mixing multiple custom time tools to differentiate label origin
10. FAQ
Q: Why do some expected swings not show?
If they confirm outside key minute windows and filtering is ON, they're intentionally suppressed.
Q: Can I get price levels drawn?
Not in this free build. Lines/shapes are disabled intentionally.
Q: Does it repaint?
Pivot confirmation waits for the right width; labels appear only after the swing is locked in. Past labels aren't retroactively moved.
Q: Can I monitor multiple symbols at once?
This version is single‑symbol; use layouts or Pro variants for multi-source overlays.
11. CHANGELOG
v1.0 (Initial Free Release): Core swing time labeling, key time filter, day name adaptation, performance improvements. More updates coming.
12. DISCLAIMER
This tool is an analytical overlay designed for timing context only. It is NOT a standalone buy/sell signal. Always validate swings with broader market structure, liquidity pools, and risk management. No guarantee of future performance.
If you find this useful and want advanced variants (alerts, multi‑timezone, clustering metrics), reach out via TradingView. Feedback drives improvements.

Liquidity Sweeps + Swing High/Low — SMC/ICT (@PueblaATH)Liquidity Sweeps + Swing High/Low — SMC/ICT (@PueblaATH) is a liquidity-driven Smart Money Concepts tool that automatically maps out key swing highs and lows, tracks how they evolve into liquidity pools, and highlights when those levels are swept and either respected or invalidated. This indicator is built to give traders a clean, event-driven view of stop runs and liquidity grabs across any timeframe, from scalping to higher-timeframe context.
What the Indicator Does
Swing Structure & Liquidity Pools
Detects swing highs and lows using a configurable swing length, projects levels forward in time, and builds a liquidity-pool database through pivot arrays used for sweep detection.
Liquidity Sweeps (Stop Runs)
Identifies bearish (upward) and bullish (downward) sweeps through prior liquidity levels using three modes: Any Touch, Wick + Close Back, and Retest Rejection.
Each sweep can generate projective lines, labeled markers, and alerts.
Scope, Rate Limiting & Clean Visuals
Controls minimum spacing between swings and sweeps, limits sweep duplication, auto-revokes invalidated sweeps, and restricts the maximum number of visible events.
Smart offset logic reduces label overlap and keeps charts clean even in dense price action.
Timeframe Filters & Utilities
Allows hiding all drawings between specific timeframes and optionally skipping calculations or clearing internal state when hidden.
Includes debug pivot markers and an optional TF/Bucket badge.
Timeframe Auto-Mode (Original Adaptive Engine)
This indicator features a fully original, seven-bucket Auto-Mode engine that adapts sensitivity to the active timeframe.
Bucket Classification (by seconds)
≤1m, >1m–15m, >15m–30m, >30m–1h, >1h–4h, >4h–1d, >1d.
Bucket-Specific Settings
Each bucket has unique sensitivity sets:
Swing/Sweep lengths
Projection distances
Line style and width
Rate-limiting gaps
Pivot count and bar-lookback windows
Overlap windows
Adaptive Behavior
Lower timeframes gain more reactive behavior, while higher timeframes apply smoother and more selective filters.
Manual Override
Auto-Mode can be disabled to use the Core manual settings for full customization.
How to Use It
Attach the indicator and choose whether to keep Auto-Mode ON or OFF.
Select the sweep mode (e.g., Wick + Close Back for ICT-style liquidity grabs).
Adjust label text, size, color, and offsets to your preference.
Use timeframe filters to show drawings only where you want them.
Enable alerts for bullish sweeps, bearish sweeps, or revocations.
Combine sweep events with your own confluence (sessions, bias, OBs/FVGs, etc.).
Originality & Credits Disclaimer
This script is an original work by @PueblaATH , created specifically for Liquidity Sweeps + Swing High/Low — SMC/ICT (@PueblaATH) under the MPL 2.0 license.
The concepts used (swing highs/lows, liquidity pools, sweeps, SMC/ICT behavior) are public and widely known—they do not belong to any author or protected script.
This indicator does not repackage or cosmetically modify existing code.
Its architecture—including the multi-bucket Auto-Mode engine, pivot/sweep management system, revocation logic, overlap-aware labeling, and TF-based hide/skip/clear controls—is uniquely implemented for this script.
If any future update reuses or adapts code from public sources, full credit will be given in both comments and description, with clear explanation of what was reused and what was originally added or improved.

Swing Trade AL/SAT + Güç Derecesi_huğurlu
Weak signal → MACD crossover only.
Moderate signal → MACD crossover + RSI confirmation.
Strong signal → MACD crossover + RSI + Stoch RSI confirmation.
BUY/SELL labels appear on the chart in different colors and sizes.
This way, you can instantly see which signal is more reliable.
Zayıf sinyal → sadece MACD kesişim var
Orta sinyal → MACD kesişim + RSI teyidi.
Güçlü sinyal → MACD kesişim + RSI + Stoch RSI teyidi.

cd_sfp_CxGeneral:
This indicator is designed to assist users who trade the Swing Failure Pattern ( SFP ).
In technical literature (various definitions exist), an SFP is a situation where the price violates a previous swing level but fails to close beyond that level.
• (Liquidity Sweep)
• (Buyer or seller dominance)
• (Stop hunt)
• (Turtle Soup)
The general strategy is built upon seeking trade opportunities after an SFP is formed and conviction is established that the market direction has changed.
Components used to gather confirmation:
• Determining Bias: Periodic SAR
• Obtaining Breakout/Reversal Confirmation: Change in State Delivery (CISD)
• Defining the Buyer/Seller Block (Supply/Demand Zones): Mitg Blocks (Mitigation Blocks), FVG (Fair Value Gaps), and Standard Deviation Projection
• Key Levels: Previous HTF (Higher Time Frame) levels
• Setting Targets: Standard Deviation Projection
• Trade Management: Anchored VWAP and opposing blocks
• Time-Based Context: Session Killzone times
• Notifications: An alarm/alert system will be utilized to stay informed.
________________________________________
Details:
Swing and Swing Failure Pattern:
Swing Sweep Types (Liquidity Sweep):
1. Single
2. Consecutive (The liquidity of the entity that swept the liquidity is being swept)
Bias Determination
We need to filter out the numerous SFPs that occur across all time frames. Our first strong filter will be the Bias. We will only look for trades aligned with our bias.
We will use Periodic SAR (Stop and Reverse) to determine the bias. We compare the price with the SAR value from a Higher Time Frame than the one we are trading on.
• Price > SAR => Bullish Bias
• Price < SAR => Bearish Bias
Depending on the pair, H1 SAR may be chosen for scalp trades, and Daily/Weekly SAR for intraday and swing trades.
Key Levels
Strategies looking for trades after a liquidity grab generally state that the sweep / stop hunt movement should occur at a significant price level.
The most fundamental Key Level levels are (User can customize):
• Previous Week High & Low
• Previous Day High & Low
• Previous H4 High & Low
• Previous H1 High & Low
• Asia Killzone High & Low
• London Killzone High & Low
• New York Killzone High & Low
• Monday Range High & Low values
We will prefer SFP formations that occur when these levels are swept. When Key Levels are violated, an information label appears on the screen.
Blocks / Zones
To strengthen our hand, we will use three types of blocks/zones, either with Key Levels or separately. When an SFP structure is formed in these areas (along with bias and breakout confirmation), our expectation is for the price to continue in our desired direction. These regions are:
1. Mitigation Blocks (Mtg)
o (Details can be found in the cd_VWAP_mtg_Cx indicator)
o In short: A second candle, following a bullish candle, crosses its high but fails to close above it. We call this a sweep / SFP. When the price, which was expected to go to the low, instead makes a new high/close, an Mtg block is formed. (Buyers are dominant)
2. FVGs (Fair Value Gaps)
o We use classic FVG structures.
3. Standard Deviation Projection Boxes
o When we get an SFP structure + breakout confirmation (CISD), we use the Standard Deviation Projection to determine our profit-taking and take-profit levels.
o Based on the idea that the price often respects the range between -2 and -2.5 of the projection values, we box this range and use it as our area of interest. (Our expectation is for the price to reverse after reaching this target).
o Let's mark it on the chart.
Confirmation
To summarize what has been explained so far: we look for the price to form an SFP structure in levels/zones we deem important, aligned with our bias, and for the breakout to be confirmed with a CISD.
No single component is strong on its own, but the success rate increases when they occur together.
We observe the following as additional confirmation along with the CISD: a new Mtg block forming in the direction of the breakout, high-volume movement (with FVG and a large body), and respect for VWAPs, the resistance/support line, and the defense block.
Additional Confirmations with Breakouts:
• Defence block, new mtg and VWAP
• Resistance / Support Line:
Indicator Signals
The indicator marks all formed sweeps, selected key levels, blocks, the projection, and CISD confirmations on the screen. The candle where the CISD confirmation occurs is indicated by an arrow.
• Arrows with double short lines signify a CISD that follows an SFP occurring at a Key Level.
• All other CISD candle indications are shown with single-line arrows.
Trade Management
When selecting profit targets in trades (preferably), the projection, opposing blocks, and structures that have formed are taken into account. Do not neglect to look at the structures that have formed against you when entering a trade.
Menu Settings:
• For Mtg blocks, the trading timeframe or a higher timeframe can be selected.
• FVGs formed in the current timeframe are displayed when the price creates an SFP (in "Fvg" option).
• Deviation boxes are displayed when the price creates an SFP (in box).
• The SAR HTF setting (H1) for scalp trades may vary depending on the pair. Users trying trades on higher timeframes should increase the HTF setting.
o Example: If you are looking for a trade with an SFP structure on H1, the SAR HTF setting should be H4 or higher.
• VWAP lines are refreshed starting from the candle that executed the sweep when the price forms an SFP. The only setting to adjust is the source selection setting (hlc3 is selected).
• Time frames and Killzone / Special Zone settings for Key Levels can be changed/should be checked.
Alarms / Alerts:
The conditions that will trigger an alert can be selected from the menu.
• To receive an alert aligned with the bias, the "Alignment with bias" checkbox must be selected.
• The alert should be set on the timeframe where you plan to enter the trade.
• The display options do not affect the alarm conditions. (Example: FVGs are monitored even when the menu selection is "off").
• If the necessary conditions are met, the alarm is triggered on the new candle that opens after the CISD confirmation.
• The alarm will not be triggered more than once at the same Key Level.
The user can preferably select alerts:
• Bias-aligned or Bias-independent
• Sweep (without waiting for CISD)
• Sweep + CISD (without looking for other conditions)
• Sweep + Key Level + CISD (the swept level is a Key Level)
• Sweep + Mtg / Fvg / Dev. + CISD (SFP formed in any of the blocks)
• Sweep + Mtg + CISD (SFP formed in the Mtg block)
• Sweep + Fvg + CISD (SFP formed inside the FVG)
• Sweep + Deviation Box + CISD (SFP formed inside the Dev. Box)
• Sweep + Key Level + Mtg / Fvg / Dev. + CISD (SFP formed simultaneously at a Key Level and any of the blocks)
Trade Example:
• Conditions: Bias-aligned + Sweep + Mtg/Fvg/Dev (at least one) + CISD
• Extra Confirmations: Respect for the Defense Block + Respect for VWAP
• Target (TP): Projection between -2 and -2.5
I welcome your thoughts and suggestions regarding my indicator, which I believe will be successful in the long run by adhering to uncompromising risk management and a strict trading plan.
Happy Trading!

MTF Trend Analyzer with Swing Pivots & S/R Levels [SmartFoxy]Indicator “Multi-Timeframe Trend Analyzer with Swing Pivots & S/R Levels”
📌 Overview
Trend & Pivot S/R Levels is a multi-timeframe market structure analyzer that identifies trend direction, detects swing highs/lows, and plots higher-timeframe support/resistance levels directly on your chart.
Designed for traders who want fast, clean, and accurate trend context without constantly switching timeframes.
________________________________________________________________________________
✨ Core Features
1. Multi-Timeframe Trend Analyzer .
Analyze up to five higher timeframes simultaneously — for example:
5m, 1H, 4H, 1D, 1W , etc.
For each timeframe, the indicator detects:
a) Trend direction:
🡕 Uptrend;
🡖 Downtrend.
b) Breakouts of recent pivot highs/lows to determine trend shifts.
c) Automatic graying-out of timeframes lower than the current chart TF .
d) A clean visual Trend Panel that shows:
Arrow direction;
Timeframe label (1D, 1W, etc.);
Trend color (bullish, bearish, neutral).
________________________________________________________________________________
2. Swing Pivot Detection (Current TF)
The script detects local swing points using customizable lookback parameters:
a) Pivot Type:
High/Low — classic swing structure;
Close — smoother swing detection using closing prices.
b) Left/Right Bars Lookback — the number of bars required on both sides to validate the pivot.
c) Multiple marker styles :
Built-in plot shapes (circle, cross, histogram, etc.);
Custom visual labels (▲▼, ◉, ✖, 🡇🡅, ◆, ◼, etc.).
This makes it easy to visually confirm that your swing settings are correct.
________________________________________________________________________________
3. Higher-Timeframe Support/Resistance
The indicator automatically draws HTF S/R lines based on the latest pivot highs/lows from each selected timeframe.
Each timeframe has:
Separate Support / Resistance colors ;
Adjustable line width ;
Selectable line style (solid, dashed, dotted, arrows);
Optional HTF labels displayed on the lines.
This allows you to see major market structure levels from higher timeframes without switching charts.
________________________________________________________________________________
4. Smart Timeframe Safety Checks
If a selected timeframe is lower than your current chart timeframe , its data is:
Disabled for S/R plotting ;
Shown in gray inside the Trend Panel;
Prevents invalid S/R calculations and ensures stable chart performance.
________________________________________________________________________________
⚙️ Customization Options :
Show/Hide the Trend Panel;
Panel placement anywhere on the chart;
Swing pivot type: High/Low or Close ;
Pivot lookback (left/right bars);
Choose five HTFs to analyze;
Enable/Disable HTF S/R;
Configure S/R color for each timeframe;
Line style + line width;
Pivot marker type + size;
Custom label styles + text scaling.
________________________________________________________________________________
✅ Benefits :
Perfect for traders who need instant multi-timeframe structure awareness ;
Reduces the need to constantly switch charts;
Works on all markets : crypto, stocks, forex, indices, futures;
Clean, modern, and intuitive visualization;
Helps confirm trend direction and key S/R levels at a glance.
________________________________________________________________________________
⚠️ Note
The indicator only displays S/R and trend data from higher timeframes relative to the current chart timeframe.

MTF Liquidity Levels Pro (D/W/M) [SmartFoxy]✅ SCRIPT DESCRIPTION (Premium MTF High-Low Levels)
Overview
This indicator automatically plots key High/Low levels across three major timeframes:
Daily (D) , Weekly (W) , and Monthly (M) .
It includes:
• Current period highs/lows (DH/DL, WH/WL, MH/ML);
• Previous period highs/lows (PDH/PDL, PWH/PWL, PMH/PML);
• Open levels (Day Open, Day True Open, Week Open, Month Open);
• Visual elements such as separators, period boxes, labels, and price markers;
• A fully customizable breakout alert system .
The indicator is designed for precise market structure analysis with a focus on liquidity, MTF mechanics, and clean price action.
________________________________________
How It Works
The script tracks historical High/Low levels on each timeframe and displays:
✅ Current High/Low Levels :
Daily;
Weekly;
Monthly.
✅ Previous High/Low levels from the previous day, week, and month:
PDH / PDL;
PWH / PWL;
PMH / PML.
You can select how many previous levels to display (1, 2, 3…).
✅ Open Levels:
Day Open;
Week Open;
Month Open.
Includes optional True Day Open with time offset.
✅ Visual Period Boxes highlighting each session (Day Box, Week Box, Month Box) to help identify intraday and intraperiod structure.
✅ Vertical Separators for the start of each day, week, and month.
✅ Customizable Labels & Price Markers with positions, sizes, and optional price display.
________________________________________
Alerts
A flexible alert module is built in:
✅ Breakout of Any Previous Level (D/W/M) •➤ Triggers when price breaks any previous High/Low:
PDH/PDL;
PWH/PWL;
PMH/PML.
✅ Breakout of Previous Level 1 (D/W/M) •➤ Triggers only for the closest previous levels:
PDH1/PDL1;
PWH1/PWL1;
PMH1/PML1.
✅ Custom Breakout •➤ Choose a specific level:
PDH / PDL;
PWH / PWL;
PMH / PML.
and select which level number (1, 2, 3…) the alert should track.
________________________________________
How to Use
Select which timeframes (D/W/M) to display.
Choose how many previous levels to plot.
Enable Open, Boxes, Separators, or Labels as needed.
Enable True Day Open with offset if required.
Activate Alerts and choose the breakout logic:
• All previous levels;
• Only the nearest level;
• Custom level selection.
Create an alert in TradingView using “Any alert() function call”.
________________________________________
Why This Indicator Is Useful
✅ Instantly reveals key High/Low liquidity zones across multiple timeframes
✅ Helps synchronize market structure across D/W/M levels
✅ Useful for identifying impulses, breakouts, reversals, and liquidity runs
✅ Highlights levels price frequently revisits
✅ Eliminates the need for additional MTF tools
✅ Alerts automate breakout detection for both intraday and swing traders
Suitable for all markets : Forex, Crypto, Indices, Stocks, Futures.

RightFlow Universal Volume Profile - Any Market Any TimeframeSummary in one paragraph
RightFlow is a right anchored microstructure volume profile for stocks, futures, FX, and liquid crypto on intraday and daily timeframes. It acts only when several conditions align inside a session window and presents the result as a compact right side profile with value area, POC, a bull bear mix by price bin, and a HUD of profile VWAP and pressure shares. It is original because it distributes each bar’s weight into multiple mid price slices, blends bull bear pressure per bin with a CLV based split, and grows the profile to the right so price action stays readable. Add to a clean chart, read the table, and use the visuals. For conservative workflows read on bar close.
Scope and intent
• Markets. Major FX pairs, index futures, large cap equities and ETFs, liquid crypto.
• Timeframes. One minute to daily.
• Default demo used in the publication. SPY on 15 minute.
• Purpose. See where participation concentrates, which side dominated by price level, and how far price sits from VA and POC.
Originality and usefulness
• Unique fusion. Right anchored growth plus per bar slicing and CLV split, with weight modes Raw, Notional, and DeltaProxy.
• Failure mode addressed. False reads from single bar direction and coarse binning.
• Testability. All parts sit in Inputs and the HUD.
• Portable yardstick. Value Area percent and POC are universal across symbols.
• Protected scripts. Not applicable. Method and use are fully disclosed.
Method overview in plain language
Pick a scope Rolling or Today or This Week. Define a window and number of price bins. For each bar, split its range into small slices, assign each slice a weight from the selected mode, and split that weight by CLV or by bar direction. Accumulate totals per bin. Find the bin with the highest total as POC. Expand left and right until the chosen share of total volume is covered to form the value area. Compute profile VWAP for all, buyers, and sellers and show them with pressure shares.
Base measures
Range basis. High minus low and mid price samples across the bar window.
Return basis. Not used. VWAP trio is price weighted by weights.
Components
• RightFlow Bins. Price histogram that grows to the right.
• Bull Bear Split. CLV based 0 to 1 share or pure bar direction.
• Weight Mode. Raw volume, notional volume times close, or DeltaProxy focus.
• Value Area Engine. POC then outward expansion to target share.
• HUD. Profile VWAP, Buy and Sell percent, winner delta, split and weight mode.
• Session windows optional. Scope resets on day or week.
Fusion rule
Color of each bin is the convex blend of bull and bear shares. Value area shading is lighter inside and darker outside.
Signal rule
This is context, not a trade signal. A strong separation between buy and sell percent with price holding inside VA often confirms balance. Price outside VA with skewed pressure often marks initiative moves.
What you will see on the chart
• Right side bins with blended colors.
• A POC line across the profile width.
• Labels for POC, VAH, and VAL.
• A compact HUD table in the top right.
Table fields and quick reading guide
• VWAP. Profile VWAP.
• Buy and Sell. Pressure shares in percent.
• Delta Winner. Winner side and margin in percent.
• Split and Weight. The active modes.
Reading tip. When Session scope is Today or This Week and Buy minus Sell is clearly positive or negative, that side often controls the day’s narrative.
Inputs with guidance
Setup
• Profile scope. Rolling or session reset. Rolling uses window bars.
• Rolling window bars. Typical 100 to 300. Larger is smoother.
Binning
• Price bins. Typical 32 to 128. More bins increase detail.
• Slices per bar. Typical 3 to 7. Raising it smooths distribution.
Weighting
• Weight mode. Raw, Notional, DeltaProxy. Notional emphasizes expensive prints.
• Bull Bear split. CLV or BarDir. CLV is more nuanced.
• Value Area percent. Typical 68 to 75.
View
• Profile width in bars, color split toggle, value area shading, opacities, POC line, VA labels.
Usage recipes
Intraday trend focus
• Scope Today, bins 64, slices 5, Value Area 70.
• Split CLV, Weight Notional.
Intraday mean reversion
• Scope Today, bins 96, Value Area 75.
• Watch fades back to POC after initiative pushes.
Swing continuation
• Scope Rolling 200 bars, bins 48.
• Use Buy Sell skew with price relative to VA.
Realism and responsible publication
No performance claims. Shapes can move while a bar forms and settle on close. Education only.
Honest limitations and failure modes
Thin liquidity and data gaps can distort bin weights. Very quiet regimes reduce contrast. Session time is the chart venue time.
Open source reuse and credits
None.
Legal
Education and research only. Not investment advice. Test on history and simulation before live use.


AUTOMATIC ANALYSIS MODULE🧭 Overview
“Automatic Analysis Module” is a professional, multi-indicator system that interprets market conditions in real time using TSI, RSI, and ATR metrics.
It automatically detects trend reversals, volatility compressions, and momentum exhaustion, helping traders identify high-probability setups without manual analysis.
⚙️ Core Logic
The script continuously evaluates:
TSI (True Strength Index) → trend direction, strength, and early reversal zones.
RSI (Relative Strength Index) → momentum extremes and technical divergences.
ATR (Average True Range) → volatility expansion or compression phases.
Multi-timeframe ATR comparison → detects whether the weekly structure supports or contradicts the local move.
The system combines these signals to produce an automatic interpretation displayed directly on the chart.
📊 Interpretation Table
At every new bar close, the indicator updates a compact dashboard (bottom right corner) showing:
🔵 Main interpretation → trend, reversal, exhaustion, or trap scenario.
🟢 Micro ATR context → volatility check and flow analysis (stable / expanding / contracting).
Each condition is expressed in plain English for quick decision-making — ideal for professional traders who manage multiple charts.
📈 How to Use
1️⃣ Load the indicator on your preferred asset and timeframe (recommended: Daily or 4H).
2️⃣ Watch the blue line message for the main trend interpretation.
3️⃣ Use the green line message as a volatility gauge before entering.
4️⃣ Confirm entries with your own strategy or price structure.
Typical examples:
“Possible bullish reversal” → early accumulation signal.
“Compression phase → wait for breakout” → avoid premature trades.
“Confirmed uptrend” → trend continuation zone.
⚡ Key Features
Real-time auto-interpretation of TSI/RSI/ATR signals.
Detects both bull/bear traps and trend exhaustion zones.
Highlights volatility transitions before breakouts occur.
Works across all assets and timeframes.
No repainting — stable on historical data.
✅ Ideal For
Swing traders, position traders, and institutional analysts who want automated context recognition instead of manual indicator reading.

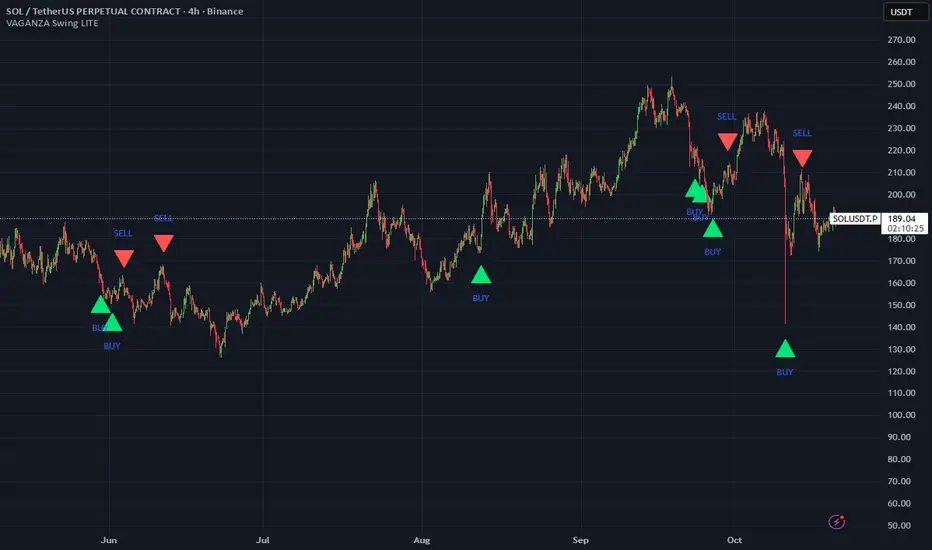
VAGANZA Swings V1 LITE1. Introduction: The Philosophy Behind VAGANZA Swings
The VAGANZA Swings V1 LITE was developed to solve a common problem faced by swing traders: getting caught in low-probability trades during choppy, sideways markets. Many indicators can identify a trend, but few can effectively measure its quality and pinpoint optimal, low-risk entry points within that trend.
This script is not merely a "mashup" of existing indicators. It is a structured, multi-layered filtering system where each component is specifically chosen to address the weaknesses of the others. The core philosophy is to trade only when there is a clear market consensus, confirmed by trend, strength, momentum, and volume. This results in fewer signals, but each signal is designed to be of significantly higher quality.
2. The VAGANZA Confirmation Engine: A Deeper Look at the Logic
A signal is only generated when four distinct market conditions align. This sequential confirmation process is what makes the script unique and robust.
Layer 1: The Trend Regime Filter
What it does: The indicator first establishes the dominant market bias using a dual-speed baseline system. A faster-reacting baseline is compared against a slower, more stable baseline to determine if the market is in a long-term bullish or bearish "regime."
Why it's important: This foundational step ensures we are never fighting the primary market current. BUY signals are disabled during a bearish regime, and SELL signals are disabled during a bullish regime, instantly eliminating 50% of potentially bad trades.
Layer 2: The Trend Strength & Conviction Qualifier
What it does: This is the script's core intelligence. After confirming the trend's direction, this layer uses a directional volatility engine to measure the trend's strength or conviction. It analyzes the expansion between bullish and bearish price movements.
Why it's important: A simple moving average crossover can occur in a weak, drifting market, leading to false signals. This filter requires the trend to be demonstrably powerful (above a predefined strength threshold of 25) before allowing the system to even look for an entry. It's the primary filter for avoiding sideways market traps.
Layer 3: The Dynamic Pullback & Entry Trigger
What it does: Instead of chasing price at its peak, the script waits for a natural "breather" or pullback. It employs a momentum cycle oscillator to identify when the price has become temporarily oversold within a strong uptrend, or overbought within a strong downtrend. The signal is triggered at the precise moment momentum appears to be rejoining the primary trend.
Why it's important: This ensures a more favorable risk-to-reward ratio. By entering on a pullback, traders can avoid buying the top or selling the bottom of a short-term swing, which is a common mistake.
Layer 4: The Volume Participation Check
What it does: As a final confirmation, the script checks the volume on the signal candle. It requires the volume to be higher than its recent average.
Why it's important: A price move without significant volume can be a trap. This final check confirms that there is genuine market participation and conviction behind the signal, suggesting that larger market players are supporting the move.
3. The Synergy of the System (Why This Combination is Original)
The originality of VAGANZA Swings lies not in its individual components, but in their synergistic interaction:
The Trend Regime Filter sets the stage.
The Trend Strength Qualifier prevents signals when the stage is poorly lit (i.e., a weak trend).
The Pullback & Entry Trigger tells the actor exactly when to enter the stage for maximum impact.
The Volume Check ensures the audience is actually watching.
Without the strength filter, the trend filter would fail in ranging markets. Without the pullback trigger, entries would have poor risk-reward. This interdependent, sequential logic provides a unique and useful tool that goes beyond what a single indicator can offer.
4. How to Use This Script
Timeframe: Optimized for the 4-Hour (H4) chart, as this provides a balance between meaningful swings and actionable signals. It can also be used on the Daily (D1) chart for longer-term analysis.
BUY Signal (Green "BUY" Arrow): Appears only when a strong, confirmed uptrend experiences a temporary, oversold pullback and volume confirms renewed buying interest. This is a high-probability signal to consider a long position.
SELL Signal (Red "SELL" Arrow): Appears only when a strong, confirmed downtrend experiences a temporary, overbought rally and volume confirms renewed selling pressure. This is a high-probability signal to consider a short position.
Risk Management: This indicator provides entry signals only. It is crucial that you apply your own risk management rules. Always use a stop-loss and have a clear take-profit strategy for every trade.
Disclaimer: This tool is for decision-support and does not constitute financial advice. All trading involves risk. Past performance is not indicative of future results. Please backtest thoroughly before using this script with real capital.
VWAP Entry Assistant (v1.0)Description:
Anchored VWAP with a lightweight assistant for VWAP reversion trades.
It shows the distance to VWAP, an estimated hit probability for the current bar, the expected number of bars to reach VWAP, and a recommended entry price.
If the chance of touching VWAP is low, the script suggests an adjusted limit using a fraction of ATR.
The VWAP line is white by default, and a compact summary table appears at the bottom-left.
Educational tool. Not financial advice. Not affiliated with TradingView or any exchange. Always backtest before use.

MILLION MEN - Discount Zone BreakoutsWhat it is
MILLION MEN — Discount Zone Breakouts (Lite & Stable) highlights a structure-based trading range from the latest confirmed swing high/low, renders Premium/Equilibrium/Discount zones, and raises one-shot breakout signals when price closes outside the range. It focuses on stable visuals and simple breakout logic suitable for intraday and swing trading.
How it works (high-level)
Confirmed swings: Uses ta.pivothigh/ta.pivotlow with auto or manual pivot length.
Range & zones: From the swing range, the tool derives Premium (top 25%), Equilibrium (50%), and Discount (bottom 25%).
Anchoring: Left edge is locked at the bar where the pivot confirms; the right edge can extend N bars.
One-shot breakouts:
Up breakout: first close > swingHigh (resets on new range).
Down breakout: first close < swingLow (resets on new range).
Optional on-close only mode to avoid intrabar noise.
Clean UI: Optional zone boxes, dashed equilibrium line, mid-labels (“Premium / Equilibrium / Discount”), and minimal candle coloring by regime.
How to use
Treat Discount as value area in bullish contexts and Premium as distribution area in bearish contexts.
Breakout dots (up/down) mark regime shifts beyond the current range; confirm with your higher-TF bias, volume, or momentum.
Tune pivot length and forward extension to your timeframe (e.g., smaller for scalping, larger for swings).
Originality & value
Unlike generic S/R overlays, this lite tool prioritizes confirmed swing structure with a fixed anchor, clear 25/50/75 zone mapping, and one-shot breakout logic to prevent repetitive signals until a new range forms. The emphasis is on stability + readability, making it a dependable building block in multi-indicator workflows.
Limitations & transparency
Breakouts on strong trends can retest or fail; always add confirmation (structure/volume).
Pivots confirm with delay equal to pivot length—this reduces repaint and is intentional.
Non-standard bar types are not supported for signal logic.
This indicator provides analysis, not financial advice.
Arabic
يعرض السكربت آخر مدى مؤكد من قمّة/قاع ويرسم مناطق Premium / Equilibrium / Discount، ويعطي إشارة اختراق لمرة واحدة عند إغلاق السعر فوق القمّة أو تحت القاع. الفكرة بسيطة وثابتة بصريًا، وتصلح للإنترادي والسوينغ. يُفضّل تأكيد الاختراق بهيكل أعلى إطار أو فوليوم/مومنتُم. تذكير: تأكيد القمم/القيعان متأخر بحسب طول البيفوت لتفادي إعادة الرسم.
LEGEND IsoPulse Fusion Universal Volume Trend Buy Sell RadarLEGEND IsoPulse Fusion • Universal Volume Trend Buy Sell Radar
One line summary
LEGEND IsoPulse Fusion reads intent from price and volume together, learns which features matter most on your symbol, blends them into a single signed Fusion line in a stable unit range, and emits clear Buy Sell Close events with a structure gate and a liquidity safety gate so you act only when the tape is favorable.
What this script is and why it exists
Many traders keep separate windows for trend, volume, volatility, and regime filters. The result can feel fragmented. This script merges two complementary engines into one consistent view that is easy to read and simple to act on.
LEGEND Tensor estimates directional quality from five causally computed features that are normalized for stationarity. The features are Flow, Tail Pressure with Volume Mix, Path Curvature, Streak Persistence, and Entropy Order.
IsoPulse transforms raw volume into two decaying reservoirs for buy effort and sell effort using body location and wick geometry, then measures price travel per unit volume for efficiency, and detects volume bursts with a recency memory.
Both engines are mapped into the same unit range and fused by a regime aware mixer. When the tape is orderly the mixer leans toward trend features. When the tape is messy but a true push appears in volume efficiency with bursts the mixer allows IsoPulse to speak louder. The outcome is a single Fusion line that lives in a familiar range with calm behavior in quiet periods and expressive pushes when energy concentrates.
What makes it original and useful
Two reservoir volume split . The script assigns a portion of the bar volume to up effort and down effort using body location and wick geometry together. Effort decays through time using a forgetting factor so memory is present without becoming sticky.
Efficiency of move . Price travel per unit volume is often more informative than raw volume or raw range. The script normalizes both sides and centers the efficiency so it becomes signed fuel when multiplied by flow skew.
Burst detection with recency memory . Percent rank of volume highlights bursts. An exponential memory of how recently bursts clustered converts isolated blips into useful context.
Causal adaptive weighting . The LEGEND features do not receive static weights. The script learns, causally, which features have correlated with future returns on your symbol over a rolling window. Only positive contributions are allowed and weights are normalized for interpretability.
Regime aware fusion . Entropy based order and persistence create a mixer that blends IsoPulse with LEGEND. You see a single line rather than two competing panels, which reduces decision conflict.
How to read the screen in seconds
Fusion area . The pane fills above and below zero with a soft gradient. Deeper fill means stronger conviction. The white Fusion line sits on top for precise crossings.
Entry guides and exit guides . Two entry guides draw symmetrically at the active fused entry level. Two exit guides sit inside at a fraction of the entry. Think of them as an adaptive envelope.
Letters . B prints once when the script flips from flat to long. S prints once when the script flips from flat to short. C prints when a held position ends on the appropriate side. T prints when the structure gate first opens. A prints when the liquidity safety flag first appears.
Price bar paint . Bars tint green while long and red while short on the chart to mirror your virtual position.
HUD . A compact dashboard in the corner shows Fusion, IsoPulse, LEGEND, active entry and exit levels, regime status, current virtual position, and the vacuum z value with its avoid threshold.
What signals actually mean
Buy . A Buy prints when the Fusion line crosses above the active entry level while gates are open and the previous state was flat.
Sell . A Sell prints when the Fusion line crosses below the negative entry level while gates are open and the previous state was flat.
Close . A Close prints when Fusion cools back inside the exit envelope or when an opposite cross would occur or when a gate forces a stop, and the previous state was a hold.
Gates . The Trend gate requires sufficient entropy order or significant persistence. The Avoid gate uses a liquidity vacuum z score. Gates exist to protect you from weak tape and poor liquidity.
Inputs and practical tuning
Every input has a tooltip in the script. This section provides a concise reference that you can keep in mind while you work.
Setup
Core window . Controls statistics across features. Scalping often prefers the thirties or low fifties. Intraday often prefers the fifties to eighties. Swing often prefers the eighties to low hundreds. Smaller responds faster with more noise. Larger is calmer.
Smoothing . Short EMA on noisy features. A small value catches micro shifts. A larger value reduces whipsaw.
Fusion and thresholds
Weight lookback . Sample size for weight learning. Use at least five times the horizon. Larger is slower and more confident. Smaller is nimble and more reactive.
Weight horizon . How far ahead return is measured to assess feature value. Smaller favors quick reversion impulses. Larger favors continuation.
Adaptive thresholds . Entry and exit levels from rolling percentiles of the absolute LEGEND score. This self scales across assets and timeframes.
Entry percentile . Eighty selects the top quintile of pushes. Lower to seventy five for more signals. Raise for cleanliness.
Exit percentile . Mid fifties keeps trades honest without overstaying. Sixty holds longer with wider give back.
Order threshold . Minimum structure to trade. Zero point fifteen is a reasonable start. Lower to trade more. Raise to filter chop.
Avoid if Vac z . Liquidity safety level. One point two five is a good default on liquid markets. Thin markets may prefer a slightly higher setting to avoid permanent avoid mode.
IsoPulse
Iso forgetting per bar . Memory for the two reservoirs. Values near zero point nine eight to zero point nine nine five work across many symbols.
Wick weight in effort split . Balance between body location and wick geometry. Values near zero point three to zero point six capture useful behavior.
Efficiency window . Travel per volume window. Lower for snappy symbols. Higher for stability.
Burst percent rank window . Window for percent rank of volume. Around one hundred to three hundred covers most use cases.
Burst recency half life . How long burst clusters matter. Lower for quick fades. Higher for cluster memory.
IsoPulse gain . Pre compression gain before the atan mapping. Tune until the Fusion line lives inside a calm band most of the time with expressive spikes on true pushes.
Continuation and Reversal guides . Visual rails for IsoPulse that help you sense continuation or exhaustion zones. They do not force events.
Entry sensitivity and exit fraction
Entry sensitivity . Loose multiplies the fused entry level by a smaller factor which prints more trades. Strict multiplies by a larger factor which selects fewer and cleaner trades. Balanced is neutral.
Exit fraction . Exit level relative to the entry level in fused unit space. Values around one half to two thirds fit most symbols.
Visuals and UX
Columns and line . Use both to see context and precise crossings. If you present a very clean chart you can turn columns off and keep the line.
HUD . Keep it on while you learn the script. It teaches you how the gates and thresholds respond to your market.
Letters . B S C T A are informative and compact. For screenshots you can toggle them off.
Debug triggers . Show raw crosses even when gates block entries. This is useful when you tune the gates. Turn them off for normal use.
Quick start recipes
Scalping one to five minutes
Core window in the thirties to low fifties.
Horizon around five to eight.
Entry percentile around seventy five.
Exit fraction around zero point five five.
Order threshold around zero point one zero.
Avoid level around one point three zero.
Tune IsoPulse gain until normal Fusion sits inside a calm band and true squeezes push outside.
Intraday five to thirty minutes
Core window around fifty to eighty.
Horizon around ten to twelve.
Entry percentile around eighty.
Exit fraction around zero point five five to zero point six zero.
Order threshold around zero point one five.
Avoid level around one point two five.
Swing one hour to daily
Core window around eighty to one hundred twenty.
Horizon around twelve to twenty.
Entry percentile around eighty to eighty five.
Exit fraction around zero point six zero to zero point seven zero.
Order threshold around zero point two zero.
Avoid level around one point two zero.
How to connect signals to your risk plan
This is an indicator. You remain in control of orders and risk.
Stops . A simple choice is an ATR multiple measured on your chart timeframe. Intraday often prefers one point two five to one point five ATR. Swing often prefers one point five to two ATR. Adjust to symbol behavior and personal risk tolerance.
Exits . The script already prints a Close when Fusion cools inside the exit envelope. If you prefer targets you can mirror the entry envelope distance and convert that to points or percent in your own plan.
Position size . Fixed fractional or fixed risk per trade remains a sound baseline. One percent or less per trade is a common starting point for testing.
Sessions and news . Even with self scaling, some traders prefer to skip the first minutes after an open or scheduled news. Gate with your own session logic if needed.
Limitations and honest notes
No look ahead . The script is causal. The adaptive learner uses a shifted correlation, crosses are evaluated without peeking into the future, and no lookahead security calls are used. If you enable intrabar calculations a letter may appear then disappear before the close if the condition fails. This is normal for any cross based logic in real time.
No performance promises . Markets change. This is a decision aid, not a prediction machine. It will not win every sequence and it cannot guarantee statistical outcomes.
No dependence on other indicators . The chart should remain clean. You can add personal tools in private use but publications should keep the example chart readable.
Standard candles only for public signals . Non standard chart types can change event timing and produce unrealistic sequences. Use regular candles for demonstrations and publications.
Internal logic walkthrough
LEGEND feature block
Flow . Current return normalized by ATR then smoothed by a short EMA. This gives directional intent scaled to recent volatility.
Tail pressure with volume mix . The relative sizes of upper and lower wicks inside the high to low range produce a tail asymmetry. A volume based mix can emphasize wick information when volume is meaningful.
Path curvature . Second difference of close normalized by ATR and smoothed. This captures changes in impulse shape that can precede pushes or fades.
Streak persistence . Up and down close streaks are counted and netted. The result is normalized for the window length to keep behavior stable across symbols.
Entropy order . Shannon entropy of the probability of an up close. Lower entropy means more order. The value is oriented by Flow to preserve sign.
Causal weights . Each feature becomes a z score. A shifted correlation against future returns over the horizon produces a positive weight per feature. Weights are normalized so they sum to one for clarity. The result is angle mapped into a compact unit.
IsoPulse block
Effort split . The script estimates up effort and down effort per bar using both body location and wick geometry. Effort is integrated through time into two reservoirs using a forgetting factor.
Skew . The reservoir difference over the sum yields a stable skew in a known range. A short EMA smooths it.
Efficiency . Move size divided by average volume produces travel per unit volume. Normalization and centering around zero produce a symmetric measure.
Bursts and recency . Percent rank of volume highlights bursts. An exponential function of bars since last burst adds the notion of cluster memory.
IsoPulse unit . Skew multiplied by centered efficiency then scaled by the burst factor produces the raw IsoPulse that is angle mapped into the unit range.
Fusion and events
Regime factor . Entropy order and streak persistence form a mixer. Low structure favors IsoPulse. Higher structure favors LEGEND. The blend is convex so it remains interpretable.
Blended guides . Entry and exit guides are blended in the same way as the line so they stay consistent when regimes change. The envelope does not jump unexpectedly.
Virtual position . The script maintains state. Buy and Sell require a cross while flat and gates open. Close requires an exit or force condition while holding. Letters print once at the state change.
Disclosures
This script and description are educational. They do not constitute investment advice. Markets involve risk. You are responsible for your own decisions and for compliance with local rules. The logic is causal and does not look ahead. Signals on non standard chart types can be misleading and are not recommended for publication. When you test a strategy wrapper, use realistic commission and slippage, moderate risk per trade, and enough trades to form a meaningful sample, then document those assumptions if you share results.
Closing thoughts
Clarity builds confidence. The Fusion line gives a single view of intent. The letters communicate action without clutter. The HUD confirms context at a glance. The gates protect you from weak tape and poor liquidity. Tune it to your instrument, observe it across regimes, and use it as a consistent lens rather than a prediction oracle. The goal is not to trade every wiggle. The goal is to pick your spots with a calm process and to stand aside when the tape is not inviting.

Composite Stochastic Oscillator (CSO) [SharpStrat]Composite Stochastic Oscillator (CSO)
The Composite Stochastic Oscillator (CSO) is a refined momentum tool designed to improve on the limitations of the traditional stochastic indicator. Standard stochastics are often too sensitive, producing choppy signals and frequent false turns. CSO tackles this problem by combining multiple stochastic calculations, each with different lengths and smoothing settings, into a single, balanced output.
The goal of combining these stochastic variants is to create a more stable and reliable reading of market momentum. Each version of the stochastic captures different aspects of price behavior like shorter ones react faster, while longer ones filter noise. CSO brings them together mathematically to form a composite oscillator that reacts smoothly and consistently across varying market conditions. This makes it a useful improvement over the standard stochastic, providing traders with a more dependable signal while retaining the familiar interpretation framework.
How It Works
Calculates five independent stochastic oscillators with customizable K, D, and slowing parameters.
Each stochastic contributes to the final composite value according to its assigned weight, allowing the user to emphasize faster or slower reactions.
The resulting composite K is then smoothed into a D line using a chosen moving average method (SMA, EMA, WMA, or RMA).
The oscillator is plotted along with optional overbought/oversold levels and a color fill to enhance visual interpretation.
A compact on-chart table displays the current K and D readings for quick reference.
Comparison with normal Stochastic
Compared to a standard stochastic, the CSO generally produces smoother lines and fewer false flips. As evident in the comparison chart, this improves upon the normal stochastic by reducing noise and making signals more reliable, although results depend on parameter settings too.
How To Use It
Use the CSO exactly like a normal stochastic: look for crossovers, overbought/oversold zones, and divergences.
In practice, CSO should provides smoother and more consistent signals than the regular stochastic, especially in sideways or volatile markets.
When plotted beside a standard stochastic, you’ll notice CSO avoids many of the false reversals that clutter traditional readings.
Customization Options
Choice of smoothing method (SMA, EMA, WMA, RMA).
Full control over each stochastic component’s parameters and weights.
Adjustable overbought/oversold levels and display preferences.
Option to enable or disable the on-chart table and zone fills.
Note
This indicator is shared purely for educational and research purposes. It is not financial advice and should not be treated as a ready-made trading system.
I encourage you to experiment with different parameter values (periods, weights, smoothing) to explore how the behavior changes and to learn from the results.

Continuation Suite v1 — 5m/15mContinuation Suite v1 — 5m/15m (Non-Repainting, S/R + Trend Continuation)
What it does
Continuation Suite v1 is a practical intraday toolkit that combines non-repainting trend-continuation signals with auto-built Support/Resistance (S/R) from confirmed pivots. It’s designed for fast, liquid names on 5m charts with an optional 15m higher-timeframe (HTF) overlay. You get: stacked-EMA bias, disciplined pullback+reclaim entries, optional volume/volatility gates, a “Strong” signal tier, solid S/R lines or zones, and a compact dashboard for fast reads.
⸻
Why traders use it
• Clear bias using fast/mid/slow EMA stacking.
• Actionable entries that require a pullback, a reclaim, and (optionally) a minor break of prior extremes.
• Signal quality gates (volume vs SMA, ATR%, ADX/DI alignment, EMA spacing, slope).
• Non-repainting logic when “Confirm on Close” = ON. Intrabar previews show what’s forming, but confirmed signals only print on bar close.
• S/R that matters: confirmed-pivot lines or ATR-sized zones, optional HTF overlay, and auto de-dup to avoid clutter.
⸻
Signal construction (no magic, just rules)
Bullish continuation (base):
1. Trend: EMA fast > EMA mid > EMA slow
2. Pullback: price pulls into the stack (lowest low or close vs EMA fast/mid over a lookback)
3. Reclaim: close > EMA fast and close > open
4. Break filter (optional): current bar takes out the prior bar’s high
5. Filters: volume > SMA (if enabled) and ATR% ≤ max (if enabled)
6. Cooldown: a minimum bar gap between signals
Bearish continuation (base): mirror of the above.
Strong signals: base conditions plus ADX ≥ threshold, DI alignment (DI+>DI- for longs; DI->DI+ for shorts), minimum EMA-spacing %, and minimum fast-EMA slope.
Reference stops:
• Longs: lowest low over the pullback lookback
• Shorts: highest high over the pullback lookback
Alerts are included for: Bullish Continuation, Bearish Continuation, STRONG Bullish, STRONG Bearish.
⸻
S/R engine (current TF + optional HTF)
• Builds S/R from confirmed pivots only (left/right bars).
• Choose Lines (midlines) or Zones (ATR-sized).
• Zones merge when a new pivot lands near an existing zone’s mid (ATR-scaled epsilon).
• Touches counter tracks significance; you can require a minimum to draw.
• HTF overlay (default 15m) draws separate lines/zones with tiny TF tags on the right.
• De-dup option hides current-TF zones that sit too close to HTF zones (ATR-scaled), reducing overlap.
• Freeze on Close (optional) keeps arrays stable intrabar; snapshots show levels immediately as bars open.
⸻
Presets
• Auto: Detects QQQ-like tickers (QQQ, QLD, QID) or SoFi; else defaults to Custom.
• QQQ: Tighter ATR% and EMA settings geared to index-ETF behavior.
• SoFi: Wider ATR allowances and longer mid/slow for single-name behavior.
• Custom: Expose all key inputs to tune for your product.
⸻
Dashboard (top-right)
• Preset in use
• Bias (Bullish CONT / Bearish CONT / Neutral)
• Strong (Yes/No)
• Volatility (ATR% bucket)
• Trend (ADX bucket)
• HTF timeframe tag
• Volume (bucket or “off”)
• Signals mode (Close-Confirmed vs Intrabar)
⸻
Inputs you’ll actually adjust
Trend/Signals
• Fast/Mid/Slow EMA lengths
• Pullback lookback, Min bars between signals
• Volume filter (vol > SMA N)
• ATR% max filter (cap excessive volatility)
• Require break of prior bar’s high/low
• “Strong” gates: min EMA slope, min EMA spacing %, ADX length & threshold
Support/Resistance
• Lines vs Zones
• Pivot left/right bars
• Extend left/right (bars)
• Max pivots kept (current & HTF)
• Zone width (× ATR), Merge epsilon (× ATR), Min gap (× ATR)
• Min touches, Max zones per side near price
• De-dup current TF vs HTF (× ATR)
Repainting control
• Confirm on Close: when ON, signals/SR finalize on bar close (non-repainting)
• Freeze on Close: freeze S/R intrabar with snapshot updates
• Show previews: translucent intrabar labels for what’s forming
⸻
How to use it (straightforward)
1. Load on 5-minute chart (baseline). Keep Confirm on Close ON if you hate repainting.
2. Use Bias + Strong + S/R context. If a long prints into HTF resistance, you have information.
3. Manage risk off the reference stop (pullback extreme). If ATR% reads “Great,” widen expectations; if “Poor,” size down or pass.
4. Alerts: wire the four alert types to your workflow.
⸻
Notes and constraints
• Designed for liquid symbols. Thin books and synthetic “volume” will degrade the volume gate.
• S/R is pivot-based. On very choppy tape, touch counts help. Increase min touches or switch to Lines to declutter.
• If your chart timeframe isn’t 5m, behavior changes because lengths are in bars, not minutes. Tune lengths accordingly.
⸻
Disclaimers
This is a research tool. No signals are guaranteed. Markets change, outliers happen, slippage is real. Nothing here is financial advice—use your own judgment and risk management.
⸻
Author: DaddyScruff
License: MPL-2.0 (Mozilla Public License 2.0)

Swing H1 + M15 ComboThis indicator only use to H1 & M15 timeframe
✅ Entry Guidelines
Identify the Trend (H1 Swing Call)
A confirmed Swing Buy on H1 sets the trend to bullish.
A confirmed Swing Sell on H1 sets the trend to bearish.
The trend only changes when a new confirmed swing signal closes on H1.
Confirm with M15
On M15, wait for a buy signal if the H1 trend is bullish.
On M15, wait for a sell signal if the H1 trend is bearish.
✅ How It Works
H1 Swing Calls define the overall trend direction (bullish or bearish).
M15 CE Signals confirm short-term entries in line with the H1 trend.
A trade setup is only valid when both timeframes agree.
📈 Entry Strategy
Buy Setup:
H1 confirms a Swing Buy trend
M15 prints a CE Buy signal
Stop loss: below nearest swing low / structure
Sell Setup:
H1 confirms a Swing Sell trend
M15 prints a CE Sell signal
Stop loss: above nearest swing high / structure
Swing Failure Pattern SuvorovIndicator: Logic-based Swing Failure Pattern (SFP)
What is the logic of my indicator based on and what makes it unique:
1. The indicator can calculate extreme candles that close with huge shadows and a small body and it works on any timeframe.
2. The indicator analyzes the volumes on which the desired bar was closed. This function is customizable. That is, you can build a search for signals according to your trading strategy, based on the number of volumes. What does this mean - you select the number of previous bars where the indicator calculates the average value and based on these numbers, you can set up: how many times the desired candle should be larger than the previous average volume.
3. Since SFP is based on the removal of important liquidity, the search for such situations occurs from swing structures (swing high/low). When these parameters are found on the chart (on history), the indicator draws the situation and shows where important liquidity was removed and why the trading situation appeared right now.
4. The indicator gives recommendations on possible takes and stops.
The structure of takes has a built-in logic for searching for previous swings to remove liquidity, as well as searching for imbalances to cover them (50 and 100%).
5. For TP (Take Profit): there are 3 TPthat can be adjusted to your trading strategy (Risk/Profit). For example: you always trade from 2 to 1 on the 1st Take, 3 to 1 on the second, 5 to 1 on the third: you can set all this in the indicator and all your targets will be detected by the indicator, taking into account the logic of searching for important ranges. If, for example, in your 3 to 1 range there are no important zones for TP, then the indicator writes that NaN (not found).
6. The indicator works on any timeframe.
7. The indicator has a built-in RSI logic, which comes as an additional function to the indicator. If this function is enabled, then trading situations are detected only when there is a divergence (from the swing point to the extreme bar that has formed).
Trade Holding Time Background HighlighterTrade Holding Time Background Highlighter
This script visually highlights the chart background based on how old each bar is relative to the current time. It’s designed for crypto futures traders (and other active traders) who want to quickly see whether price action falls inside a day trading window, a swing trading window, or is considered older history.
⸻
🔑 Features
• Dynamic Background Highlighting
• Day Trader Zone (default = last 24 hours, light green).
• Swing Trader Zone (default = last 2 weeks, light yellow).
• Older Zone (beyond 2 weeks, light gray).
• Customizable Colors
• Choose your own background colors for each zone.
• Adjust opacity to make shading subtle or bold.
• Adjustable Timeframes
• Change day trading hours (default: 24 hours).
• Change swing trading window (default: 14 days).
• Simple, Intuitive Design
• Instantly see whether the current market structure is suitable for scalps/day trades, swing trades, or simply part of older price action.
⸻
🎯 Why Use This?
As a futures/perpetual trader, knowing the context of price action is crucial:
• Scalpers/Day Traders focus on the most recent 24h.
• Swing Traders look back 1–2 weeks.
• Anything older often has less weight for short-term setups.
This script highlights those zones automatically, saving you time and giving clarity on whether you’re trading inside a fresh opportunity window or old, less relevant price action.

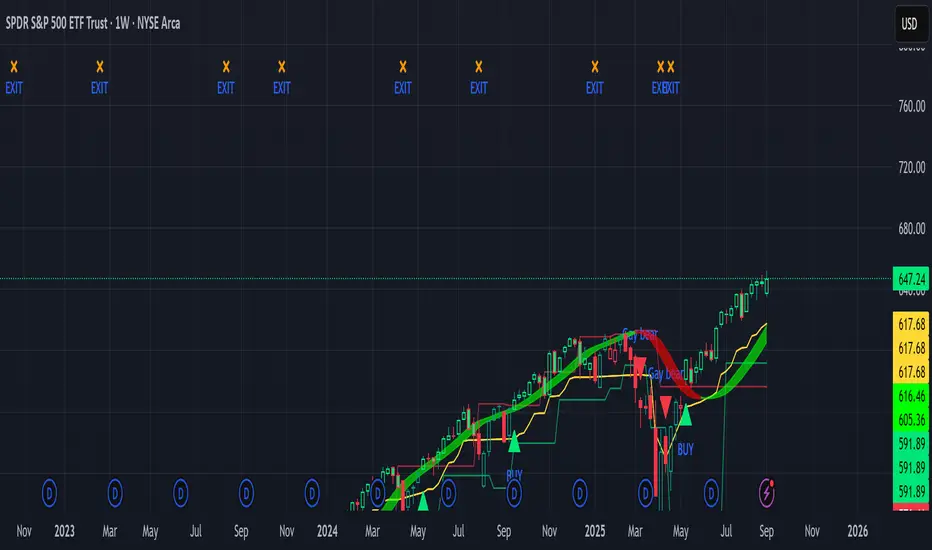
Sniper Swing — Short TF (Clean Signals) [v6]📘 How to Use the Sniper Swing Indicator
1. What It Does
It looks for short-term swing breaks in price.
It uses an oscillator (RSI/Stoch) and swing pivots to confirm moves.
It gives you 3 clear signals only:
BUY → Enter long (expecting price to go up).
Gay bear → Enter short (expecting price to go down).
EXIT → Close your trade (long or short).
Candles also change color:
Green = in a BUY trade.
Red = in a Gay bear trade.
Neutral (gray/none) = no trade.
2. When to Use
Works best on short timeframes (1m–5m) for scalping/intraday.
Use on liquid markets (MES/ES, NQ, SPY, BTC, ETH).
Avoid dead hours with no volume (like overnight futures lull or midday chop).
3. How to Trade With It
A. BUY trade
Wait for a BUY triangle below the candle.
Confirm:
Candle turned green.
Price broke a recent swing high.
Oscillator shows strength (indicator does this for you).
Enter long at the close of that candle.
Place your stop-loss:
At the yellow stop line (auto trailing stop), or
Just below the last swing low.
Stay in while candles are green.
Exit when:
An orange X appears, or
Price hits your stop.
B. Gay bear (short) trade
Wait for a Gay bear triangle above the candle.
Confirm:
Candle turned red.
Price broke a recent swing low.
Oscillator shows weakness.
Enter short at the close of that candle.
Place stop-loss:
At the yellow stop line, or
Just above the last swing high.
Stay in while candles are red.
Exit on an orange X or stop hit.
4. Pro Tips for New Traders
Only take one signal at a time → don’t double dip.
Quality > Quantity: ignore weak, sideways markets. Best signals happen during trends.
Start small: trade micros (MES) or small position sizes.
Use alerts: set TradingView alerts for BUY/Gay bear/EXIT so you don’t miss setups.
Think of the indicator like a navigator: it tells you the likely path, but you’re the driver → always manage risk.
5. Quick Mental Checklist
Signal? (BUY or Gay bear triangle)
Confirmed? (candle color + swing break)
Enter? (on close)
Stop? (yellow line or swing)
Exit? (orange X or stop)
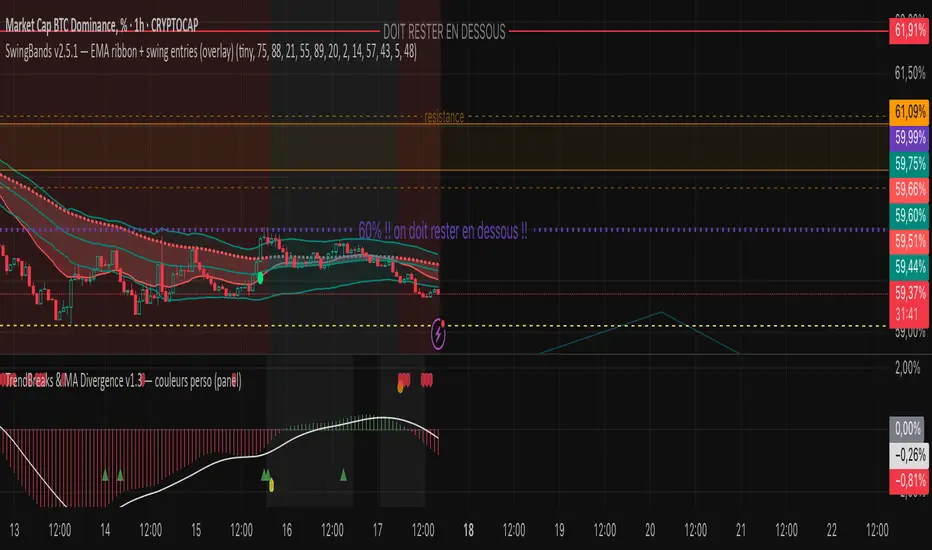
TrendBreaks & MA Divergence v1.3 — couleurs perso (panel)clean and easy predictive mouvements and swing stratagy
Recent Range DetectorOverview
The Recent Range Detector is a specialized indicator designed to identify when an asset is currently range-bound, providing traders with clear support and resistance levels for range trading strategies. Unlike traditional indicators that focus on trend detection, this tool specifically answers the question: "Is the price range-bound right now, and what are the exact trading levels?"
Key Features
✅ Smart Range Detection - Uses a multi-factor scoring system to identify legitimate ranges
✅ Dynamic Support/Resistance Levels - Automatically calculates and displays key trading levels
✅ Range Quality Scoring - Provides confidence levels (Strong/Moderate/Weak Range)
✅ Touch Validation - Counts actual price touches to confirm range reliability
✅ Breakout Detection - Alerts when price exits the established range
✅ Visual Clarity - Clean boxes, lines, and labels for easy interpretation
How It Works
The indicator analyses recent price action using three core metrics:
Touch Quality (40%) - How many times price has respected support/resistance levels
Containment Quality (40%) - What percentage of recent bars stayed within the range
Recent Respect (20%) - Whether the latest price action confirms the range
These combine into a Range Score (0-1) that determines range strength and reliability.
Settings & Parameters
Range Lookback Period (Default: 15)
Number of bars to analyse for range detection
Shorter periods = more responsive to recent ranges
Longer periods = more stable, fewer false signals
Range Tolerance (Default: 2.0%)
Tolerance for price touches around exact highs/lows
Lower values = stricter range requirements
Higher values = more flexible range detection
Minimum Touches (Default: 3)
Required number of support/resistance touches for valid range
Higher values = more confirmed ranges, fewer signals
Lower values = more sensitive, earlier detection
Visual Options
Show Range Box: Displays the range boundaries
Show Support/Resistance Lines: Extends levels into the future
Understanding the Output
Range Score (0.000 - 1.000)
0.7+ = Strong Range (Green) - High confidence range trading setup
0.5-0.7 = Moderate Range (Yellow) - Decent range with some caution
0.3-0.5 = Weak Range (Orange) - Low confidence, be careful
<0.3 = Not Ranging - Avoid range trading strategies
Range Status Classifications
Strong Range - Perfect for range trading strategies
Moderate Range - Good range with normal risk
Weak Range - Marginal range, use smaller positions
Not Ranging - Price is trending or too choppy for range trading
Key Metrics in Info Table
Range Size (%) - Size of the range relative to price level
5-15% = Ideal range size for most strategies
<5% = Tight range, lower profit potential
>15% = Wide range, higher profit potential but more risk
Support/Resistance Levels - Exact price levels for entries/exits
Use these as your key trading levels
Support = potential buy zone
Resistance = potential sell zone
Total Touches - Number of times price respected the levels
3-5 touches = Newly formed range
6-10 touches = Well-established range
10+ touches = Very strong, reliable range
Price Position (%) - Current location within the range
0-20% = Near support (potential long opportunity)
80-100% = Near resistance (potential short opportunity)
40-60% = Middle of range (wait for better entry)
Visual Elements
Range Box
Green Box = Strong Range (Score ≥ 0.7)
Yellow Box = Moderate Range (Score 0.5-0.7)
Orange Box = Weak Range (Score 0.3-0.5)
Support/Resistance Lines
- Horizontal lines showing exact trading levels
- Extend into the future for forward guidance
- Colour matches the range strength
Background Colouring
- Subtle background tint during range periods
- Helps quickly identify ranging vs trending markets
Breakout Signals
- 📈 RANGE BREAK UP - Price breaks above resistance
- 📉 RANGE BREAK DOWN - Price breaks below support
- Only appears for confirmed ranges (Score ≥ 0.5)
Trading Applications
Range Trading Strategy
1. Look for Range Score ≥ 0.5
2. Buy near support (Price Position 0-20%)
3. Sell near resistance (Price Position 80-100%)
4. Set stops just outside the range
5. Exit on breakout signals
Breakout Strategy
1. Identify strong ranges (Score ≥ 0.7)
2. Wait for volume-confirmed breakout
3. Enter in breakout direction
4. Use previous resistance as support (or vice versa)
Market Context
- Strong ranges often occur after trending moves
- Use higher timeframes to confirm overall market structure
- Combine with volume analysis for better entries/exits
Best Practices
What to Look For
✅ Range Score ≥ 0.5 for trading consideration
✅ Multiple touches (5+) for confirmation
✅ Clear price rejection at levels
✅ Reasonable range size (5-15% for most assets)
✅ Recent price respect of boundaries
What to Avoid
❌ Trading ranges with Score < 0.3
❌ Very tight ranges (<3% size) - low profit potential
❌ Ranges with only 1-2 touches - not confirmed
❌ Ignoring breakout signals
❌ Trading against the higher timeframe trend
Alerts Available
- Range Detected - New range formation
- Range Break Up - Upward breakout
- Range Break Down - Downward breakout
- Range Ended - Range condition ended
Timeframe Recommendations
- Daily Charts - Best for swing trading ranges
- 4H Charts - Good for intermediate-term ranges
- 1H Charts - Suitable for day trading ranges
- Lower Timeframes - May produce more noise
Conclusion
The Recent Range Detector eliminates guesswork in range identification by providing objective, quantified range analysis. It's particularly valuable for traders who prefer range-bound strategies or need to identify when trending strategies should be avoided.
Remember: No indicator is perfect. Always combine with proper risk management, volume analysis, and broader market context for best results.
Disclaimer
This indicator is for educational purposes only and should not be considered as financial advice. Trading involves risk, and past performance does not guarantee future results. Always conduct your own research and consider your risk tolerance before making any trading decisions.

Ultimate Precision Buy/Sell with SL - Clean Labels FIXThis is a premium indicator designed for traders who demand accuracy, simplicity, and clean visual signals.
✅ Key Features:
📈 Precise Buy/Sell entries based on trend confirmation (EMA) and momentum (RSI)
🛡️ Automatic Stop Loss (SL) drawn for every trade, calculated from ATR
🔄 SL line dynamically moves with each new candle to reflect live action
❗ Only one active signal at a time – no clutter, no repaints
⏱ Optimized for 1H timeframe
💰 Best for Forex pairs, Gold (XAUUSD), Silver (XAGUSD), Platinum (XPTUSD)
🧠 How it works:
Buy Signal: When fast EMA > slow EMA & RSI crosses above 30
Sell Signal: When fast EMA < slow EMA & RSI crosses below 70
A single SL line is drawn per trade and remains until either:
Opposite signal appears, or
SL is hit
⚠️ No repainting. No noise. Just precision.
If you want to trade smart, clean and with confidence – this indicator is built for you.
