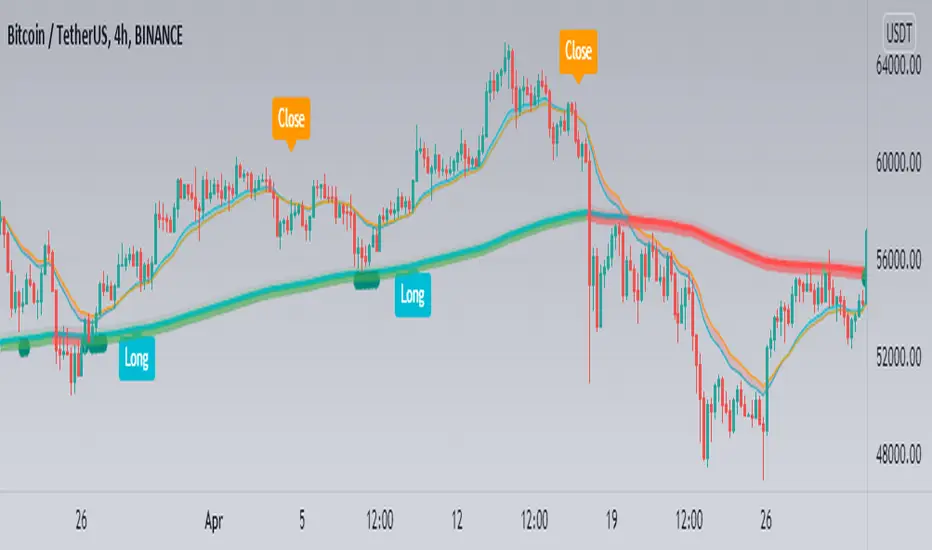
RedK Chop & Breakout Scout (C&B_Scout)The RedK Chop & Breakout Scout (C&BS or just CBS) is a centered oscillator that helps traders identify when the price is in a chop zone, where it's recommended to avoid trading or exit existing trades - and helps identify (good & tradeable) price breakouts.
i receive many questions asking for simple ways to identify chops .. Here's one way we can do that.
(This is work in progress - i was exploring with the idea, and wasn't sure how interesting other may find it. )
Quick Intro:
==================
Quick techno piece: This concept is similar to a Stochastic Oscillator - with the main difference being that we're utilizing units of ATR (instead of a channel width) to calculate the main indicator line - which will then lead to a non-restricted oscillator (rather than a +/- 100%) - given that ATR changes with the underlying and the timeframe, among other variables.
to make this easy, and avoid a lot of technical speak in the next part, :) i created (on the top price panel) the same setup that the C&B Scout represents as a lower-panel indicator.
So as you read below, please look back and compare what C&BS is doing in its lower panel, with how the price is behaving on the price chart.
how this works
========================
- To identify chops and breakouts, we need to first agree on a definition that we will use for these terms.
- for the sake of this exercise, let's agree that the price is in a chop zone, as long as the price is moving within a certain distance from a "price baseline" of choice ( which we can adjust based on the underlying, the volatility, the timeframe, the trading style..etc)
- when the price moves out of that chop zone, we consider this a breakout
- Now not all breakouts are "good" = they need to at least happen in the direction of the longer term trend. In this case, we can apply a long Moving Average to act as a filter - and consider breakouts to be "good" if they are in the same direction as the filter line
- With the above background in mind, we establish a price baseline (as you see on the top panel, this is based on the midline of a Donchian Channel - but we can use other slow moving averages in future versions)
- we will decide how far above/below that baseline is considered to be "chop zone" - we do this in terms of units of Average True Range (ATR) - using ATR here is valuable for so many reasons, most of all, how it adjusts to timeframe and volatility of underlying.
- The C&B Scout line simply calculates how far the price is above/below the baseline in terms of "ATR units". and shows how that value compares to our own definition of a "chop zone"
- so as long as the price is within the chop zone, the CBS line will be inside the shaded area - and when the price "breaks out" of the chop zone, the CBS line will also breakout (or down) from the chop zone.
- C&B Scout will give a visual clue to help take trades in the direction of the prevailing trend - the chop zone is green when the price is in "long mode", as in, the price is above the filter line - and will be red when we are in "short mode" - so the price is below the filter line. in green mode, we should only consider breakouts to the upside, and ignore breakouts to the downside (or breakdowns) - in red mode, we should only consider breakouts to the downside., and ignore the ones to the upside.
- i added some examples of "key actions" on the chart to help explain the approach here further.
Usage & settings Notes:
========================
- even though for many traders this will be a basic concept/setup, i still highly suggest you spend time getting used to how it works/reacts and adjusting the settings to suit your own trading style, timeframe, tolerance, what you trade....etc
- for example, if i am a conservative trader, i may consider any price movement within 1 x ATR above and below the baseline to be in "chop" (ATR Channel width = 2 x ATR) - and i want to only take trades when the price moves outside of that range *and* in the direction of the prevailing trend
- An aggressive trader may use a smaller ATR-based value, say 0.5 x ATR above/below the baseline, as their chop zone.
- A swing trader may use a shorter filter line and focus on the CBS line crossing the 0 line.
- .... and so on.
- Also note that the "tradeable" signal is when the CBS line "exits" the chop zone (upward on green background, or downward on red background) - however, an aggressive trader may take the crossing of the CBS line with the 0 line as the signal to open a trade.
- As usual please do not use this indicator "in isolation" and ensure you have other confirming signals from your setups before trading.
conclusion
===========
As i mentioned, this is really a simple concept - and i'm a big fan of those :) -- and there's so much that could be done to expand around it (add more visuals/colors, add alerts, add options for ATR calculation, Filter line calculations, baseline..etc) - but with this v1.0, i wanted to share this initially and see how much interest and how valuable fellow traders find it, before playing any further with it. so please be generous with your comments.
Swingtrading

SMA VWAP BANDS [qrsq]Description
This indicator is used to find support and resistance utilizing both SMA and VWAP. It can be used on lower and higher time frames to understand where price is likely to reject or bounce.
How it works
Rather than using the usual calculation for the VWAP, instead this script smooths the volume first with the SMA and then respectively calculates the smoothed multiplication of high, low and close price with the volume individually. These values are then divided by the smoothed volume to find individual VWAP's for each of the sources. The standard deviations of these are calculated, resulting in an upper, lower and middle band. It is essentially VWAP bands with some smoothed calculations in the middle.
How to use it
I like to use the bands for LTF scalping as well as HTF swings.
For scalping:
I tend to use either the 5m or 15m TF
I then set the indicator's TF to 1m
I will take a scalp based on the bands confluence with other PA methods, if price is being either supported or rejected.
For swings:
I tend to use a variety of TFs, including: 30m, 1H, 4H, D
I then set the indicator's TF to "Chart"
I will take a swing based on the bands confluence with other PA methods, if price is being either supported or rejected.
I also tend to use them on perpetual contracts as the volume seems to be more consistent and hence results in more accurate support and resistance.

Simple Swing with T3MAThis indicator is based on T3 Moving Average , which was first described in the January 1998 issue of the " Stocks & Commodities " journal in the article " Smoothing Techniques For More Accurate Signals " by Tim Tillson.
The T3 Moving Average was developed in the search for a “perfect” moving average, which would have 2 characterictics:
Smooth (not sensitive to random noise in the underlying price)
Would not lag behind the price
The smoothness of a filter could be improved by running it through itself multiple times, at the cost of increasing the phase lag. So, we choose a moving average with a very minimal lag (Generalized DEMA), & run it through itself multiple times to get a smoother version with with minimal lag (T3 MA). The problem with multiple runs though these filters increase their tendency to overshoot the data, giving an unusable result. To solve this problem, we need to simply turn down the volume by using a volume factor less than 1. Using a value for v less than 1, & running GDEMA (Generalized DEMA) through itself multiple times we get a new, smoother moving average (T3) that does not overshoot the data:
T3(n) = GDEMA(GDEMA (GDEMA(n)))
Traditionally, the entry is mainly done by crossovers between a fast and a slow moving average (MA). When the fast MA crosses up the slow MA, the trader takes it as a buy signal. Similarly, when the fast MA crosses down the slow MA, we get a sell signal. These traditional signals are lagging .
In the Simple Swing Strategy, we propose the Early Upswing (E0) & Early Downswing (Ex) terminologies. The Early Upswing starts when the T3 ribbon is red (i.e. Fast T3MA is lesser than slow T3MA), but the price has closed above the ribbon. This is the E0 candle. Similarly, the Early Downswing starts when the T3 ribbon is green (i.e. Fast T3MA is greater than slow T3MA), but the price has closed below the ribbon. This is the Ex candle.
The long entry (or the short exit) is taken once the price closes above the red ribbon.
The long exit (or the short entry) is taken once the price closes below the green ribbon.
Thereafter, the color of the ribbon confirms the swings. When we have the green ribbon, we are in a Confirmed upswing . When we have the red ribbon, we are in a Confirmed downswing .
p.s. It should be noted that the terms “swing” & “trend” are not interchangable. You can have an upswing in a downtrend, & a downswing in an uptrend. An upswing in an uptrend is the most reliable environment for long positions, & vice versa.
---------------------------------------------------------------
References:
- T3 Average by HPotter (2014)
- T3MA Ribbon by JustUncleL (2017)

Scot Signal IndicatorThe Scot Signal Indicator is intended as a Scalping Resource. It was designed to work best on the ❗❗ 5 MINUTE CHART with Bitcoin ❗❗ / USD & USDT pairs.
🟡🔼🔽 Yellow Triangles : these are pre-signals. If the triangle is Pointing Down, then look for a possible Short to come, and vice-versa for Upward facing triangles will go Long.
* Be careful, this is a Canary in the Coal Mine, but not the full signal. Going purely on the triangle as a signal could lead to fake-outs more frequently.
🟩 🟥 Green & Red Boxes : these are "Long" & "Short" signals where the indicator feels the time is safe to enter a trade.
❗ EXITING THE TRADE ❗ : this is a scalping indicator, specifically meant for entering trades, NOT EXITING them. An ideal scalp is $100 - $200 Bitcoin move. Though, we run bots using this indicator, taking scalps as little
as $60, performing up to 8 trades a day.

LNL Pullback ArrowsBuying the dip has never been easier! LNL Pullback Arrows are here to pinpoint the best possible entries for the trend following setups. With the Pullback Arrows, trader can pick his own approach and risk level thanks to four different types of arrows. The goal of these arrows is to force the traders to scale in & out of trades which is in my opinion crucial when it comes to trend following strategies. These arrows were designed primarily for the daily & weekly time frame (swing trading).
Four Types of Pullback Arrows:
1. Aggro Arrows - Ideal for aggresive approach during parabolic trends. Sometimes trends are so strong that the price barely revisits the daily 8 EMA. This is where the aggro arrows can perfectly pinpoint the aggresive high risk entries. Ideal for halfsize or 1/4 size of the full position. Aiming for quick 1-2 day moves targeting the recent high/low. These arrows could be also named as scalping arrows for the swing traders. A quick In & Out.
2. HalfSize Arrows - Medium risk approach. First arrows to scale in. HalfSize arrows are the first sign that the pullback might be ending, yet there is still some space left for an even deeper pullback. That is the reason why they are called half-size. Ideally taken with half-sized position. When trading the HalfSize Arrows, It is better to have some "spare ammo in the gun" ready to use.
3. FullSize Arrows - Regular risk approach. These arrows represent a zone where the core of the posititon should be taken. The point of validity for the trend is not that far away, meaning the risk can be kept tight. Ideal for scailing the other halfs or quarters of the full position. Also great for more conservative traders or environments with higher volatility.
4. Rare Arrows - Offer the best risk to reward entries during the trend. Rare Arrows should be the "last kick" of the retracement, therefore stops can be positioned really tight. They either trigger the stop immidiately or they provide another juicy leg up or down in the direction of the trend. However, they really do appear rarely.
Simple EMA Cloud:
A simple cloud based on 21 and 55 exponential moving averages. This default length creates a pullback zone that is wide enough for the conservative traders but also give the opportunities to more aggresive traders. Alternatives such as 8 & 21, or 21 & 34 are forming the zone that is too aggresive and usually too thin. Of course, cloud can be fully adjusted or turned off completely. The only role of the cloud is to gauge the trend.
Tips & Tricks:
1.Importance of the Scailing
- As already stated, scailing is crucial to this since there is no way of knowing the exact level at which the price magically bounce every time. It is hard to tell where and which EMA will be respected. How can we know it will be 21 EMA every time? or 34 EMA or 10 EMA or 100 SMA or 50 DMA ... Single MA does not make a trend. This is the reason why scailing is so important. Scailing can make a difference.
2. Nothing is Perfect
- Same as any other study, nothing works 100% perfectly. Sometimes the setup will go right against you and sometimes the price will fade away sideways and breaks off the structure of the trend. This is not a magic certainty tool. This is just another probability tool.
3. Point of Validity & Other Studies
- Even though the pullback arrows can be a stand-alone strategy. It is important to use other indicators that visualize the actual trend. Whether its EMA Cloud or EMAs or DMI Bars or Keltner Channels, there should be something that validates the trend, something that tells the trend is over. (Pullback Arrows are not showing the actual stops!).
Hope it helps.

Infiten's Return Candle OscillatorInfiten's Return Candle Oscillator is an oscillator which shows the percentage return on the open, high, close and low over a customizable period in the form of candlesticks. It may be helpful for seeing volatility, swing trading, or mean reversion trading.
The RCO consists of two plotted elements :
RCO Candles (short length): candlesticks which are plotted with low = the product of the percentage changes in the low over a period, high = the product of the percentage changes in the high over a period, close = the product of the percent changes in close over a period, and open = the product of the percentage changes in return over a period. Similarly to with standard candlesticks, if the percentage change on the close is higher than the percentage change on the open, the candlestick is green, otherwise it is red.
Smoothed RCO Line (long length) : a moving average of the average of the low, close, open and high calculated for the RCO Candles. The line's transparency is determined by the percentage difference between the RCO and the highest or lowest RCO over the long length. A more transparent line means that the RCO is closer to the highest or lowest RCO, and may be indicative of a reversal, or weakening trend.

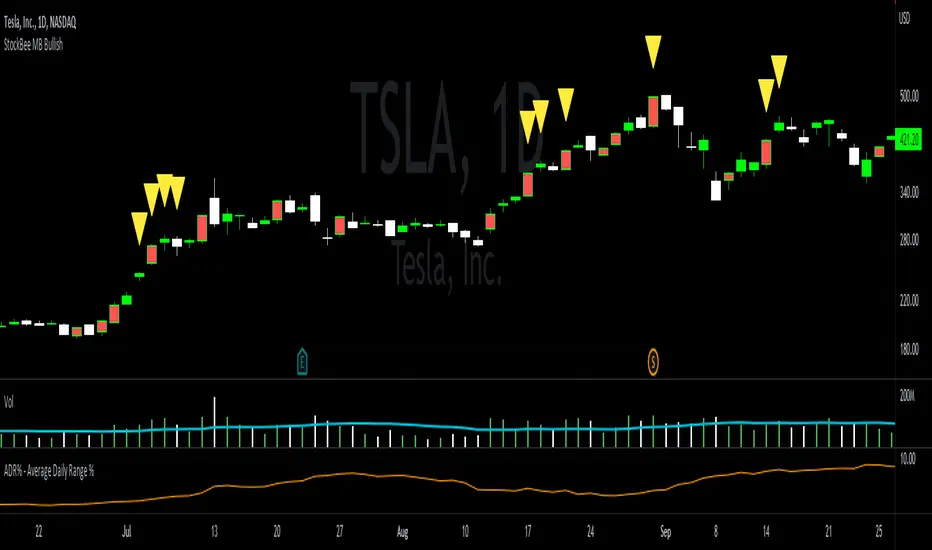
StockBee MB BullishStockBee Bullish Momentum Burst & 20% Plus Study Tool
The Stockbee bullish momentum burst study tool is helpful for practitioners of the momentum burst method who want to easily find historical momentum bursts and/or 20% plus gainers using Trading View. This script finds three specific breakouts that meet the below criteria:
4% Breakouts (Colors Candle Body)
1. Volume of the candle is greater than the previous candle volume.
2. The percent change of candle's price is greater than 4% from the previous candle close.
3. Current candle close is less than 30% from candle's high.
**Users can toggle 4% Breakouts on/off and also change candle body color in settings**
Dollar Breakouts (Colors Candle Body)
1. The change of candle's price is greater than $0.90 from the previous candle close.
2. Current candle close is less than 30% from candle's high.
** Dollar Breakout does not take volume into consideration **
**Users can toggle Dollar Breakouts on/off and also change candle body color in settings**
20% Plus Gainers (Displays Yellow Triangle Icon)
1. The change over five candles is greater than 20%.
**Users can toggle 20% plus label on/off, cannot change the label color**
This script also filters out any candle that gaps up and breaks down with a close above 4% the previous candle (Eliminates gap-ups that fade). This tool is meant to find and filter possible candidates. Not every marked candle is a great momentum burst trade. Users can look at 4% Breakouts, Dollar Breakouts, 20% Plus Gainers individually or any combination of the three.
This is helpful for Trading View users trading this specific setup.
StockBee 4% BreakoutThe Stockbee 4% Breakout script is a study tool for users who wants to do a deep dive on StockBee's 4% Breakout momentum burst method. This script will assist a specific group of traders who trade this method easily find historical momentum bursts. This script finds and colors red any candle body that meets the following criteria:
1. Volume of the candle is greater than the previous candle volume.
2. The percent change of candle's price is greater than 4% from the previous candle close.
3. Current candle close is less than 30% from candle's high.
This script also filters out any candle that gaps up and breaks down with a close above 4% the previous candle (Eliminates gap-ups that fade). This tool is meant to find and filter possible candidates. Not every marked candle is a great momentum burst trade.
This is very helpful for Trading View users trading this specific setup.

Swing High Swing Low This tool is the swing high swing low indicator. A swing high/low is a technical pattern that describes a local peak or trough on a chart. By connecting these peaks and troughs, we can determine the general direction the asset is trading. This indicator can be used on all time frames and in any market.
To use it, declare how many candles are needed to determine a swing level. By default, the indicator is set to two candles. This means that a candle must have two candles to the right AND left (totaling 5 consecutive candles) to be considered a swing level. If the middle candle has the highest high of the 5 consecutive candles, it will be classified as a Swing High. If the middle candle has the lowest low, it will be a Swing Low. Otherwise, it will be ignored.
Once a swing number is declared, the indicator will look for a starting swing high and swing low. The asset will trade inside the range established by the swing high/low lines. When the lines are parallel, it is considered a form of consolidation. You will likely see a lot of whipsaw action or chart patterns like bullflags or head-shoulders. Wait patiently for a break of this consolidation. The indicator will identify the new swing levels when the asset breaks out of this range.
Depending on the direction of the break, it will turn green for an uptrend or red for a downtrend. You should look to take long positions when the lines are green and short when the lines are red. You can use old swing levels as support or resistance in the future. The longer the line, the greater the likelihood that it will be support or resistance. This can help you identify potential entries.
The goal of this script is to make it easier to determine trends. Sometimes, we take the wrong trade because we don't understand which way the market is trending and what levels are important. This indicator is meant to take the guesswork out and make the trade easy and emotionless. This indicator works well on its own, but I suggest pairing it with another to add an extra confirmation before taking a trade. Happy Trading!
**Please note: Assets that have traded parabolically (steep inclines or declines) will have wide ranges that may not be broken. (see GME 2021)**
RSI Swing Trading Setup (2-Period)A simple script that adjusts the RSI visibly in order to better accommodate swing trading and certain swing trading setups/strategies.
--------------------------------------------------------------------------------------------------------------------------------------------------------
Best used in conjunction with "Linear Regression Channel by LonesomeTheBlue" with 2.2σ (std.dev) and Show Fib Levels.
^Click image for a redirect to that script.
--------------------------------------------------------------------------------------------------------------------------------------------------------
In certain price action patterns:
A bearish reversal from a previously bullish move can indicate tops of a rally if the RSI moves from 0-40 to 60 (1)
A bullish reversal from a previously bearish move can indicate bottoms of a pullback if the RSI moves from 60-100 to 40 (2)
(USE THE LINEAR REGRESSION CHANNEL TO VALIDIFY THE RETRACEMENTS)
--------------------------------------------------------------------------------------------------------------------------------------------------------
(1)
--------------------------------------------------------------------------------------------------------------------------------------------------------
(2)
--------------------------------------------------------------------------------------------------------------------------------------------------------

ORB Parabolic SAR Multi Time Frame (PSAR MTF)
This is an adaptation of the inbuilt PSAR function in a Multi Time Frame .
When MTF enabled It will plot two timeframe simultaneously as follows:-
1 Min with 5 Min (HTF)
5 Min with 15 Min(HTF)
15 Min with 1H(HTF)
1H with 4H(HTF)
4H with Daily(HTF)
Daily with Weekly(HTF)
Weekly with Monthly(HTF)
The higher timeframe(HTF) will get plotted in bigger circled lines.
By enabling plotting of all levels, you can see all current levels of all TF( M1 ,M5,M15,H,4H,D,W,M) on the same screen as "X" on the right side.
Alerts allow you to get alerts when these crossover happens.

Clutch AlgoThe Clutch Algo provides reversal signals and trend signals. The indicator can be used for stocks, crypto and forex. It can also be used for day trading and swing trading.
Reversal signals were done by modifying the Bollinger Bands and MACD and combining them in a unique way to find explosive price actions. These have been modified to provide signals at the bottom or top of a trend to catch price reversals and to improve margin of safety on trades. These signals are labeled as “Long” and “Short”.
We also added automatic support and resistance zones to increase the accuracy of the “Long” and “Short” signals. This was done by using historical price action of highs and lows and periods of consolidation where price reversed.
The trend signals, which are labeled as “Bull” and “Bear” signals use a combination of exponential moving averages. These signals can be used as trend continuations.
We also added an exponential moving average cloud to help traders easily visualize trend. This can be used as a guide to help you stay in a trade to maximize profits. It can also be used as a guide to get out of a trade if price breaks out of the cloud. The third use of the cloud can be used as support resistance in between high/low support and resistance zones.
Tips:
- Only take long/short signals when there is a support or resistance zone formed at or near the long/short signal, preferably within 1-3 bars of the support or resistance zone. Signals too far from "Long" or "Short" signals reduces your margin of safety.
- When in a Long or Short position, use support or resistance zones as a stop loss level as price is likely to go against the position.
- When taking a Long/Short or Bull/Bear signal, wait for candles to be completed to get best entry possible.
- Previous support zones can be used as resistance zones and previous resistance zones can be used as support zones.
- The support and resistance (SR) period can be adjusted. Numbers in the SR settings are bars looking back. For example, a setting of 10, looks back 10 bars.
Trend Pro ReversalTrend Pro Reversal Indicator ( TPR ) is a trend following indicator that I created to analyze market trends.
It is a perfect tool for investors/swing traders to ride the waves.
The algorithm combines several settings.
Multiple moving averages and indicators to follow the trend : their confluence associates a color at each daily candle:
-Red ( bearish ++ )
-Green ( bullish ++ )
-Orange (trend reversal - pre bearish )
-Light blue (trend reversal - pre bullish )
Color precision can be managed in the settings pannel. More precision = more reactivity but also can imply more false signals. The optimal settings is between 32 to 34.
-"Bottom detector" (green dots) : volume based algo, generally corresponds to Spikes in selling volume , and interesting low prices zones.
>>>This setting need to be adjust to each asset and exchanges because it's volume based. Some exchange are more relevant than other (coinbase, ftx, binance..)
For exemple for bitcoin , coinbase with a 150-160 bottom setting is good for mid-long term bottoms.
The lower bottom precision is, the more it shows short term dips.
- "Weakness detector" (white dots) : weakness in the trend - avoid fake outs
>>>This is not necesseraly a sell signal.
When buying momentum and price action is weak, this parameter is actived. It can often lead to short/mid term dump
- Confirmation cloud :
>>>Break it to the upside and there are more chances that the trend is confirmed. It often acts like support cloud in bitcoin bullmarkets. Waiting for the break of the confirmation cloud imply lower risk but also lower performance for swing traders.
Accumulate and averaging down when an asset shows green dots + red candles (bottom zone) and start to close position when weakness come in (green/orange/early-red /white dots) can permit to maximize gains in bullmarket and protect wallet when corrections happen.
-> Ideal use in daily timeframe . Some false signal can happen only when the trend is not clear. (tight range and f*ckmoves)
Designed for bitcoin initially. (works with most altcoins / stocks )

Bias Pivot PointA simple indicator that uses Pivot Points as a filter and to generate a Directional Bias .
How to use this indicator?
1. Directional Bias
Bullish => Closing Price > Pivot Point
Bearish => Closing Price < Pivot Point
2. Support / Resistance
Each Pivot Points can be used as Support or Resistance
3. Take Profit Targets
Each Pivot Points can be used as targets for taking profit

Swing ComparatorHere I bring you an array of methods to compare the swings and consistency between assets.
This indicator is excellent for swing traders and scalpers looking to maximize their profits by examining which of two closely related pairs provides greater price fluctuation during given period.
This indicator works against two assets, which are to be configured in settings.
This indicator has 5 particular plots for you to examine, each which can be considered for you to contemplate which pair for you to next perform a trade on.
First off, let's start with the blue.
The blue is simply a pearson correlation coefficient, thankfully now included in tradingview. This provides a value of 1 as values show to be close correlation, 0 showing no correlation, and -1 showing negative correlation - meaning an increase in one pair correlates to a decrease in another pair. This will turn green when greater than 0.975, showing a very strong relationship between the two pairs, and red when below -0.975. This is the only plot to be interpreted on a scale from -1 to +1.
Next, we have the purple and yellow background plots, followed by the white and green moving averages. Though similar, these are all slightly different.
For each of these 4 plots, a value greater than 0 indicates greater price swings for your Symbol #1, while a value less than 0 indicates greater price swings for Symbol #2.
These calculations are performed on a per bar basis, meaning you're likely going to be examining bars longer than what you'll normally be trading on. Use confluence, as well as your own judgement for this.
For example, if symbol #1 provides a bar with an open value 1% greater or less than close, providing a 1% swing on a given bar, but symbol #2 provides 2%, the indicator will fall down toward the negative, as Symbol #2 had the greater swing.
First, yellow focuses on only open/close bar values, and thus the body of the candlestick.
Purple, on the other hand, focuses on the wicks of the candle - thus, the high/low values. I've opted to make these two different values as a wick focuses on the embodiment within the time period, and body focuses on the open/close instant.
Next, the green is an extended EMA of the purple - High/Low ratio. This is important to examine trend overtime, and reduce unneeded noise.
Lastly, the white is simply difference in the standard deviation of the particular bars, between the two symbols you have selected. The tends to usually tie up with the green pretty well.
Considering this is going to by nature be very noisy datasets, I have included in settings the option to extend an EMA for everything. They have their default settings, but if you'd like to examine the trend without an EMA, feel free to set it to 1 to eliminate its effects.
I have additionally added the ability to introduce clipping, as well as scale the correlation coefficient to remain visible when examining very short term time scales. In the future, I hope to properly normalize all plots to remain within a -1 to +1 basis. Please be patient as I have multiple projects ongoing.
Suggestions and constructive criticism are very well encouraged.
Anyone is welcome to utilize this in their code, as well, i just ask you provide credit.
As you reduce to time frames less than a day, you will likely have to reduce the coefficient min/max closer to 0.025, or just hide it entirely.
TODO:
Make it look better. Sorry, folks.
Introduce latency between pairs.
Examine significance of a coefficient of determination
Remove static weights and introduce z-score and linear normalization.
Consider adding room for a 3rd pair. This could get ugly, however.

RSI true swingsRelative Strength Index (RSI) is being used by majority of the traders to get benefitted based on the swings. But these swings are hard to Identify.
This Indicator uses 4 major factors for finding the potential reversal points:
RSI Crossover or crossunder
Relative volume
Overall volume against the moving average volume
Relative closing of the candles
Size of the bars
Please read Instructions carefully before using this indicator
Recommended entry is the OHLC4 of the signal bars.
If signal bar is too large, try to enter in the retracement when another signal comes either through indicator or through types of bars
when signals comes opposite to the trend, then try to wait for the next signal of same type. This creates a RSI-price divergence in confirmation by volume price action
Timeframe can be of your choice
Recommended stoploss should be swing highs or lows

Swing Pivots High LowBINANCE:BTCUSDT
This indicator is an opensource merge of the built in 'Pivot Points High Low' and the most popular 'Swing-high-low-support-resistance' indicators. The original 'Pivot Points High Low' does not have extensions with better visibility, while the most popular 'Swing-high-low-support-resistance' has no source available. I've also added additional configurable alert conditions for Pivot High and Low Crossover/Crossunder.
Please read the official documentation for further information about the indicator.

BloodSwing Indicator-SWING TRADING STRATEGY FOR PASSIVE TRADERS-
A Multi-timeframe Strategy
This swing trading strategy uses three moving averages pegged to the 4H timeframe, to enter and exit the market on the 1H timeframe.
The 200 EMA (4H timeframe) is used to identify areas of support. If this moving average shows signs of support (shown as green circles under candles), the 18 and 22 moving average (4hour timeframe) crossover is used to enter the market, but on the 1 hour chart (for more accuracy) and only after an increase in volume on the 1 hour timeframe has been detected.
Manually this strategy is explained as follows:
1. Look for candle support on 200 MA (4H Timeframe)
2. On the 1H chart, look for the crossover of 18 and 22 ma (4H Timeframe)
3. As soon as you see volume increase on 1H, enter.
4. Exit on cross under of 18 and 22 ma (4H Timeframe)
5. Stop Loss below 200EMA support candle low.
Signals:
- Support signals are shown as green circles under the candles
- Long, Close, Stop signals are shown as labels and can be toggled on and off.
Extras (In option menu):
MA Deviation:
A standard deviation measure used on the 200 EMA in order to provide some range for support signals to be considered valid.
Use volume expansion for entry:
As an option (on by default), you can disable volume increase as a condition for entry.
Swing EMAWhat is Swing EMA?
Swing EMA is an exponential moving average crossover-based indicator used for low-risk directional trading.
it's used for different types of Ema 20,50,100 and 200, 3 of them are plotted on chat 20,100,200.
100 and 200 Ema is used for showing support and resistance and it contains highlights area between them and its change color according to market crossover condition.
20 moving average is used for knowing Market Behaviour and changing its color according to crossover conditions of 50 and 20 Ema.
How does it work?
It contains 4 different types of moving averages 20,50,100, 200 out of 3 are plotted on the chart.
20 Ema is used for knowing current market behavior. Its changes its color based on the crossover of 50 Ema and 20 Ema, if 20 Ema is higher than 50 Ema then it changes its color to green, and its opposites are changed their color to red when 20 Ema is lower than 50 Ema.
100 and 200 Ema used as a support and resistance and is also contain highlighted areas between them its change their color based on the crossover if 100 Ema is higher than 200 Ema a then both of them are going to change color to Green and as an opposite, if 200 Ema is higher then 100 Ema is going to change its color to red.
So in simple word 100 and 200 Ema is used as support and resistance zone and 20 Ema is used to know current market behavior.
How to use it?
It is very easy to understand by looking at the example I gave where are the two different types of phrases. phrase bull phrase and bear phrase so 100 and 200 Ema is used as a support and resistance and to tell you which phrase is currently on the market on example there is a bull phrase on the left side and bear phrase on the right side by using your technical analysis you can find out a really good spot to buy your stocks on a bull phrase and too short on the bear phrase. 20 Ema is used as a knowing the current market behavior it doesn't make any difference on buying or selling as much as 100 Ema and 200 Ema.
Tips
Don't trade against the market.
Try trade on trending stocks rather than sideways stock.
The higher the area between 100 Ema and 200 Ema is the stronger the phrase.
Do Backtesting before real trading.
Enjoy Trading.

Swing Dream - PAINT BARS | MA | EMA | DMA | VWAP | TABLE | ADR %- Swing Dream -
Script created for breakout-swing traders, in the style of QullaMaggie * , Dan Zanger, Oliver Kell, and Stockbee.
The following indicators are used by most successful breakout-swing traders such as mentioned above.
(As published) it contains:
Painted Bars, also known as inside/outside candles. Used for candle analysis and to determine breakout pivots & levels. For instance; use it in different timeframes and seek formations (ex, 3-1-2). For further inspiration, study Rob Smith's The Strat .
MA, Simple Moving Averages (Basic levels = 10,20,50,200). Use this indicator to define resistance/support areas as well as the overall long/swing-term trend. In breakout strategies such as EP, Flags, etc this can be used for trailing stops; an example, post-breakout, let the price ride the 20ma before exiting your position.
EMA, Exponential Moving Averages with periods inspired by Qullamaggie (10,20,65). Use this on shorter timeframes (ex, 1h) and for the same principles as MAs.
VWAP, Volume-Weighted Average Price. As for the previous, utilize this as a level indicator to find areas of resistance/support. Good for swing-trading as it implies whenever holders are profitable or not.
DMA, Displaced Moving Average (Horizontal). Personally, I use this a lot. Works very well for trailing stops (post breakout) and "bounce" areas. Choose your own offset and period.
ADR%, Average Daily Range Percentage. Displayed in the table and used to define a symbol's volatility. A very good tool for Qullamaggie-style trading. Personally, I try to find setups with over 6% ADR. Basic definition; low ADR% = Increased chance of a symbol to move slower and in smaller ranges. A higher value equals the opposite.
Table. A table with basic symbol-related information. Could save you plenty of time whenever you scan or search for new swing setups. Looking to add more features here.
Why should you use this script? Well, instead of having tens of different indicators, use this script and combine everything together with EP, Flag, or breakout principles. Suited for every plan, and more efficient in my opinion.
View settings to turn on/off different indicators.
* If you're looking for an introduction and further explanation of how Qullamaggie uses mentioned indicators, I could recommend checking out his website, stream, or participation in "Chat With Traders".
At last, I want to credit: @jkcqld @neolao @TheScrutiniser
This Script will get updated and improved.
// TechFille006

Swing Indicator (Tune for FCPO)Special indicator for FCPO (Crude Palm Oil Futures - Bursa Malaysia Derivative) traders but you can try another instrument.
Trend determination and buy/sell signals are using the Alligator system from Bill Williams.
To get maximum profit, the system uses the trailing stop technique using Average True Range (ATR) with 4 moving average options (RMA, SMA, EMA, WMA).
Please leave comments if any opinions.
Disclaimer
The content is in any event provided with the intention of being for general circulation and availability only. As such it is not intended to and does not form part of any offer or recommendation directed at you specifically, or have any regard to your investment objectives, financial situation, or needs of yourself or any other specific person. Before committing to a trade or investment, please seek advice from financial or other professional advisers regarding the suitability of the trade for you. If you do not wish to seek such financial advice, please consider carefully whether the product is suitable for you as you alone remain responsible for your trading gains and losses.
Beakdoo swing trading boxHi forks,
I'm trader Baekdoosan who trading Equity from South Korea. This Baekdoo swing trading box indicate good buying position when it crossover the box.
Here's the ideas
1. It needs to crossover 1 month highest value and higher than 5 ema and 20 ema line
2. It also needs to crossover 1 month volume as well
3. Once 1,2 soaring candle emerge, it needs to correction time
4. 5 ema or 20 ema or center candle's 2/3 point x 0.95 (5% lower) would be the resistant line
5. center candle's 2/3 point line would be the buying point (you may can trade when it cross over
you can check above example chart and take a look what you have interested in.
hope this will help your trading on equity as well as crypto. I didn't try it on futures . Best of luck all of you. Gazua~!
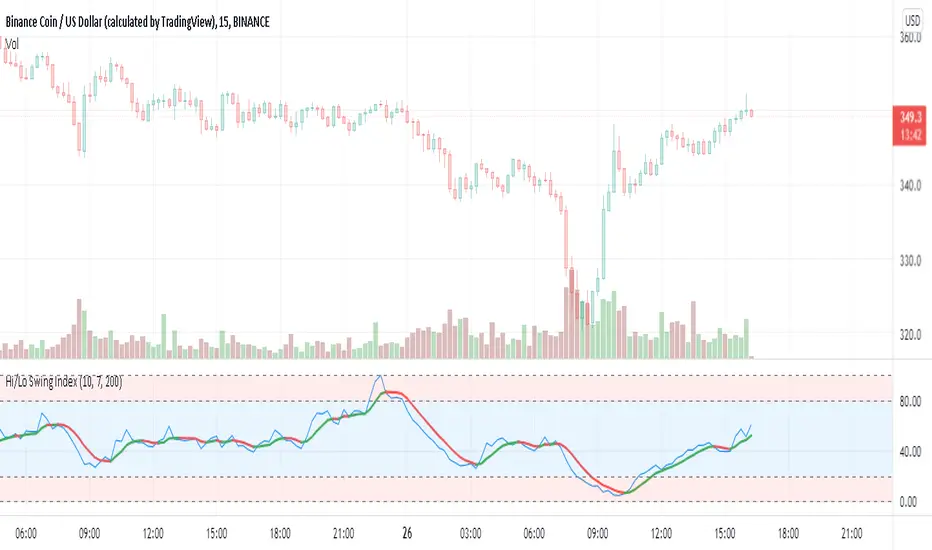
Hi/Lo Swing Index [by hajixde]Author: Hajixde
This indicator illustrates the High-to-Low variation. It works nicely on shorter time frames.
The index value is calculated based on the observation length (Memory Length). By changing this input, you can have a wider or shorter observation range.
MA Length is the moving average filter length, which smooths out the signal.
There is an additional smoothing function to make the output even smoother (Smoothing Length). Remember, that "Smoothing Length" is better to be less than "MA Length".
You may activate the trend direction.