52 Week High/Low FibonacciThe primary purpose of this indicator is to calculate and plot the 52-week high and low prices along with the Fibonacci retracement levels on the price chart. Fibonacci levels are commonly used in trading to identify potential support, resistance, and price reversal points.
First, the script initializes the Fibonacci levels and their corresponding colors, which will be used to plot the levels on the chart. Next, it calculates the 52-week high and low prices by finding the highest and lowest prices over the last 252 trading days, approximately equivalent to one year. Then, it identifies the overall trend direction by comparing the number of bars since the highest high and the lowest low. If the highest high is more recent, the trend is considered downwards; if the lowest low is more recent, the trend is upwards.
The script then plots the Fibonacci retracement levels on the chart, using horizontal lines at the respective price levels. It also creates labels for each level, displaying the percentage and the price value. Additionally, it draws a line connecting the 52-week high and low prices, providing a visual representation of the price range during the 52-week period.
Pros of this indicator include:
-Automatic calculation and plotting of Fibonacci levels, saving time for traders
-Clear trend identification based on 52-week high and low prices
-Visually appealing and easy-to-read chart representation with color-coded levels
-Provides insight into potential price reversal areas based on widely used Fibonacci levels
Cons of this indicator include:
-Only works on daily timeframes, limiting its usefulness for intraday and weekly traders
-Assumes that the trend will continue in the same direction, which may not always be accurate in real-world markets
-Does not provide explicit buy or sell signals, leaving the trading decision-making process up to the trader
-Solely relies on Fibonacci levels, which may not always be accurate; it is recommended to use other technical indicators or strategies alongside this indicator for a comprehensive trading approach
In conclusion, the '52 Week High Low Fibonacci' indicator is a valuable tool for traders interested in using Fibonacci levels for identifying potential price reversal points. By automatically calculating and plotting these levels based on 52-week high and low prices, the indicator provides a clear, color-coded visual aid, which can be especially helpful for traders who base their strategies on these levels.
However, it's worth noting that this indicator is limited to daily timeframes and doesn't provide explicit buy or sell signals, requiring traders to incorporate their own analysis and judgement in their decision-making process. The indicator also operates on the assumption of trend continuation, which may not always hold true.
While it's a beneficial tool, relying solely on this indicator for trading decisions may not be advisable. It's best used in conjunction with other indicators and trading strategies, providing a more balanced and comprehensive approach to trading in the financial markets. As always, risk management should be a key part of any trading strategy.
**YOUR INSIGHTFUL FEEDBACK OR SUGGESTIONS FOR REVISIONS TO THIS CODE ARE HIGHLY APPRECIATED. PLEASE FEEL FREE TO SHARE YOUR THOUGHTS TO FOSTER ITS CONTINUAL IMPROVEMENT**
技術分析

DCA Detective | v1.0BINANCE:FETBUSD
The DCA Detective | v1.0 strategy revolutionizes the realm of DCA (Dollar Cost Averaging) trading, integrating advanced trade initiation predicated on savvy Technical Analysis (TA) signals. This strategy's distinctive feature rests in its capacity to leverage TA signals or preset percentage levels to trigger safety orders, providing adaptability based on your preference. Bid farewell to rudimentary safety order placements.
The strategy incorporates a comprehensive array of parameters:
RSI Oversold Level - a predetermined level signaling a potential oversold condition where a price rebound may be imminent.
Divergence Lookback Period - this parameter specifies the duration over which the system scrutinizes for any disparity between price and RSI.
Minimum Bars Between Trades - this guarantees a specific interval between trades, thwarting excessive trading and promoting diversification over time.
Rate of Change (ROC) - a momentum-oriented technical indicator that gauges the percentage alteration in price between the current price and the price a certain number of periods back.
Stochastic Length and Oversold - parameters that delineate the Stochastic Oscillator, another momentum indicator that compares a particular closing price of a security to a spectrum of its prices over a specified period.
Higher Timeframe RSI Length and Oversold Level - for heightened precision, these parameters operate on lower timeframes, offering a wider outlook and aiding in the filtering of market noise.
The DCA Detective | v1.0 strategy deploys bullish divergence identified by the RSI and a crossover of the RSI over the oversold level as primary entry signals. Safety order conditions can be set to either Percentage or Smart, based on your preference. The "Smart" condition utilizes the same rules as the initial entry order to place safety orders.
The strategy also entails additional configuration settings such as the maximum safety orders, safety order price deviation, safety order volume scale, safety order step scale, and take profit percentage.
Main goal is to catch possible market bottom/dip.
In summary, the DCA Detective | v1.0 strategy proposes a sophisticated and nuanced approach to DCA trading. It taps into the potential of TA signals to initiate trades, while using safety orders as a risk management tool, with the intent to minimize possible losses and decrease overall time in trade. This strategy stands as a testament to refined trading tactics, crafted for those who endorse strategic investment and measured risk-taking.
Through webhook integration, the DCA Detective | v1.0 strategy can send signals to 3commas to initiate trades, adjust safety orders, and take profit at the designated percentages. This provides traders with a hands-off approach to trading, allowing them to focus on other areas of their portfolio or strategy while the DCA Detective | v1.0 strategy runs in the background.
So far, I haven't come across a good DCA strategy based on TA orders, so I created my own. I was troubled by my prolonged exposure to red bags, but with proper configuration, this strategy should get you out of the trade as soon as possible. I have managed to enter most of the good coins at an unbeatable average trade time and also eliminate the maximum trade time to less than 10 days !

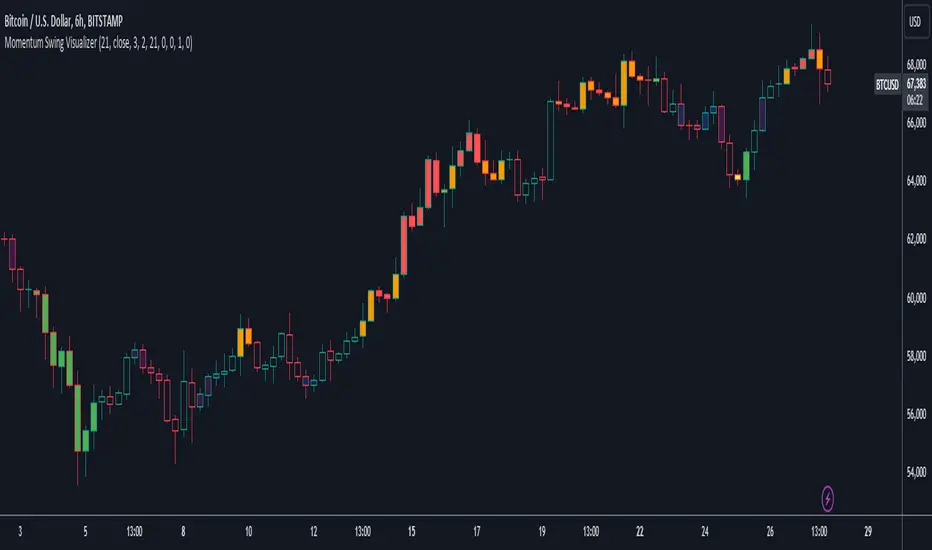
User Defined Momentum Change with Swing VisualsThis script is a groundbreaking, math-centric technical analysis tool that blends two well-established indicators, the Stochastic Oscillator and the Exponential Moving Average (EMA), to deliver a unique and visually engaging way of identifying momentum swings and stochastic indicators. Unlike mashups, this script is tailored to accommodate a wide range of trading strategies, providing traders with a distinctive perspective on market trends.
The innovation in this script lies in its mathematically-driven ability to effectively combine the Stochastic Oscillator and EMA, setting it apart from other available tools that simply offer a rehash of old ideas or slight modifications to popular indicators. The EMA is employed instead of a Simple Moving Average (SMA), enhancing the uniqueness of the calculations. This novel approach creates a new dimension for traders to evaluate potential momentum swings and visualize them on the chart, proving it to be more than just a mere mashup of existing indicators.
Central to the script's utility is its extensive customization options, which allow traders to adjust various inputs to suit their preferences and trading strategies. Users can modify the EMA length, swing range signal offsets, and smoothing factors for both the fast and slow components of the Stochastic Oscillator. Additionally, the script offers the ability to personalize the color thresholds, transparency, and line properties for the Stochastic Oscillator and swing range signal.
This script's visually dynamic representation of momentum swings empowers traders to make more informed trading decisions, particularly on the 6-hour timeframe. The swing range signal, represented by vertical lines on the chart, acts as a valuable visual aid for identifying potential entry or exit points. Furthermore, the Stochastic Oscillator provides insights into the strength and direction of momentum, which is beneficial for confirming potential trade signals.
To conclude, this script is not just another combination of MAs or a slightly modified version of a popular indicator. Instead, it offers traders a comprehensive, visually appealing, and customizable tool for technical analysis, which is both original and useful. By uniquely combining the EMA and the Stochastic Oscillator with a strong mathematical foundation, and allowing traders to adjust a variety of settings, this script adds value to the TradingView community and enhances the body of knowledge available for traders. It is designed to support traders in tailoring their analysis based on their own strategies and preferences, enabling them to make well-informed decisions in the financial markets.
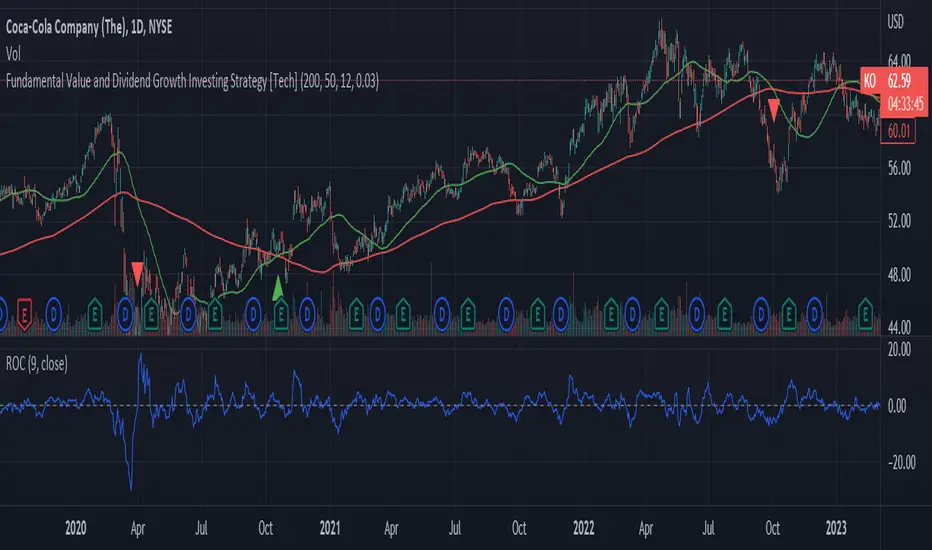
Fundamental Value and Dividend Growth InvestingThis script is an original implementation of a Fundamental Value and Dividend Growth Investing Strategy for traders who want to incorporate these concepts in their trading decisions. The script uses technical indicators to determine buy and sell signals based on a set of criteria.
To use the script, traders can input various parameters, such as the length of the simple moving averages (SMA), the rate of change (ROC) length, and the dividend yield. The script calculates the SMA for the long and short periods, the ROC, and the dividend.
The buy signal is triggered when the current closing price is greater than the short-term SMA, the short-term SMA crosses above the long-term SMA, the ROC is positive, and the closing price is greater than the dividend. The sell signal is triggered when the current closing price is less than the long-term SMA, the long-term SMA crosses above the short-term SMA, and the ROC is negative.
The script plots the signals and the indicators, such as the SMA200, the SMS50, the dividend, and the ROC. The script also includes alert conditions for the buy and sell signals.
The concept underlying the calculations of this script is the Fundamental Value and Dividend Growth Investing Strategy. This strategy aims to identify stocks that are trading below their intrinsic value and have a history of increasing dividends. The SMA and ROC indicators help identify the trends in the stock price, while the dividend yield helps identify stocks with a history of dividend growth.
Overall, this script offers traders an original and useful tool for incorporating Fundamental Value and Dividend Growth Investing Strategy into their trading decisions.
Stock Dissect DashboardI developed this script, to help me in my analysis process of Stocks.
In it I have combined several things that I look at when evaluating a company.
First, there is the Macro part, where I have added the most important (at least for me) macro indicators, such as inflation, interest rates, initial jobless claims etc.
Under the last is the latest reported value, next we have the previous, and next to them is the change.
Underneath it is the technical part.
I have added the 1-Week, 1-Month, 3-Month, and 1-Year returns. This way I can easily see the performance of the stock over time.
We have a market regime indicator, which tells us whether the stock is Trending, Mean-Reverting, or Neutral.
Also, I've added the RSI and 50 and 200 Day Moving Averages for additional analysis
At the bottom, I've included some of the fundamentals that I look at in my analysis process. We have the PE and PB ratio, as well as the debt-to-equity and profit margins.
I hope you guys like it and saves you as much time and energy as it did for me.
Happy trading!

The Weinstein MethodWhat is "The Weinstein Method" indicator?
Presentation of the indicator
The Weinstein Method indicator was developed by us to help traders use the Stan Weinstein Method more effectively. This method usually requires a lot of time and analysis to determine the different phases of an asset, but the indicator takes care of that in no time. By simply choosing the market and the timeframe, traders can get the different trends of the asset, the famous four phases of Stan Weinstein.
The basic principles of the indicator
The Weinstein Method indicator is based on the principles of the Stan Weinstein Method. According to this method, assets go through four phases: the accumulation phase, the rise phase, the distribution phase and the fall phase. Traders use these phases to determine when to buy, sell or stay out of the market.
How the indicator works
The indicator will take into account several elements to trigger the phases: the RSI, the volumes, the EMA, the Relative Strength of the asset (the choice of the market in the menu of the indicator is determining for this calculation) and the Supports/Resistances.
Depending on the Timeframe (several configurations: 1 hour, 4 hours, daily, weekly and monthly) and the market (Dow Jones - Stock, S&P 500 - Stock, Nasdaq - Stock, DAX - Stock, CAC 40 - Stock and Cryptos) selected, the variables mentioned above change to adapt to the asset and the timeframe.
Each phase has criteria that must be met in order to be triggered (those described by Stan Weinstein in his book "Secrets for Profiting in Bull and Bear Markets"):
- Phase 1: We have determined as criteria: low volume, RSI in the low zone, minimal price variation over the last X candles and the EMA without direction.
- Phase 2: We calculate the relative strength of the asset compared to its benchmark, above-average volumes, the break of a major resistance, the direction of the EMA and the level of the RSI.
- Phase 3: We look to see if the asset breaks its uptrend (break of a trend following EMA), if it fails to make a new high, if the RSI is in the high zone and if the volumes are strong.
- Phase 4: For this phase to be triggered, the asset must break a major support, be below the EMA (once again these variables are adapted according to the timeframe and the market selected in the menu) and the EMA must be bearish.
How to use
The signals of the indicator
On the chart, the indicator allows you to visualize the different phases of an asset's movement. Each point on the chart corresponds to a particular phase, which is labeled below the point with the name of the phase. The different phases that can be identified with the help of the indicator are the following:
- S1: Accumulation
- S2: Rising
- S3: Distribution
- S4: Decline
By observing the successive points, it’s possible to identify the market trend and to consider trading positions accordingly.
The different strategies for using the indicator
The market phase indicator can be used for both short term and long-term trading strategies. However, it should be noted that this method is generally used for the medium and long term.
In terms of trading strategies, investors can use the indicator to identify periods of trend reversal and take positions against the current trend. For example, if the indicator shows a distribution phase, this may indicate a downward trend reversal and a trader could take a sell position when the downward phase begins.
On the other hand, traders can also use the indicator to confirm the current trend and take positions in the direction of the trend. If the indicator shows an upward phase, this may indicate a continuing upward trend and a trader could take a buy position.
Disclaimer
Please note that The Weinstein Method indicator is a tool designed to assist traders in their decision-making process. While it is based on sound principles and can be helpful in identifying market trends, it is important to remember that there is no magic indicator that can guarantee success in trading.
It is the responsibility of the user to carefully consider all available information, including the signals generated by The Weinstein Method indicator, and to make their own informed decisions about when to buy, sell or stay out of the market. It is important to remember that trading carries risks, and no strategy or tool can eliminate those risks entirely.
We want to emphasize that we do not provide investment advice, and any decisions made using The Weinstein Method indicator are the sole responsibility of the user. We cannot be held liable for any losses that may occur as a result of trading using this indicator.

Big Bars DetectorIf a big bar with high volume appears during an uptrend, this may indicate strong buying pressure i.e. the bar acts as support. vice versa, if a big bar with high volume appears during a downtrend i.e. the bar acts as resistance.
How to use ?
It is easy to use whenever the label appears on the candle's high (make sure the candle's color is Red for a bear candle, for example). If a Green bar has a label on its low, simply use the candle's low as support, and vice versa. If the candle's high has a label, consider using it as resistance.
The values display in labels on the top / bottom of the bar is the volume on that particular candle
Hope you like and help in your trading !!!
if any have question / suggestion comment below or just message me.
Thanks and Regards,
TradingTail

Round Numbers Breakouts Smart Formula Signals and AlertsThis indicator uses Round Numbers breakouts and then uses smart formula with the near Round Numbers to determine best TP (take profit)/SL (stop loss) areas. Furthermore, it calculates win percentage, shows in-profit/in-loss peaks and the price amount result over a customizable date range, which when combined well with the smart formula provides decent profitable outcome. I have decided to write my own backtesting engine as the integrated TradingView strategy one has limitations and has shown inconsistencies when compared to manual backtesting…
There are many settings you can manually change to trade any instrument, any style, any approach and there are presets included for Bitcoin(BTCUSD), FOREX(EURUSD), SPY(S&P500), so you can start trading immediately! Alerts correspond to indicator settings and are turned on with a few clicks. There are 3 tables (each can be shown/hidden) showing everything you need to see/know to calibrate the indicator as you wish.
Labels, lines, tables explanations (everything can be hidden/shown):
- LONG Labels: medium-green: position open, dark-green: SL, bright-green: TP, blue: TP2
- SHORT Labels: medium-red: position open, dark-red: SL, bright-red: TP, purple: TP2
- Gray circles: position entry area | Yellow crosses: SL area
- Green line: Long TP1, Blue line: Long TP2 | Red Line: Short TP1, Purple line: Short TP2
- Grey lines: Round Numbers (customized via “Round Number up/down measure unit” input)
- Yellow labels at end of each week: end of week OVERALL total results
- Red colored background: power segment
- 3 tables: 1) INFO | STATS, 2) SPY Options Calculator, 3) Indicator Settings
If you decide to fully customize the indicator yourself, on the very top - under “PRESETS” select “MANUAL”! NOTE: If you select any of the pre-set presets, only GLOBAL settings can be changed, the rest of the settings will be “frozen” until you switch it to “MANUAL”!
- Global Settings are self-explanatory and mainly observational, show/hide, etc.
- Manual TP2 (Multi-Take-Profit) Settings:
>>>>> Include TP2 System? Turn on/off multi-profit system, with this unchecked, every trade will either end with SL or with TP1.
>>>>> TP2 System: NEAREST/FORMULA, NEAREST – after TP1 is taken > next TP2 will be a round number price target nearest to where TP1 was taken (sometimes it can be very near, sometimes further away…), FORMULA – 2nd round number price target will be optimally selected based on the distance behind and ahead of TP1 area. For TP2 – FORMULA would be the most logical choice as with multi-take-profit setting turned on – you’d want to ride it out as far as possible.
>>>>> TP1/TP2 division type: 1) Each price target (TP1, TP2) will be ½ of the position 2) TP1 will be 2/3 of the position and TP2 will be the remaining 1/3.
>>>>> TP2 hit type: “close” > candle has to close on top/crossing the price target line, “touch” > once candle touches the price target – you will be immediately alerted to take the partial profit (if you will use such setting – you will need to take the partial profits as soon as you receive the alert.
>>>>> TP1 > Back to Entry hit type: similar to TP2, “close” > candle close, “touch” > candle touch. Please note: this is a very tricky setting as if you use “close” option – your profitable trade may become a loss if a huge candle will close against your position eliminating your TP1 profit, however often the price will touch and cross the entry area to only bounce and continue with your position direction for even bigger profits… so experiment with the date range results to see what works best for your instrument/setting/strategy.
>>>>> TP2 count towards trades count: this can be a bit confusing, but it is simply how should TP2 be treated towards trades count. The indicator will show you Win Percentage and Win % is obtained from winning trades count divided by total trades count. While TP2 is not “a new trade”, it expands the profit of the trade. This is an experimental setting to count TP2 as the whole winning trade, ½ of a trade, or not count it at all.
- Manual Signals/TP1 Settings:
>>>>> TP1/TP2 offset: this one is really cool, with this feature you can hunt these conditions when the price comes very near the profit target area, but never touches it. With this setting turned on and with a good offset amount – you will be able to catch these for TP1 and TP2!
>>>>> TP1/TP2 offset amount: just what the title says, please be careful with this as this number varies significantly depending on the instrument you will be trading. Examples: 1) For SPY 0.1 would be $0.10 offset - if TP1 is $400 and price hits $399.90 > TP1 considered taken/signal shown/alert) | 2) For EURUSD, it is very different and if wrong will show TP1 immediately at position open, typical good offset for EURUSD is: 0.0005 | 3) For BTCUSD, 10 - $10 offset, if TP is $15,000 > $14,990, etc.
>>>>> Round Number up/down measure unit (in dollars $): this one is very important if you will be using “MANUAL” selection to build your own setup as it is very different for every instrument. For SPY, round numbers are single dollars or even half-dollar 50 cent numbers: 1 or 0.5 (350, 351, 352, etc. or 350.50, 351, 351.50, 352, etc.), while for Bitcoin (BTCUSD) a single unit ($1) is too small to be a round number as Bitoin moves much faster and wider every second and it would have to be at least 50 ($50) to make sense. Similar for FOREX (EUR/USD) a single 1 unit ($1) will be too big as EURUSD will never move a whole $1 in 15 minutes or even a day.. and would have to be something like 1.05500. You can easily determine if this number makes sense for your instrument by observing the grey Round Number lines which will correspond based on this setting. You can also visually observer if the price of the instrument appreciates these round numbers.
>>>>> Close Position Before Market Closes: just what the title says. Indicator will close the position 15 minutes before market closes (US session), update backtesting stats, alert you.
>>>>> Close Position Before Power Hour: 3PM – 4PM ET is the last hour of US trading session, where sudden move in any direction can happen with huge volatility, while sometimes nothing will happen at all… Many try to avoid it, so if you wish to avoid it as well - turn this on and it will alert you to close your positions 15 minutes before Power Hour starts, backtesting/stats will be adjusted accordingly.
>>>>> Skip OVERSIZED candles in signals: turn on this setting to skip signals, which happen to fall on big candles. This is basically a protection from huge volatility moves, which usually happen during financial news/events and if you are not a fan of these – you can set this option for indicator to not open anything based on the candle size.
>>>>> Color OVERSIZED candles: this will help you calibrate the size of the OVERSIZED candles if you decide to use this setting and overall visually see them.
>>>>> OVERSIZED candle size: OVERSIZED candle size must be input as it varies significantly. Please note: for each instrument – the size number is completely different, as for SPY: 2 would mean any candle bigger than $2 distance will be considered OVERSIZED, for Bitcoin it would have to be several hundred dollars, like 400-500. For FOREX, this would have to be a decimal, for EURUSD something like 0.0005. It’s best to experiment visually with this setting depending on the instrument you will be trading while setting up the size. To see a typical huge unusual candle – look up financial calendar for something like FOMC meeting, then measure the candle input it into this setting.
>>>>> OVERSIZED candle size calculation type: this is just more flexibility for your preference. If you wish to calculate the size of the candle based on the open/close – select “BODY”, if you wish to use high/low – select “STICKS (from tip to tip)”. Hard to say which one is better, so it is up to you to decide.
>>>>> Include EMA in signal formula: LONG signals will only be shown only if above EMA, SHORT if below EMA. EMA length is of course customizable in below.
>>>>> Skip opposite candle types in signals: signals where the candle color confirms the direction of the trade, but the candle type is opposite (like a green colored bearish hammer for example) will be avoided (such candles can be very uncertain/deceptive).
>>>>> Skip doji: signals where the signal candle is doji (uncertain) will be avoided.
>>>>> TP1 hit type/system: same thing as TP2 hit type/system.
>>>>> SL hit type/system: same as TP1 and TP2 types/systems.
>>>>> Intraday Session Signals Active Time in ET: time range during the day when indicator will show signals (open trades, alert you, etc.). This is specifically for intraday trading. You can turn it off completely by selecting a BLANK option.
>>>>> Intraday TP/SL Active Time in ET: same as above, but for taking profits/stop losses.
*** To add the alerts
-Right-click anywhere on the TradingView chart
-Click on Add alert
-Condition: Select this indicator by it’s name
-Alert name: Whatever you want
-Hit “Create”
-Note: If you change ANY Settings within the indicator – you must DELETE the current alert and create a new one per steps above, otherwise it will continue triggering alerts per old Settings!
If you wish to try this out for a week or so – please write me directly and I will give you access.

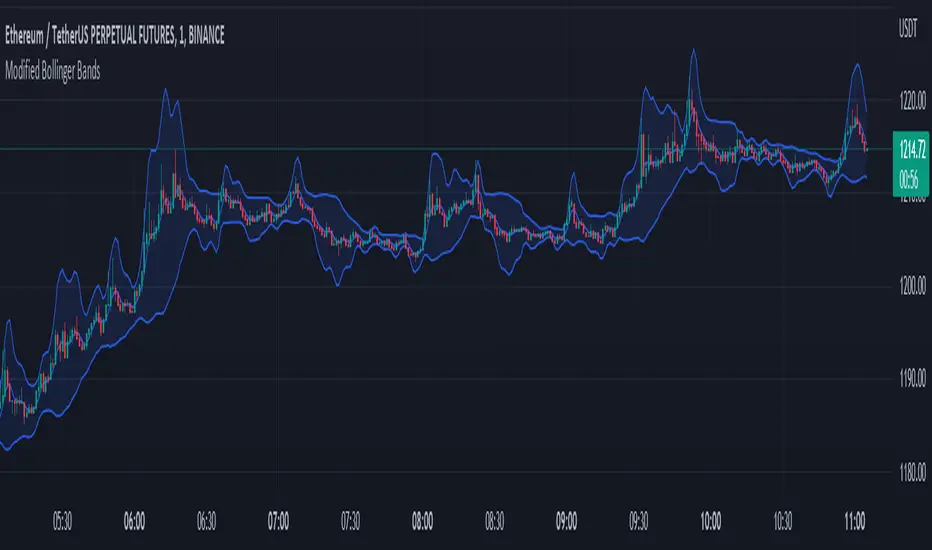
Modified Bollinger BandsThis script has been distributed for learning purposes.
A particular kind of price envelope is "Bollinger Bands" indicator. Upper and lower price range levels are determined by price envelopes. By default, Bollinger Bands are plotted in Tradingview as envelopes at a standard deviation level above and below the price's simple moving average (SMA). I attempted to modify the indicator in this version by adding several kinds of moving averages first. The key feature is that standard deviation should be modified. in Tradingview, SMA calculates the standard deviation. The allocated moving average should be used to calculate the std function when the base line is changed.
Crypto Tipster v2---------------------
Crypto Tipster v2
Hello again! We're back with a drastically improved Crypto Tipster v2 Indicator using over a dozen all new algorithms based around Technical Analysis, Price Action, Momentum Swings and Reversal Detection.
We've taken our time with version 2 of Crypto Tipster, putting all our best practices to work and ensuring it performs superbly across numerous crypto markets and timeframes - we have focused our efforts towards the larger timeframes, 12H, 1D, 2D for example as we believe these to be the most consistent and predictable, and therefore the most profitable.
Trading on longer timeframes also reduces the overal cost of trading fee's as you'll be placing fewer trades over any given time period, whilst catching bigger swings and therefore earning a higher percentage per winning trade. Due to these bigger price swings you can de-leverage your trades too, making them inherintly safer and more controlled.
The final benefit to placing trades on longer timeframes is that you will not be tied down to your PC or laptop for hours on end waiting for a perfect entry or exit point, which increases the odds of placing bad/panic trades or even placing trades due to boredom! If you trade with Crypto Tipster v2 on a 1D timeframe, you will only ever have work to do once per day, at bar close; this is when trades are placed or exited, or stop losses/take profits are updated to new levels - easy!
Crypto Tipster v2 can help consistently catch tops and bottoms of trending markets whilst avoiding placing trades through choppy or ranging areas, this helps to not only maximise profits (what we're all after!) but also to minimise losses (equally important). We've tirelessly tested Crypto Tipster using literally thousands of variables across dozens of built-in algorithms over hundreds of trading pairs - lots of data to process!
The outcome is rather stunning and well worth checking out - we're rather proud of what we've achieved here, and we're pretty sure you're going to love it too!
---------------------
What's Included
- Chart Settings
The first section you'll come across, Chart Settings.
Here you'll find a few options regarding how your chosen market chart will look within TradingView and how Crypto Tipster will interact with this chart.
One of the most important Tick boxes is first on the list - "Show Backtest Results". This will change Crypto Tipster from displaying simple but easy-to-follow "Buy/Sell" labels into Strategy mode in which you can set up more complicated Stop Loss / Take profit settings as well as setting up Alerts for auto trading and other more complex functions (see How It Works for more info!
We've also included a "Trend Strength Bar Color" tick box which changes the color of the chart bars based on how strong Crypto Tipster is perceiving the current trend and in which direction.
- Trend Settings
"Trading Frequency" represents how often Crypto Tipster will be looking for a new trend / change in trend direction, and therefore how often it will be placing trades. By default this is set to "Normal" but can be changed to "Rapid" using the drop down menu.
"Entry Trend Strength" also determines how frequently trades are placed by selecting the strength of trend required before a trade is placed. The scale ranges from "1-5", with 1 being a low trend strength required, 5 being a very strong trend strength required.
Within the Trend Settings section you'll also find an "Avg Trend Strength over Bars" option. This allows you to average (mean) the current trend strength over a pre-determined amount (1-5) of previous chart bars - thus providing a potentially more consistent signal.
- Trade Settings
Trade Settings help Crypto Tipster determine what type of trades you're looking to place.
The overall "Trade Direction" will decide to either target only Long trades, only Short trades, or Both (default).
"Consecutive Trades in Same Direction" allows for pyramiding - whereby you can specify to allow for multiple trades of the same direction. Set to "1" as default allows for no extra pyramiding, max setting of "10".
- Trade Protection
Currently consisting of two functions, our Trade Protection section can help to achieve both the removal of false signals (whipsaws), and the extension of good trades without confusion during minor retracements.
"Chop Removal" can help to remove some whipsaw trades during ranging market conditions, therefore improving overal profitability by only targeting stronger trends. You have an option to choose from either "Weak" or "Strong" Chop Removal.
"Protection Filter" uses current trading criteria as defined by you, and uses it to check against a higher time frame than you're currently viewing. This can help to eliminate some bad trades at the expense of a potential lag on good trades.
- Stop Loss / Take Profit
Stop Losses should be a crucial aspect of everyone's trading system. They help prevent any trade from going too far in the wrong direction and limit losses.
Our "Stop Loss (%)" is quick and easy to set up, simply set the percentage offset from the entry price of trades and a fixed Stop Loss will be in place on all trades.
"Take Profit (%)" works in the same way as the Stop Loss mentioned above - simply set the percentage you'd like to exit a profitable trade at.
The "Trailing Stop (%)" is a little more complicated in that it will follow the trend of the trade a certain percentage away from the current market price - this is great for keeping yourself in a trade for as long as the trade is moving in the right direction.
- Extra Tools & Indicators
This is the section of Crypto Tipster that enables you to add some chart visuals to assist you with your preferred trading style.
"Potential Pivot Points" are not the same as actual pivot points - Potential pivot points will paint on the chart at bar close, giving you an immediate alert to potential tops/bottoms of market trends. You can choose to display only the strongest potential points, or include some of the weaker signals too.
"Actual Pivot Points" are inherintly more accurate than Potential pivot points, but do not paint on the chart until after a pre-determined amount of time has passed. These are great for placing stop losses/take profits or watching the market for breakouts or reversals.
"Support/Resistance Levels" plots up to 6 support and resistance horizontal lines based on recent price tops/bottoms. Use these to determine areas where price could rebound or break-through.
"Bollinger Band Breakout" - Bollinger bands are a tried and tested technical analysis tool, similar to pivot points and support/resistance lines, thee are another great tool to determine where price may retrace, consolidate or breakout.
- Ichimoku Cloud
Somewhat confusing and intimidating when you first come across this technical analysis indicator, the "Ichimoku Cloud" is one of our favorites. Assisting with the detection of Dynamic Support and Resistance levels, Momentum and Trend Direction all in one super indicator.
Although certain aspects of the Ichimoku Cloud are already present within Crypto Tipster v2 algorithms in order to offer you the best possible signals, we've also included a user-definable section of it's own so you can manually set up and use the cloud for your own trading needs, all cloud signals (and there are many) are available to set up as Alerts for your own needs or an Auto-Trading Bot.
- Custom Alerts for Any Signal
We've endeavoured to ensure that all signals, not just the Buy/Sell signals, are ready and available to create Alerts with; giving you the most opportunity to create a fully custom trading engine that suits your exact trading requirements.
This means you can set Alerts for any and all signals you can see on the chart when using Crypto Tipster v2, this includes Buy/Sell Signals, Trend Strength Signals, Choppy Market Signals, Stop Loss/Take Profit Signals, Pivot Points, S/R levels crossed above & below, Bollinger Band Breakout and several Ichimoku Cloud Signals.. the list goes on!
---------------------
We've tried to make Crypto Tipster as comprehensive and easy to understand as possible, we are however always in search of progression; we do really love to hear your feedback :)
For more information and a free 8-day trial please visit the link in our signature
Happy Trading Guys

FluidTrades - SMC Lite
Price action and supply and demand is a key strategy use in trading. We wanted it to be easy and efficient for user to identify these zones, so the user can focus less on marking up charts and focus more on executing trades.
This indicator shows you supply and demand zones by using pivot points to show you the recent highs and the recent lows.
Features
This indicator includes some features relevant to SMC , these are highlighted below:
Full internal & swing market structure labeling in real-time
Swing Structure: Displays the swing structure labels & solid lines on the chart (BOS).
Supply & demand ( bullish & bearish )
Swing Points: Displays swing points labels on chart such as HH, HL, LH, LL.
Options to style the indicator to more easily display these concepts
White OB (supply): search for short opportunities
Blue OB (demand): search for long opportunities
Break of structure ( BOS )
For markets to move up and down a break in market structure must occur. A break in market structure occurs when the market begins to shift direction and break the previous HH and HL or HL and LL of the market. We also integrated the feature that you can see the BOS lines. In the indicator settings you can adjust the color of the label.
Settings
SwingHigh/Low Length: Allows the user to select Historical (default) or Present, which displays only recent data on the chart.
Supply/demand box width: Allows user to change the size of the supply and demand box
History to keep: allows the user to select how many most recent supply & demand box appear on the chart.
Visual settings
Show zig zag : allow user to see market patters within the market
Show price action labels: allow user to turn on/off the (swing points)
Supply box color : allow users to change the color of their supply box
Demand box color : allow users to change the color of their supply box
Bos label color : allow users to change the color of their BOS label
Poi label color : allow user to change the color of their POI label
Price action label : allow users to change the color of their swing points labels
Zig zag color : allow users to change the color of the zig/zag market patters
Warning
Never blindly take a trade on a supply/demand box - wait for a proper market structure to occur before considering a trade.

Trend Follower Intraday [ Adjustable TF ]Trend Follower Intraday for 3 minute Time-Frame (Adjustable) , that has the time condition for Indian Markets as well.
Unlike the Free Scripts - Risk Management , Position Sizing , Partial Exit etc. are also included .
Send us a Message to know more about the strategy.
// ══════════════════════════════════════════════════════════════════════════ //
The Timing can be changed to fit other markets, scroll down to "TIME CONDITION" to know more.
The commission is also included in the strategy .
The basic idea is when ,
1) EMA1 crosses above EMA2 , is a Long condition .
2) EMA1 crosses below EMA2 , is a Short condition .
3) Green Section indicates Long position.
4) Red Section indicates Short position.
5) Allowed hours specifies the trade entry timing.
6) ATR STOP is the stop-loss value on chart , can be adjusted in INPUTS.
7) Target 1 is the 1st target value on chart , can be adjusted in INPUTS.
8) RISK is Maximum Risk per trade for the intraday trade can be changed .
9) Total Capital used can be adjusted under INPUTS.
10) ATR TRAIL is used for trailing after entry, as mentioned in the inputs below.
11) Check trades under the list of trades .
12) Trade only in liquid stocks .
13) Risk only 1-5% of total capital.
14) Inputs can be changed for better back-test results, but also manually check the trades before setting alerts
15) SQUARE OFF TIME - As you change the time frame , also change the square-off time to the candle's closing time.
Eg: For 3min Time-frame , Hour = 2Hrs | Minute = 57min
16) Strategy stops for the day if you have a loss .
17) COMMISSION value is set to 20Rs and SLIPPAGE value is set to 2 . Go to properties to change it .
*The input values and the results are mentioned under "BACKTEST RESULTS" below*
// ══════════════════════════════ //
// ————————> RISK MANAGEMENT <——————— //
// ══════════════════════════════ //
Risk management is done based on max loss per trade and can be adjusted in the INPUTS.
// ═══════════════════════════ //
// ————————> POSITION SIZE <——————— //
// ═══════════════════════════ //
Quantity of each trade is different based on the loss
// ═════════════════════════ //
// ————————> PROPERTIES <——————— //
// ═════════════════════════ //
COMMISSION , SLIPPAGE ,RECALCULATE is already mentioned in the code.
COMMISSION can be charges , based on the broker charges.
// ═══════════════════════════════//
// ————————> TIME CONDITION <————————— //
// ═══════════════════════════════//
The time can be changed in the INPUT.
The Indian Markets open at 9:15am and closes at 3:30pm.
The 'Allowed hours' under Inputs specifies the time at which Entries should happen .
"Close All" function closes all the trades before 3pm , at the open of the next candle.
To change the time to close all trades , check INPUT.
All open trades get closed by 3pm , because some brokers don't allow you to place fresh intraday orders after 3pm .
// ═══════════════════════════════════════════════ //
// ————————> BACKTEST RESULTS ( 123 CLOSED TRADES ) <————————— //
// ═══════════════════════════════════════════════ //
INPUTS can be changed for better Back-Test results.
The strategy applied to NSE:JSWENERGY (3 min Time-Frame and with a capital of 3,00,000 ) gives us 81% profitability , as shown below
It was tested for a period a 6 months with a Profit Factor of 1.957 ,net Profit of 43,000Rs .
Sharpe Ratio = 0.745
Sortino Ratio = 2.091
No strategy in the world promises 100% profits in all market conditions , so always define your risk before trading.
Also check Back-Test results manually ,before setting Alerts
The Graph has a Linear Curve with Consistent Profits.
The INPUTS are as follows,
1) EMA1 ————————————————> 38
2) EMA2 ————————————————> 118
3) ALLOWED HRS ———————————> 9:35 TO 14:30
4) ATR STOP ——————————————> 3.2
5) RISK ——————————————————> 3000
6) ATR TRAIL ———————————————> 2.6
7) TARGET 1 ————————————————> 2.4
8) MAX POSITION VALUE ——————————> 3,00,000
8) MAX DRAWDOWN —————————————> 9,000
8) SQUARE-OFF ————————————————> 14:57
NSE:JSWENERGY
Apply it to your charts Now !
NSE:JSWENERGY
Send us a message for FREE TRIALS | Instant Access
Thank You ☺

CONSOLIDATION BAND BREAKOUT [5MIN TF]CONSOLIDTION BREAKOUT STRATEGY for 5 minute Time-Frame , that has the time condition adjustable for Indian Markets.
// ══════════════════════════════════════════════════════════════════════════ //
Unlike the Free Scripts - Risk Management , Position Sizing , Partial Exit etc. are also included .
Message to know more about the strategy.
// ══════════════════════════════════════════════════════════════════════════ //
The Timing can be changed to fit other markets, scroll down to "TIME CONDITION" to know more.
The commission is also included in the strategy .
The basic idea is when ,
1) Price crosses above upper Level ,indicated by Red Line, is a Long condition .
2) Price crosses below lower Level ,indicated by Green Line , is a Short condition .
3) Candle close crosses above ema1 , is a part of the Long condition .
4) Candle close crosses below ema1 , is a part of the Short condition .
5) Allowed hours specifies the trade entry timing.
6) ATR STOP is the stop-loss value on chart , can be adjusted in INPUTS.
7) Target 1 is the 1st target value on chart , can be adjusted in INPUTS.
8) RISK is Maximum Risk per trade for the intraday trade can be changed .
9) Total Capital used can be adjusted under INPUTS.
10) ATR TRAIL is used for trailing after entry, as mentioned in the inputs below.
11) Check trades under the list of trades .
12) Trade only in liquid stocks .
13) Risk only 1-5% of total capital.
14) Inputs can be changed for better back-test results, but also manually check the trades before setting alerts
15) SQUARE OFF TIME - As you change the time frame , also change the square-off time to that candle's closing time.
Eg: For 3min Time-frame , Hour = 2Hrs | Minute = 57min
16) Strategy stops for the day if you have a loss .
*The input values and the results are mentioned under "BACKTEST RESULTS" below*
// ══════════════════════════════ //
// ————————> RISK MANAGEMENT <——————— //
// ══════════════════════════════ //
Risk management is done based on max loss per trade and can be adjusted in the INPUTS.
// ═══════════════════════════ //
// ————————> POSITION SIZE <——————— //
// ═══════════════════════════ //
Quantity of each trade is different based on the loss
// ═════════════════════════ //
// ————————> PROPERTIES <——————— //
// ═════════════════════════ //
COMMISSION , SLIPPAGE ,RECALCULATE is already mentioned .
COMMISSION can be charges , based on the broker charges.
// ═══════════════════════════════//
// ————————> TIME CONDITION <————————— //
// ═══════════════════════════════//
The time can be changed in the INPUT.
The Indian Markets open at 9:15am and closes at 3:30pm.
The 'Allowed hours' under Inputs specifies the time at which Entries should happen .
"Close All" function closes all the trades before 3pm , at the open of the next candle.
To change the time to close all trades , check INPUT.
All open trades get closed at 3pm , because some brokers don't allow you to place fresh intraday orders after 3pm .
// ═══════════════════════════════════════════════ //
// ————————> BACKTEST RESULTS ( 123 CLOSED TRADES )<————————— //
// ═══════════════════════════════════════════════ //
INPUTS can be changed for better Back-Test results.
The strategy applied to NSE:TCS (5 min Time-Frame and with a capital of 1,00,000 ) gives us 77% profitability , as shown below
It was tested for a period a 1 year with a Profit Factor of 2.143 ,net Profit of 10,886 Rs .
The Initial Capital and Risk can be increased for better results.
The graph has a Linear Curve with Consistent Profits.
The INPUTS are as follows,
1) LENGTH ——————————————> 79
2) MUT_STDEV ————————————> 2.3
3) ALLOWED HRS ———————————> 9:25 TO 14:30
4) ATR STOP ——————————————> 2.2
5) RISK ——————————————————> 400
6) ATR TRAIL ———————————————> 2.6
7) TARGET 1 ————————————————> 2.1
8) MAX POSITION VALUE ——————————> 1,00,000
8) MAX DRAWDOWN —————————————> 2,000
8) SQUARE-OFF ————————————————> 14:55
NSE:TCS
Apply it to your charts Now !!
Send us a message to know more about this strategy
Thank You ☺ NSE:TCS

Big Money Flow & Drift Oscillator [Spiritualhealer117]An easy way to track what big money and market makers are doing in the markets. The Big Money Flow & Drift Oscillator is best suited as a trend indicator, estimating what way the market will drift on low volume and what way it will move on large volume.
This oscillator is composed of two lines, the Big Money Flow and Drift Oscillator. The Big Money Flow line gives the average percentage return of the asset when the volume is greater than the EMA of volume, showing that big money is making moves in the market. The Drift Oscillator gives the average percentage return of the asset when the volume is less than the EMA of volume, where pricing is done by small money and market makers.
By default, between the two lines, there is a color fill, determined based on the following logic:
BMF > drift and BMF > 0: Yellow
drift > BMF and drift > 0: Beige
BMF > drift and BMF < 0: Orange
drift > BMF and drift < 0: Red

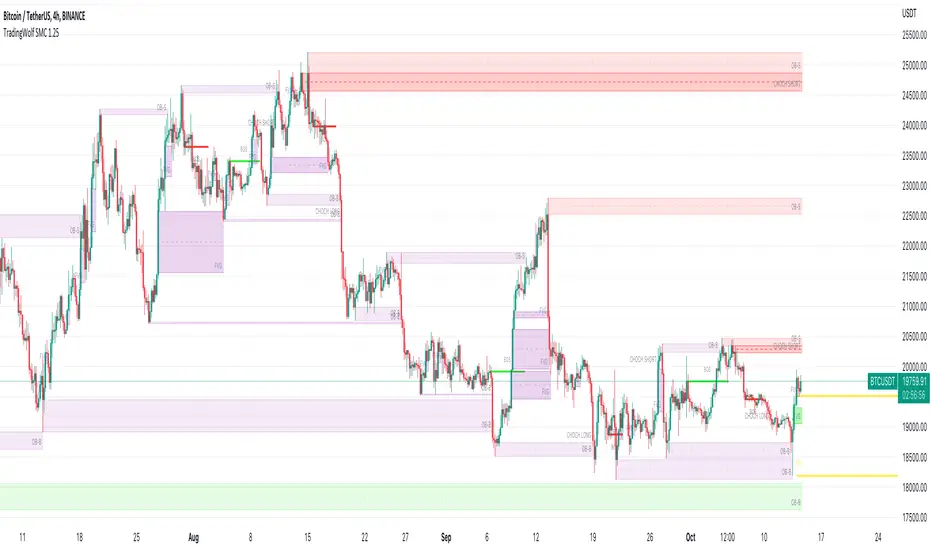
TradingWolf Smart Money
The TradingWolf Premium Smart Money Concept is a unique and enhanced selection of ideas designed to help give you an edge on the markets.
Within this one indicator you will have access to Fair Value Gap, Order Blocks, Break of Structure, Forecasting, Supply & Demand.
Below find each explanations on how to use each indicator
This script comes with the 'TradingWolf Premium' to get access, read the Author’s Instructions below.
There are extensive explanations on how to use this in our documentation on the website but we will give a simple overview here.
Order Blocks
There are several different ways people like to calculate order blocks, one of the ways we like is by using pivot points to identify levels of importance, from there we either highlight the highest/lowest closed candle or the wick. The user has the option to choose this in the settings.
As seen in the image above, you can see these levels are well respected and give people an opportunity to help where the market marker is placing their orders.
Fair Value Gaps
Fair value gaps can be a very useful concept in price action trading. They detect instances in which there are inefficiencies, or imbalances, in the market. In this case, we define imbalance as an instance in which buying and selling is not equal. This is often visualised as a large candle whose neighbouring candles’ wicks do not fully overlap the large candle. Below are a few examples of Fair Value Gap.
If price is in a downtrend and there is a fair value gap above, a trader might look to go short when that FVG fills. Inversely, if price is in an uptrend and there is a FVG below, a trader might look to go long when the FVG fills.
In this script we decided to highlight both types, one is simply marking up all technical FVGs which is the gap produced by the large candle, the other more commonly traded ones are market structure breaking ones.
These ones tend to be more respected so note they are highlighted in a separate colour to make them more visible.
If a FVG has been filled that box will dim away so it's not in your way.
ChoCh
‘Change of Character’ Hugely used by professional traders although they may not have heard of it called by this term. This is where price/market structure is trending in a certain direction but price starts to reverse.
This first happens when there is a break of structure, instead of another Lower High formed, price makes a Higher High like in the image above. This is where we highlight a break of structure or some people will just refer to this as the Choch line, once we have this we can look for an Order block / supply zone below to find an entry.
This is a hugely powerful tool dating back to one of the simplest and first concepts of trading where Market structure is King.
Peaks & Troughs
This tool helps you find potential reversal points in your support/resistance area, Simple candlestick patterns but incredibly powerful when used in confluence with our other tools.
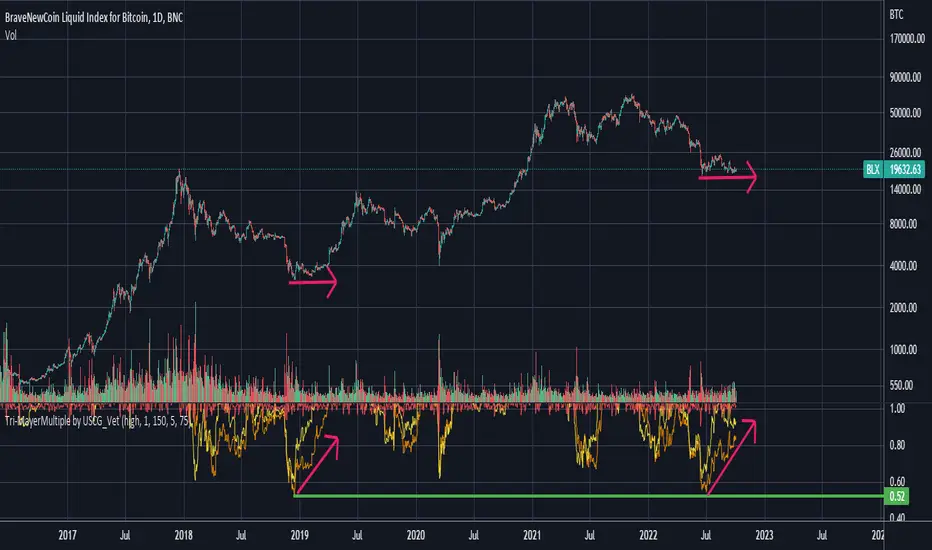
Tri-MayerMultiple by USCG_VetThe Mayer Multiple was created by Trace Mayer as a way to analyze the price of an asset in a historical context.
The Mayer Multiple is the multiple of the current price over some x-day moving average.
I preferred to display multiple average lines as they can help with identifying divergences.
PIVOT STRATEGY [INDIAN MARKET TIMING]
A Back-tested Profitable Strategy for Free!!
A PIVOT INTRADAY STRATEGY for 5 minute Time-Frame , that also explains the time condition for Indian Markets
The Timing can be changed to fit other markets, scroll down to "TIME CONDITION" to know more.
The commission is also included in the strategy .
The basic idea is when ,
1) Price crosses above ema1 ,indicated by pivot highest line in green color .
2) Price crosses below ema1 ,indicated by pivot lowest line in red color .
3) Candle high crosses above pivot highest , is the Long condition .
4) Candle low crosses below pivot lowest , is the Short condition .
5) Maximum Risk per trade for the intraday trade can be changed .
6) Default_qty_size is set to 60 contracts , which can be changed under settings → properties → order size .
7) ATR is used for trailing after entry, as mentioned in the inputs below.
// ═════════════════════════//
// ————————> INPUTS <————————— //
// ═════════════════════════//
Leftbars —————> Length of pivot highs and lows
Rightbars —————> Length of pivot highs and lows
Price Cross Ema —————> Added condition
ATR LONG —————> ATR stoploss trail for Long positions
ATR SHORT —————> ATR stoploss trail for Short positions
RISK —————> Maximum Risk per trade for the day
The strategy was back-tested on RELIANCE ,the input values and the results are mentioned under "BACKTEST RESULTS" below .
// ═════════════════════════ //
// ————————> PROPERTIES<——————— //
// ═════════════════════════ //
Default_qty_size ————> 60 contracts , which can be changed under settings
↓
properties
↓
order size
// ═══════════════════════════════//
// ————————> TIME CONDITION <————————— //
// ═══════════════════════════════//
The time can be changed in the script , Add it → click on ' { } ' → Pine editor→ making it a copy [right top corner} → Edit the line 25 .
The Indian Markets open at 9:15am and closes at 3:30pm .
The 'time_cond' specifies the time at which Entries should happen .
"Close All" function closes all the trades at 3pm, at the open of the next candle.
To change the time to close all trades , Go to Pine Editor → Edit the line 103 .
All open trades get closed at 3pm , because some brokers don't allow you to place fresh intraday orders after 3pm .
NSE:RELIANCE
// ═══════════════════════════════════════════════ //
// ————————> BACKTEST RESULTS ( 128 CLOSED TRADES )<————————— //
// ═══════════════════════════════════════════════ //
INPUTS can be changed for better back-test results.
The strategy applied to NIFTY ( 5 min Time-Frame and contract size 60 ) gives us 60% profitability y , as shown below
It was tested for a period a 6 months with a Profit Factor of 1.45 ,net Profit of 21,500Rs profit .
Sharpe Ratio : 0.311
Sortino Ratio : 0.727
The graph has a Linear Curve with consistent profits .
The INPUTS are as follows,
1) Leftbars ————————> 3
2) Rightbars ————————> 5
3) Price Cross Ema ——————> 150
4) ATR LONG ————————> 2.7
5) ATR SHORT ———————> 2.9
6) RISK —————————> 2500
7) Default qty size ——————> 60
NSE:RELIANCE
Save it to favorites.
Apply it to your charts Now !!
↓
FOLLOW US FOR MORE !
Thank me later ;)

Stock Tech Bot One ViewTechnical indicators are not limited. Hence, here is another indicator with the combination of OBV, RSI, and MACD along with support, and resistance that follows the price while honoring the moving average of 200, 90 & 50.
The default lookback period of this indicator is 21 though it is changeable as per the user's desire.
The highest high and lowest low for the last 21 days lookback period proven to be the perfect Support & Resistance as the price of particular stock values are decided by market psychology. The support and resistance lines are very important to understand the market psychology which is very well proven with price action patterns and the lines are drawn based on,
Lower Extreme = 0.1 (Changeable)
Maximum Range = 21 days highest high - 21 days lowest low.
Support Line = 21 days lowest low + (Maximum Range * Lower Extreme)
Resistance Line = 21 days highest high - (Maximum Range * Lower Extreme)
RSI - Relative strength indicator is very famous to find the market momentum within the range of 0 - 100. Though the lookback period is changeable, the 14 days lookback period is the perfect match as the momentum of market movement for the last 3 weeks will always assist to identify the market regime. Here the momentum is just to highlight the indication (green up arrow under the candle for long and red down arrow above the candle for short) of market movement though it is not very important to consider if the price of the stock respect the support & resistance lines along with volume indicator (* = violet color).
OBV - Momentum:
The on-balance volume is always going indicator on any kind of tickers, which helps to identify the buying interest. Now, applying momentum on OBV with the positive movement for at least two consecutive days gives perfect confirmation for entry. A combination of the price along with this momentum(OBV) in the chart will help us to know the whipsaw in the price.
The Symbol "*" on top of each bar shows the market interest in that particular stock. If your ticker is fundamentally strong then you can see this "*" even when the market falls.
MACD:
One of the favorites and simple indicators widely used, where the thump of the rule is not to change the length even if it is allowed. It's OK to believe blindly in certain indicator and consider it while trading. That's why the indicator changes the bar color by following the MACD histogram.
Volume:
It may be the OBV works based on the open price and close price along with volume movement, it is wise to have the volume that is plotted along with price movement that should help you to decide whether the market is greedy or fearful.
The symbol "-" on top of each bar tells you a lot and don't ignore it.
Moving Average:
Moving average is a very good trend indicator as everyone considers seeing along with the price in the chart which is not omitted while we gauge the price movement alone with volume in this indicator. The 200, 90 & 50 MA's are everyone's favorite, and the same is plotted on the chart.
As explained above, the combination of all four indicators with price movement will give us very good confidence to take entry.
Candlestick Pattern:
You should admire the techniques of the candlestick pattern as you navigate the chart from right to left. Though there are a lot of patterns that exist, it is easy to enable and disable to view the signal as the label.
Further, last but not least, the exit always depends on individual conviction and how often the individual watch the price movement, if your conviction is strong then follow the down arrow red indication. If not, then exit with a trailing stop that indicates the bar with orange color.
Happy investing
Note: It is just a combination of multiple indicators and patterns to get one holistic view. So, the credit goes to all wise developers who publically published.

[B_2] 15min Crypto (Based on Technical Analysis)Republish.
HOW IT WORKS:
+ Open Long: When price close above Kumo Cloud 15m, SuperTrend 15m, RSI > 50, MACD signal (12,26,19) >0, break up Pivot High previous. Dont open long when price close just below resistants in higher timeframe (SuperTrend 2H, 4H).
+ Exit Long: When price hit TPs or SL or having Short Signals.
+ Open Short: When price close below Kumo Cloud 15m, SuperTrend 15m, RSI < 50, MACD signal (12,26,19) <0, break down Pivot Low previous.
+ Exit Short: When price hit TPs or SL or having Long Signals.
HOW TO DO IT:
Very easy to use this script. It only has 2 parts: SETUP ENTRY and SETUP EXIT.
1. SETUP ENTRY:
This strategy uses the rule of dividing capital to enter multiple orders. For example, a common rule 5-3-2 (ie: total capital is 100%, entry 1 is 50%, entry 2 is 30% and entry 3 is 20%). In this strategy, I split my capital into 4 entries. You can customize the capital percentage and price deviation for each entry.
2. SETUP EXIT:
+ Multi profit.
+ Stoploss: you have two options: Stoploss based on percentage or ATR.
+ When price hit TP1, you have two options: only move Stoploss to entry or active trailing.
BACKTEST: You can backtest this strategy on coins: ETH, CRV , RUNE, MATIC, SRM and some like: MKRUSDTPERP , AAVEUSDTPERP , SOLUSDTPERP , ETCUSDTPERP , FILUSDTPERP , BALUSDTPERP , NEARUSDTPERP , SRMUSDTPERP , ALPHAUSDTPERP , DGBUSDTPERP, ...
If you want use this scripts with setup alert or open code, please inbox to me, you are always welcome.

God Number Channel v2(GNC v2)GNC got a little update:
1) Logic changed a bit.
I tried to calculate MAs based on the power(high - low of previous bars).You can see it the M-variables, as new statements were added in calculation section of MAs. I don't really know if I did right, because I didn't go too much in Pine Script. I just wanted to make a Bollinger-bands-like bands, which could predict the levels at which might reverse, using legendary fibonacci and Tesla's harmonic number 432. It's might sound as a joke, but as you can see, it works pretty good.
2) Customization :
No need to change Fibonacci ratios in code. Now you can do it in the GNC settings. Also MAs' names were made obvious, just check it out. Time of million similar "MA n1" has passed :)
3) Trade-entry advices :
I didn't tell you exactly the trade-entry advices, as I haven't explored this script fully yet :) But you probably understood something intuitively, when added GNC on the chart. Now I made things way more obvious:
1. Zones between Fib ratios show you how aware you should be of price movements. Basically, here are the rules, but you probably understand them already:
1.1 Red zone(RZ) : high awareness, very likly for price to be reversed, but if there is a clear trend and you know, than it might be a time for price to shoot up/down.
1.2 Orange zone(OZ) : medium awareness, not so obvious, as price might go between boundaries of OZ and continue the trend movement if such followed before entering the OZ. If price go below lower boundary of OZ and the next bar opens below this boundary, it might be a signal for SHORY, BUT(!) please consider confirmation of any sort to be more sure. Think of going beyond the upper boundary by analogy.
1.3 Green Zone(GZ) : if the price hits any boundary of green zone, it is usually a good oppurtunity to open a position against the movement(hit lower boundary -> open LONG, hit upper boundary -> open SHORT).
1.4 Middle Zone(Harmonic Zone)(MZ) : same rules from Green Zone.
IMPORTANT RECCOMENDATION : Use trend indicator to trend all signals from zones to follow the trend, 'cause counter-trending with this thing without stop loss might very quickly wipe you out , might if you will counter-trend strategy with GNC, I will be glad if you share it with the community :)
Reccomendation for better entries :
1) if the price hits the lower(or high) boundaries(LB or HB) zone after zone(hit LB or HB of RZ, then of OZ, then of GZ), it is a very good signal to either LONG, if price was hitting LBs , or SHORT, if hitting HBs .
2) Consider NOT to place trades when in MZ, as price in this zone gets tricky often enough. By the way, if you dont the see the harmonic MAs(which go with plot(ma1+(0.432*avg1)) ), then set the transparency of zone to 20% or a bit more and then it will be ok.
I will continue to develop the GNC and any help or feedback from you, guys, will be very helpful for me, so you welcome for any of those, but please be precise in your critics.
Thank you for using my stuff, hope you found it usefull. Good luck :)

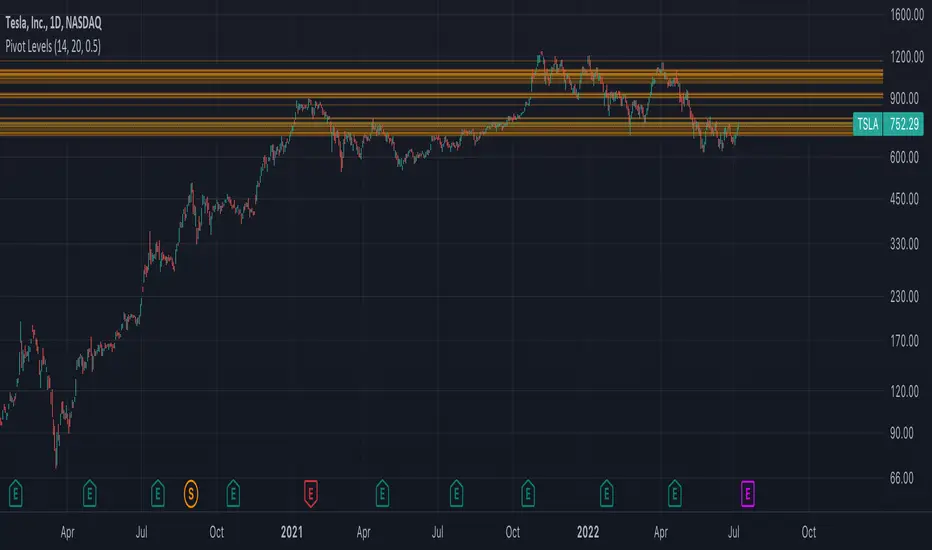
Autodrawn Pivot Levels IndicatorAn experiment with pinescript's line.new() function. The Autodrawn Pivot Levels indicator draws horizontal lines in areas where prices have been flat, which serve as pivot points. This can be useful for pivot trading as it visually shows several critical levels
Infiten's Return Candle OscillatorInfiten's Return Candle Oscillator is an oscillator which shows the percentage return on the open, high, close and low over a customizable period in the form of candlesticks. It may be helpful for seeing volatility, swing trading, or mean reversion trading.
The RCO consists of two plotted elements :
RCO Candles (short length): candlesticks which are plotted with low = the product of the percentage changes in the low over a period, high = the product of the percentage changes in the high over a period, close = the product of the percent changes in close over a period, and open = the product of the percentage changes in return over a period. Similarly to with standard candlesticks, if the percentage change on the close is higher than the percentage change on the open, the candlestick is green, otherwise it is red.
Smoothed RCO Line (long length) : a moving average of the average of the low, close, open and high calculated for the RCO Candles. The line's transparency is determined by the percentage difference between the RCO and the highest or lowest RCO over the long length. A more transparent line means that the RCO is closer to the highest or lowest RCO, and may be indicative of a reversal, or weakening trend.

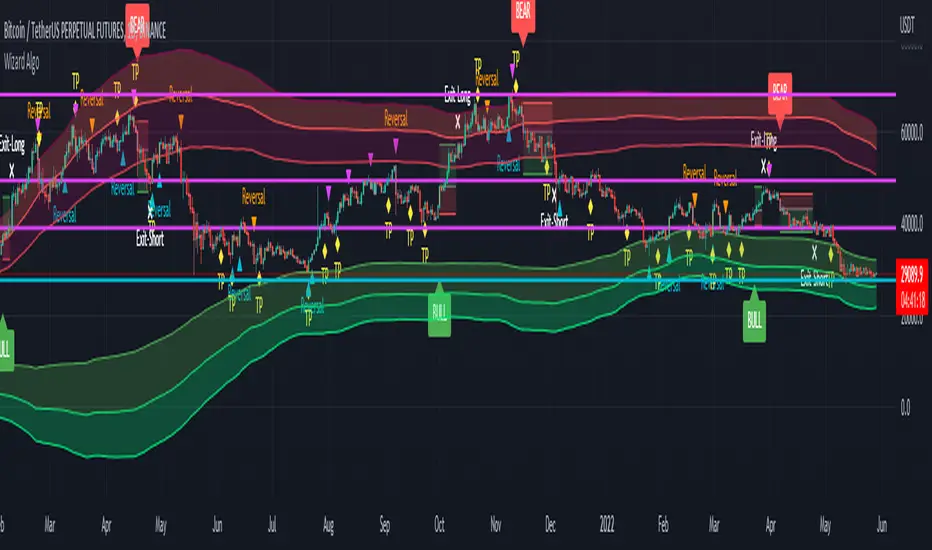
Wizard AlgoWizard Algo:
==============================
Features of the indicator:
- BULL/BEAR Signals
- TP (Take-Profit) and Exit System
- Possible Reversal Signals
- Reversal Scalper
- Reversal Bands
- Trend Bar Colors
- Auto Support/Resistance Levels
- Auto Trend-Lines
================================
Description:
1. Signals: The signals consists of 2 different approaches and the users can choose which signal type they want to use. The indicator gives bull/bear signals based on certain condition, such as trend and momentum. The "TP" signals stands for "Take Profit." These signals help users to decide when to take profits or liquidate all position. The Indicator includes an exit system that can used as another means of closing a position. The exit system uses a 1.5x risk to reward ratio to determine where to keep the take profit and stop loss target.
2.Reversal Scalper: Reversal scalpers are the tiny up(aqua) and down(fuchsia) triangles on the chart. These signals a possible reversal in the price and they can be used to enter a scalping trade. The signals uses mainly momentum and candle price action to determine when there could be a possible reversal in price.
3. Reversal Bands: The reversal band is the green/red cloud like indicator. This can help determine when a price is oversold and therefore, it could reverse. Same goes for the short side, if price is in the overbought territory, then it could reverse to the downside. The reversal bands uses mainly volatility. This is not the same thing as Bollinger bands.
4. Bar Colors: The candle bar colors helps to determine the current trend. The colors are given based on the current trend. The colors lime/red shows strong trend, and orange/cyan/blue shows weak trend.
5. Auto S/R and Auto trendlines: These indicators can be used for determining price actions. Both of these work in similar manner. They mainly look at the previous pivots and draws a line connecting the pivots. S/R are the horizontal lines and the trendline have angles to them.