Breakouts with Tests & Retests [LuxAlgo]The Breakouts Tests & Retests indicator highlights tests and retests of levels constructed from detected swing points. A swing area of interest switches colors when a breakout occurs.
Users can control the sensitivity of the swing point detection and the width of the swing areas.
🔶 USAGE
When a Swing point is detected, an area of interest is drawn, colored green for a bullish swing and red when bearish.
A test is confirmed when the opening price is situated in the area of interest, and the closing price is above or below the area, depending on whether it is a bullish or bearish swing. Tests are highlighted with a solid-colored triangle.
A breakout is confirmed when the price closes in the opposite position, below or above the area, in which case the area will switch colors.
If the opening price is located within the area and the closing price closes outside the area, in the same direction as the breakout, this is considered a retest . Retests are highlighted with a hollow-colored triangle.
Note that tests/retests do not act on wicks. The main factor is that the opening price is in the area of interest, while the closing price is outside.
🔹 Area Of Interest Width
The user can adjust the width of the swing areas. Changing the " Width " is a fast and easy way to find different areas of interest.
A higher "Multiple" setting would return a wider area, allowing price to develop within it for a longer period of time and potentially provide later test signals.
When a swing area is broken, a higher "Width" setting can make it more complicated for the price to break it again, allowing a swing area to remain valid for a longer period of time thus potentially providing more retest signals.
🔶 DETAILS
Generally, only one bullish/bearish pattern can be active at a time. This means that no more than 1 bullish or bearish area will be active.
The " Display " settings, however, can help control how areas of different types are displayed.
Bullish AND Bearish: Both, bullish and bearish patterns can be drawn at the same time
Bullish OR Bearish: Only 1 bullish or 1 bearish pattern is drawn at a time
Bullish: Only bullish patterns
Bearish: Only bearish patterns
🔹 Test/Retest Labels
The user can adjust the settings so only the latest test/retest label is shown or set a minimum number of bars until the next test/retest can be drawn.
🔹 Maximum Bars
Users can set a limit of bars for when there is no test/retest in that period; the area of interest won't be updated anymore and will be available and ready for the next Swing.
An option for pulling the area back to the last retest is included.
🔶 SETTINGS
Display: Determines which swing areas are displayed by the indicator. See the "DETAILS" section for more information
Multiple: Adjusts the width of the areas of interest
Maximum Bars: Limit of bars for when there is no test/retest
Display Test/Retest Labels: Show all labels or just the last test/retest label associated with a swing area
Minimum Bars: Minimum bars required for a subsequent test/retest label are allowed to be displayed
Set Back To Last Retest: When after "Maximum Bars" no test/retest is found, place the right side of the area at the last test/retest
🔹 Swings
Left: x amount of wicks on the left of a potential Swing need to be higher/lower for a Swing to be confirmed.
Right: The number of wicks on the right of a potential swing needs to be higher/lower for a Swing to be confirmed.
🔹 Style
Bullish: color for test period (before a breakout) / retest period (after a breakout)
Bearish: color for test period (before a breakout) / retest period (after a breakout)
Label Size
測試

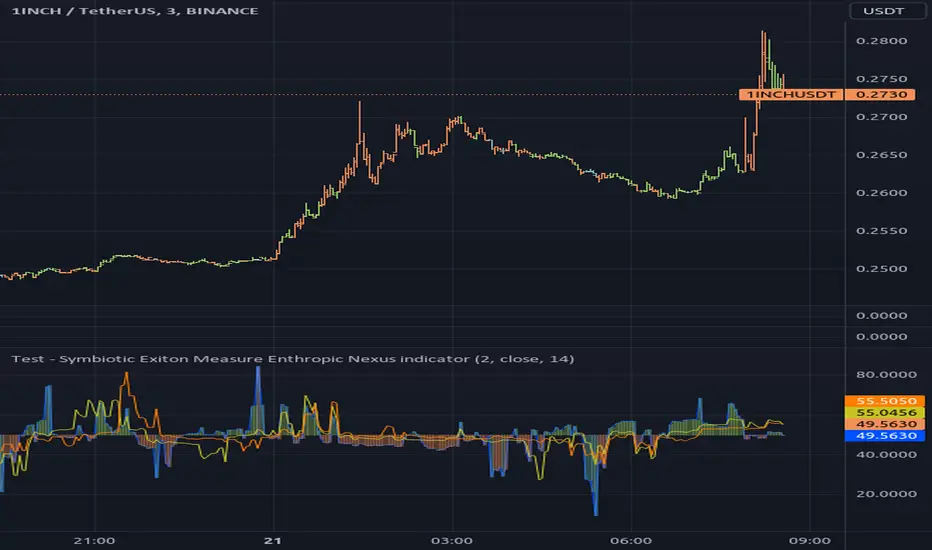
Test - Symbiotic Exiton Measure Enthropic Nexus indicatorThe Symbiotic Exiton Measure Enthropic Nexus (SEMEN) Indicator is a technical analysis tool used in trading and investing. It's name might sound complex, but its function is quite simple - to help traders make informed decisions about buying or selling stocks by predicting market trends.
The SEMEN indicator uses a combination of various factors such as volume, price action, moving averages, and other indicators to generate a single numerical value that represents the overall health of the market. A high reading indicates a strong uptrend, while a low one suggests a downtrend.
Traders can use this information to enter or exit positions with confidence.
In essence, the SEMEN indicator provides a comprehensive view of the market's sentiment and direction, making it an essential tool for any trader or investor looking to make profitable decisions in today's volatile stock markets.
~description generated with Airoboros7b
- The indicator is experimental so use at your own discretion..
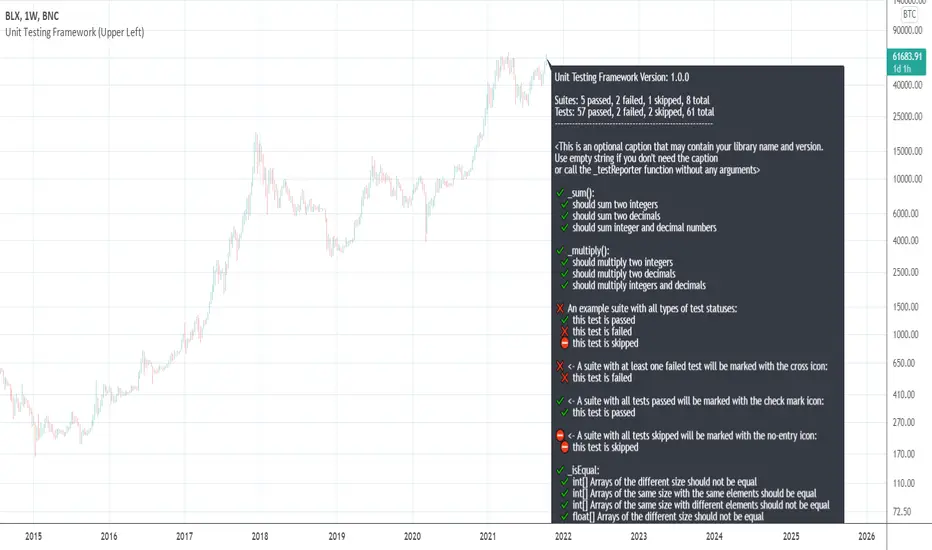
[UTILS] Unit Testing FrameworkTL;DR
This script doesn't provide any buy/sell signals.
This script won't make you profitable implicitly.
This script is intended for utility function testing, library testing, custom assertions.
It is free and open-source.
Introduction
About the idea: is not exclusive, programmers tend to use this method a lot and for a long time.
The point is to ensure that parts of a software, "units" (i.e modules, functions, procedures, class methods etc), work as they should, meet they design and behave as intended. That's why we use the term "Unit testing".
In PineScript we don't have a lot of entities mentioned above yet. What we have are functions. For example, a function that sums numbers should return a number, a particular sum. Or a professor wrote a function that calculates something or whatever. He and you want to be sure that the function works as expected and further code changes (refactoring) won't break its behaviour. What the professor needs to do is to write unit tests for his function/library of functions. And what you need to do is to check if the professor wrote tests or not.
No tests = No code
- Total test-driven development
Ok, it is not so serious, but very important in software development. And I created a tool for that.
I tried to follow the APIs of testing tools/libs/frameworks I worked or work with: Jasmine (Javascript), Mocha/Chai (Javascript), Jest (Javascript), RSpec (Ruby), unittest (Python), pytest (Python) and others. Got something workable but it would be much easier to implement (and it would look much better) if PineScript had a higher-order functions feature.
API
_describe(suiteName: string)
A function to declare a test suite. Each suite with tests may have 2 statuses:
✔️ Passed
❌ Failed
A suite is considered to be failed if at least one of the specs in it has failed.
_it(specName: string, actual: any, expected: any)
A function to run a test. Each test may have 3 statuses:
✔️ Passed
❌ Failed
⛔ Skipped
Some examples:
_it("is a falsey value", 1 != 2, true)
_it("is not a number", na(something), true)
_it("should sum two integers", _sum(1, 2), 1)
_it("arrays are equal", _isEqual(array.from(1, 2), array.from(1, 2)), true)
Remember that both the 'actual' and 'expected' arguments must be of the same type.
And a group of _it() functions must be preceded by a _describe() declaration (see in the code).
_test(specName: string, actual: any, expected: any)
An alias for _it . Does the same thing.
_xit(specName: string, actual: any, expected: any)
A function to skip a particular test for a while. Doesn't make any comparisons, but the test will appear in the results as skipped.
This feature is unstable and may be removed in the future releases.
_xtest(specName: string, actual: any, expected: any)
An alias for _xit . Does the same thing.
_isEqual(id_1: array, id_2: array)
A function to compare two arrays for equality. Both arrays must be of the same type.
This function doesn't take into account the order of elements in each array. So arrays like (1, 2, 3) and (3, 2, 1) will be equal.
_isStrictEqual(id_1: array, id_2: array)
A function to compare two arrays for equality. Both arrays must be of the same type.
This function is a stricter version of _isEqual because it takes into account the order of elements in each array. So arrays like (1, 2, 3) and (3, 2, 1) won't be equal.
Usage
To use this script to test your library you need to do the following steps:
1) Copy all the code you see between line #5 and #282 (Unit Testing Framework Core)
2) Place the copied code at the very beginning of your script (but below study())
3) Start to write suites and tests where your code ends. That's it.
NOTE
The current version is 0.0.1 which means that a lot of things may be changed on the way to 1.0.0 - the first stable version.
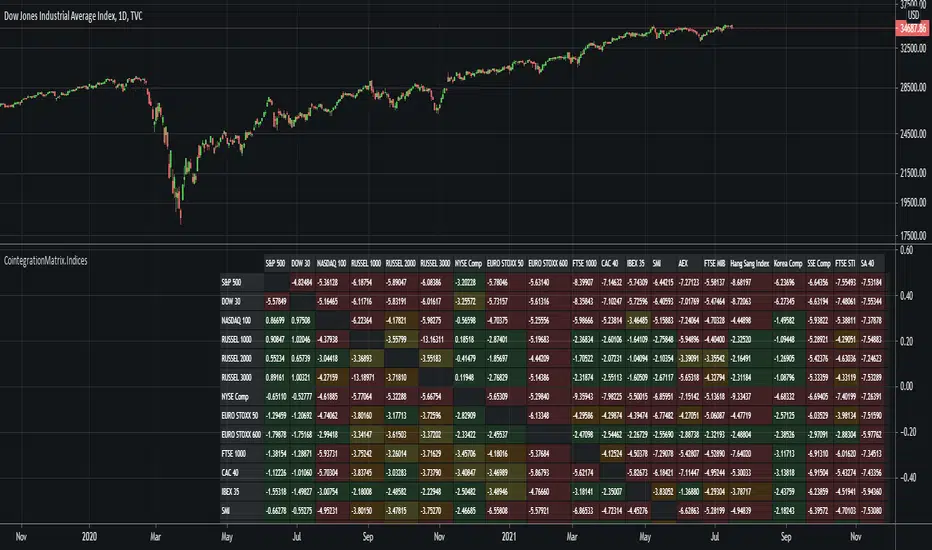
Cointegration Matrix (Indices)This indicator plots a cointegration matrix for pairings of most major stock indices. The matrix is populated with ADF t-stats (from an ADF-test with 1 lag). An ADF-test (Augmented Dickey-Fuller test) tests the null hypothesis that an AR process has a unit root. If rejected, the alternative hypothesis is usually that the AR process is either stationary or trend-stationary.
Technically what we're doing is running an ADF-test on the residuals (spread) of each pairing (i.e. a cointegration test). So we're testing if there is a unit root in the spread between the two assets of a pairing. A unit root being present in the spread essentially means the spread varies randomly over time, and any mean reversion in the spread is very hard to predict, or may never happen. If there is no evidence of a unit root, the spread (distance between the assets) should remain more or less constant over time, or rise/fall in close to the same rate over time (if it can be modelled as an AR process). The more negative the number, the stronger the rejection of the idea that the spread has a unit root. So in statistics we choose a critical value that corresponds to a confidence level of the test. In this case, -3.238 equals a confidence level of 90%, -3.589 equals a confidence level of 95% and -4.375 equals a confidence level of 99%. So the colors are based on the confidence level of the test statistic (the t-stat, i.e. the number of the pairing in the matrix). So if the number is greater than -3.238 it is green, if it's between -3.238 and -3.589 it's yellow, if it's between -3.589 and -4.375 it's orange, and if its lower than -4.375 it's red.
There are multiple ways to interpret the results. A strong rejection of the presence of a unit root (i.e. a value of -4.375 or below) is not a guarantee that there is no unit root, or that any of the two alternative hypotheses (that the spread is stationary or trend-stationary) are correct. It only means that in 99% of the cases, if the spread is an AR process, the test is right, and there is no unit root in the spread. Therefore, the results of this test is no guarantee that the result proves one of the alternative solutions. Green therefore means that a unit root cannot be ruled out (which can be interpreted as "the two indices probably don't move together over time"), and red means that a unit root is likely not present (which can be interpreted as "the two indices may move together over time").
NOTE: The indicator can take a while to load since it is loading data from 20 stock indices and calculating the ADF t-stat for 380 pairings.
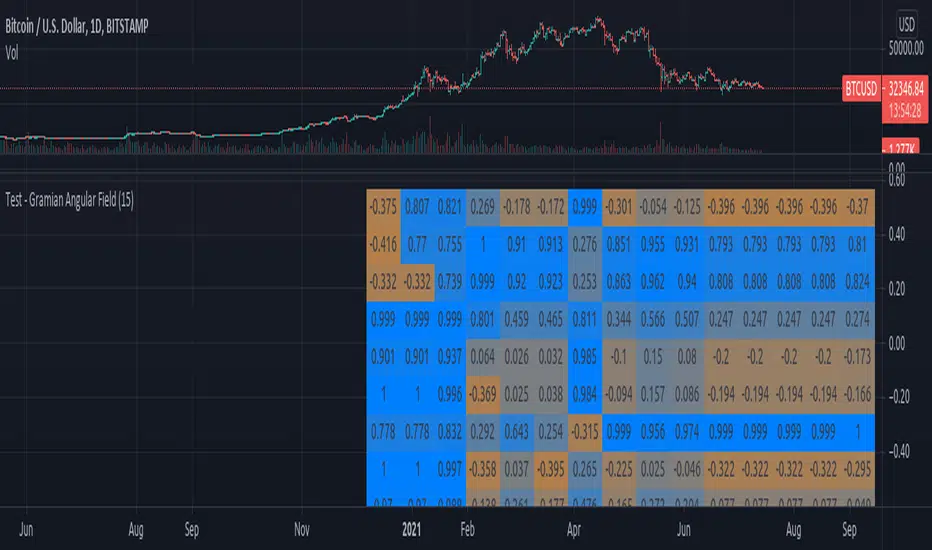
Test - Gramian Angular FieldExperimental:
The Gramian Angular Field is usually used in machine learning for machine vision, it allows the encoding of data as a visual queue / matrix.
Cointegration Matrix (FX)This indicator plots a cointegration matrix for pairings of all 28 major forex pairs. The matrix is populated with ADF t-stats (from an ADF-test with 1 lag). An ADF-test (Augmented Dickey-Fuller test) tests the null hypothesis that an AR process has a unit root. If rejected, the alternative hypothesis is usually that the AR process is either stationary or trend-stationary.
Technically what we're doing is running an ADF-test on the residuals (spread) of each pairing (i.e. a cointegration test). So we're testing if there is a unit root in the spread between the two assets of a pairing. A unit root being present in the spread essentially means the spread varies randomly over time, and any mean reversion in the spread is very hard to predict, or may never happen. If there is no evidence of a unit root, the spread (distance between the assets) should remain more or less constant over time, or rise/fall in close to the same rate over time (if it can be modelled as an AR process). The more negative the number, the stronger the rejection of the idea that the spread has a unit root. So in statistics we choose a critical value that corresponds to a confidence level of the test. In this case, -3.238 equals a confidence level of 90%, -3.589 equals a confidence level of 95% and -4.375 equals a confidence level of 99%. So the colors are based on the confidence level of the test statistic (the t-stat, i.e. the number of the pairing in the matrix). So if the number is greater than -3.238 it is green, if it's between -3.238 and -3.589 it's yellow, if it's between -3.589 and -4.375 it's orange, and if its lower than -4.375 it's red.
There are multiple ways to interpret the results. A strong rejection of the presence of a unit root (i.e. a value of -4.375 or below) is not a guarantee that there is no unit root, or that any of the two alternative hypotheses (that the spread is stationary or trend-stationary) are correct. It only means that in 99% of the cases, if the spread is an AR process, the test is right, and there is no unit root in the spread. Therefore, the results of this test is no guarantee that the result proves one of the alternative solutions. Green therefore means that a unit root cannot be ruled out (which can be interpreted as "the two forex pairs probably don't move together over time"), and red means that a unit root is likely not present (which can be interpreted as "the two forex pairs may move together over time").
One possible way to use this indicator is to make sure you don't trade two pairs that move together at the same time. So basically the idea is that if you already have a trade open in one of the currency pairs of the pairing, only enter a trade in the other currency pair of that pairing if the color is green, or you may be doubling your risk.
NOTE: The indicator can take a while to load since it is loading data from 28 pairs and calculating the ADF t-stat for 756 pairings.

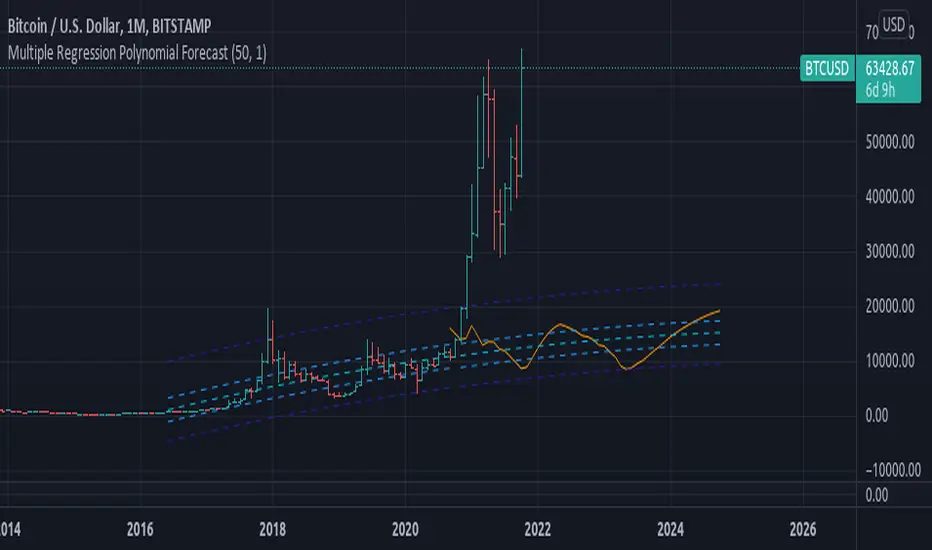
Multiple Regression Polynomial ForecastEXPERIMENTAL:
Forecasting using a polynomial regression over the estimates of multiple linear regression forecasts.
note: on low data the estimates are skewd away of initial value, i added the i_min_estimate option in to try curve this issue with limited success "o_o.
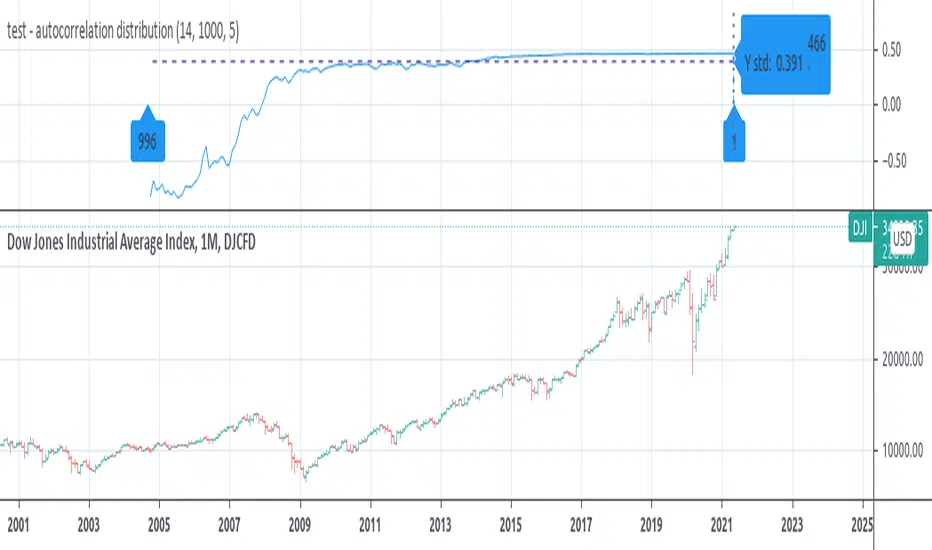
test - autocorrelation distributionexperimental:
shows the distribution for each shift in a autocorrelation.
test - delta distributiona test case for the KDE function on price delta.
the KDE function can be used to quickly check or confirm edge cases of the trading systems conditionals.

test - autocorrelationExperimental:
finds and displays the wavelength index's of the autocorrelation wavelengths..

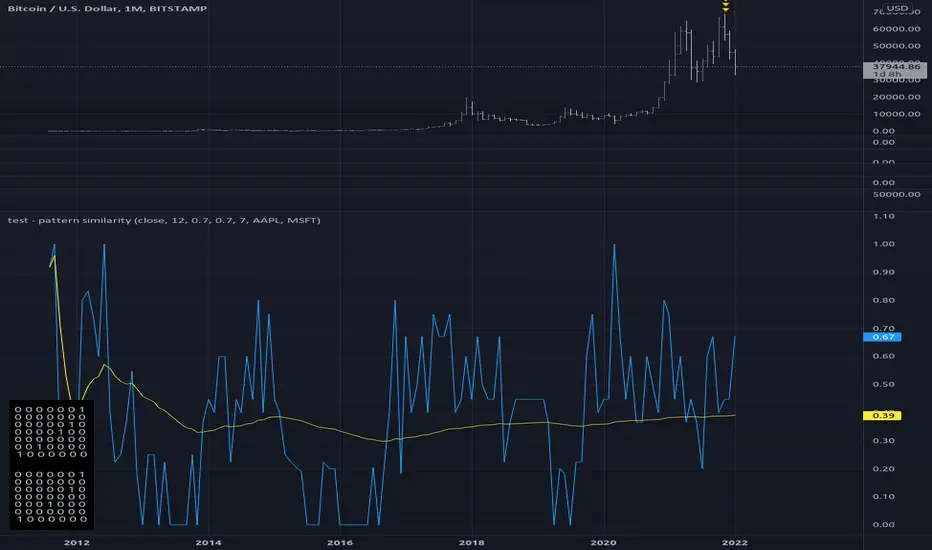
Test: Pattern RecognitionEXPERIMENTAL:
a test on how to compare price at different frequency's with static patterns.

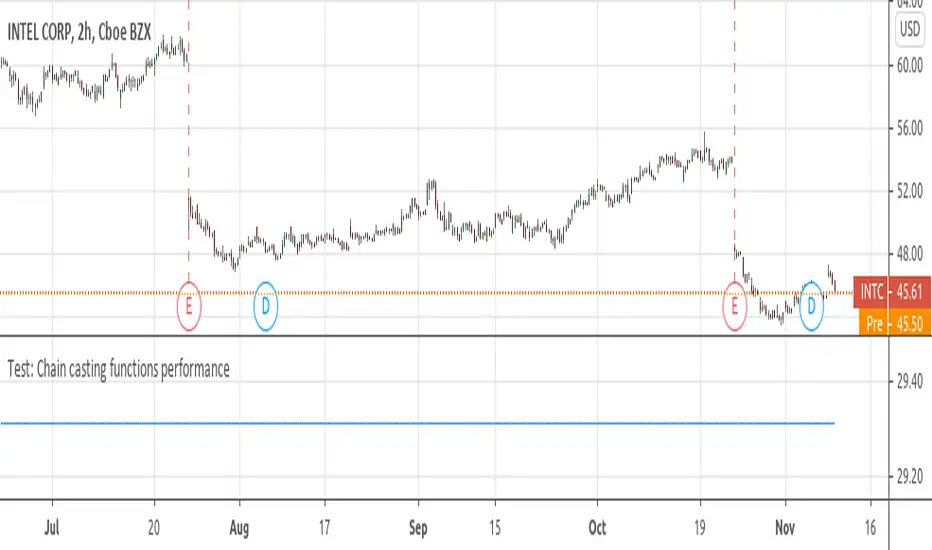
Test: Chain casting functions performanceExperimental:
A simple test to check performance impact of chaining functions in pinescript.
CC - PVT CloudsReleasing this test script for PVT ratios using sub-interval harmonics at a 1D, 4H, 1H, 45M, 15M and 5M level.
It basically takes the PVT values for a rolling periodic interval and gets the (avg - min)/max for that interval (the ratio).
Then it colors it based on the subinterval next to it. Just think of it as rolling Ichimoku clouds, but in real-time using PVT.
I'm not saying much more than that, as this is an experimental indicator. Feel free to use it and give me feedback.
Drop a like if this helps you trade, but please do not use these indicators as a DIVINING ROD for your trades.
However, I will possibly release a paid version with TEXTUAL take profit/stoploss indicators.
*DISCLAIMER*
No amount of technical indicators will safe you from a lapse in Due Diligence or Market/Industry Judgement.
I am not responsible for lost equity due to trades caused my relying on this indicator.


Silicone Re-calibrate ATRInspired by @bitmexstorm study Volatility-calibrated ATR
This study features two different ATR trail derivative concepts-Default one is called- "Silicone", and the alternative is called- "Mercurial. To decrease confusion during backtesting, trails plots with distinct color palette.
Options include the ability to apply a smoothening filter that affects both modes as well as an adaptive/fixed mode for the "Silicone" trail.
Parameters for trail dynamics/behavior is unlocked(!Parameters in publish version is far from optimized! Need serious testing! )
Candle Coloring reflects trail direction.
Feedback on optimal periods and multipliers is needed and appreciated


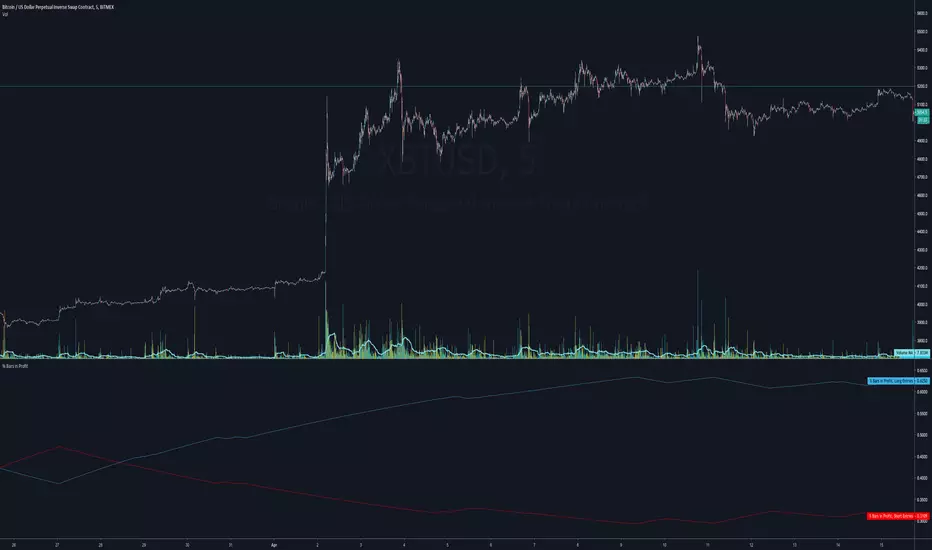
% Bars in ProfitUse this to determine how often your average entry price for shorts and longs over the last 11 trades are in profit or not.