Next Candle PredictorAdvanced TradingView Indicator for Precise Buy and Sell Signals
Overview:
The Predicta Futures - Next Candle Predictor is a cutting-edge TradingView indicator designed to forecast the next candle's direction in futures and cryptocurrency markets. Leveraging a multi-indicator confluence strategy, this tool provides traders with actionable long and short prediction percentages, enhanced by dynamic ADX-based thresholds and visual projection candles. Ideal for scalping, day trading, or swing trading on platforms like MEXC or Binance futures, it combines Supertrend, MACD, RSI, Stochastic, ADX, and volume analysis to deliver high-probability buy and sell signals while minimizing false positives.
Key Features:
* Multi-Indicator Confluence Scoring: Integrates Supertrend for trend direction, EMAs (8, 21, 50) for alignment, MACD for momentum crossovers, RSI for overbought/oversold conditions, Stochastic for divergence detection, ADX for trend strength, and volume ratios for confirmation. A customizable confluence score (0-6) ensures signals meet user-defined criteria, reducing whipsaws in volatile markets.
* Dynamic Prediction Thresholds: ADX-driven adjustments lower the required prediction percentage (e.g., 60% in strong trends) for "PERFECT TIME" entries, adapting to market conditions like ranging or trending phases.
* Visual Analysis Table: A sleek, color-coded dashboard displays progress bars for each indicator, prediction percentages, and status (e.g., "PERFECT TIME" or "WAIT"). Supports long and short analyses with intuitive ASCII bars for quick scans.
* Projection Candles: Simulates potential next-candle outcomes with volatility-scaled (via Bollinger Bands width) green long and red short candles, aiding in visualizing price targets.
Buy/Sell Signals and Alerts: Generates labeled "BUY" and "SELL" arrows on EMA crossovers within confirmed trends, with separate alerts for basic signals and high-confluence "PERFECT TIME" opportunities.
* Customizable Inputs: Adjust ATR periods, Supertrend factors, minimum confluence scores, and volume ratios to tailor the indicator for stocks, forex, or crypto perpetual futures.
How It Works:
This TradingView script calculates long and short scores using weighted contributions from key indicators, normalizing them into prediction percentages. A confluence check—factoring trend, EMA alignment, MACD, Stochastic, volume, and ADX—triggers "PERFECT TIME" only when conditions align robustly. For example:
In a downtrend (Supertrend red), with bearish MACD and Stochastic, and sufficient volume, the indicator highlights short opportunities.
Dynamic thresholds ensure aggressive entries in strong trends (ADX >25) and conservative ones in weak trends.
Backtested for reliability, it excels in identifying reversals and continuations, making it a must-have for traders seeking an edge in futures trading strategies.
Usage Instructions:
1. Add the indicator to your TradingView chart.
2. Customize settings via the inputs panel (e.g., set minConfluence to 5 for stricter signals).
3. Monitor the analysis table for predictions and confluence scores.
4. Act on "BUY/SELL" labels or "PERFECT TIME" alerts, combining with your risk management.
5. Enable projection candles for visual forecasting of the next bar.
Compatible with all timeframes, from 1-minute scalping to daily swings. Note: This is not financial advice; always verify signals with additional analysis.
Rate and review if it boosts your trades!
Thank you!
Threshold

RSI Trend Bias█ OVERVIEW
The RSI Trend Bias indicator is a custom technical analysis tool that utilizes the Relative Strength Index (RSI) to gauge market momentum and identify potential trend shifts. By monitoring RSI crossovers and crossunders relative to customizable threshold levels, the indicator provides clear visual cues that distinguish between bullish and bearish market conditions. This flexible approach makes it suitable for both short-term scalping and longer-term trend analysis.
█ KEY FEATURES
Dynamic RSI Trend Detection
The indicator dynamically determines market bias by monitoring the RSI for crossovers above the upper threshold and crossunders below the lower threshold. This method ensures that only significant momentum shifts trigger a change in trend, reducing false signals in volatile markets.
Adaptive Visualizations
The RSI Trend Bias indicator enhances clarity by plotting the RSI with colors that reflect current market conditions. Additionally, it offers an optional background color change to further emphasize bullish or bearish states, providing immediate visual feedback to traders.
Clear Threshold Indicators
Upper and lower threshold levels are plotted as constant reference lines, clearly delineating overbought and oversold regions. These markers help traders quickly assess market conditions at a glance.
Customizable Settings
Users have full control over key parameters including the RSI length, threshold levels, and visual settings. This customization allows the indicator to be tailored for different markets and trading styles, ensuring optimal performance across various timeframes.
█ UNDERLYING METHODOLOGY & CALCULATIONS
RSI Calculation
The indicator computes the Relative Strength Index over a user-defined period (default is 14), providing a measure of market momentum that reflects price changes over time.
Trend Determination Logic
By detecting when the RSI crosses above the upper threshold, the indicator signals a shift towards bullish momentum. Conversely, a crossunder below the lower threshold indicates bearish conditions. This straightforward binary approach filters out minor fluctuations, ensuring clarity in trend analysis.
Visual Signal Integration
Based on the detected trend, the RSI line is dynamically colored—green for bullish conditions and red for bearish conditions. An optional background color change further reinforces these signals, offering an immediate visual cue of prevailing market sentiment.
█ HOW TO USE THE INDICATOR
1 — Apply the Indicator
• Add the RSI Trend Bias indicator to a separate pane in your trading platform.
2 — Adjust Settings for Your Market
• RSI Length – Define the period for RSI calculation (default is 14).
• Threshold Levels – Set the upper (default 70) and lower (default 30) thresholds to identify overbought and oversold conditions.
• Visual Customization – Choose the bullish (green) and bearish (red) colors, and enable background color changes to enhance visual trend recognition.
3 — Interpret the Signals
• RSI Line – Observe the dynamically colored RSI line; a shift to green signals bullish momentum, while red indicates bearish conditions.
• Threshold Levels – Use the constant upper and lower lines as reference points for overbought and oversold states.
• Signal Timing – A crossover above the upper threshold or a crossunder below the lower threshold suggests potential entry or exit points.
4 — Integrate with Your Trading Strategy
• Combine RSI Trend Bias signals with other technical analysis tools to confirm market direction.
• Utilize the visual cues for fine-tuning your entry and exit decisions, ensuring robust risk management and optimized trade timing.
█ CONCLUSION
The RSI Trend Bias indicator offers a streamlined yet effective approach to monitoring market momentum. By leveraging the established principles of RSI analysis alongside dynamic visual cues, it enables traders to quickly identify bullish and bearish trends. Its customizable features and clear threshold indicators make it a valuable tool for enhancing technical analysis and making informed trading decisions.

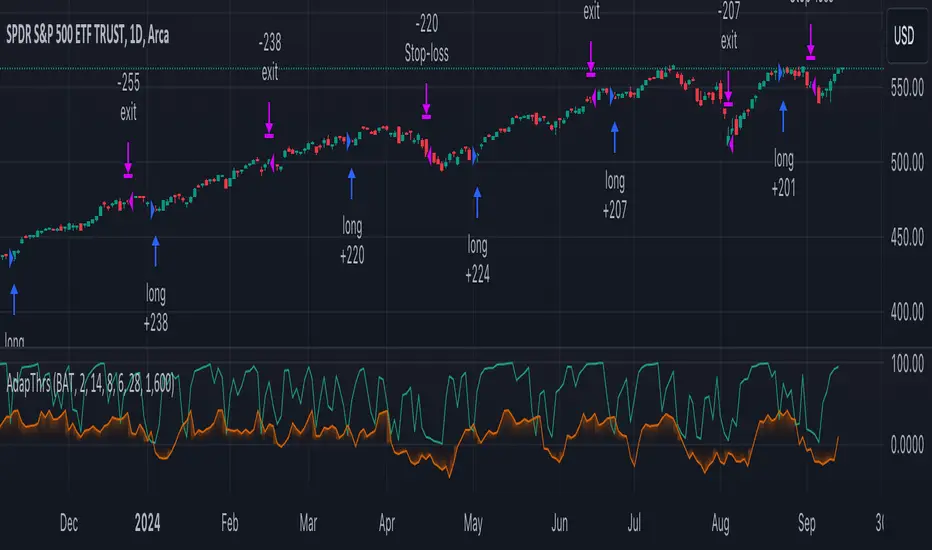
TASC 2024.10 Adaptive Oscillator Threshold█ OVERVIEW
This script introduces a more dynamic approach to generating trading signals using the RSI indicator and a threshold that adapts to price trends and dispersion. This methodology comes from Francesco Bufi's article "Overbought/Oversold Oscillators: Useless Or Just Misused" from the October 2024 edition of TASC's Traders' Tips .
█ CONCEPTS
According to Francesco Bufi's observations, an oscillator-based buy signal should have a threshold that varies with the trend direction: higher during uptrends and lower during downtrends. Additionally, the level should decrease as the distance from the price to its mean increases to reduce signals in volatile conditions. Accordingly, Bufi proposes a formula for an adaptive buy level whose value is proportional to the trend (linear regression slope) and inversely proportional to the typical distance between price and its mean (standard deviation). Traders can apply this method to any oscillator to add adaptivity without modifying the oscillator's calculations, as it's simply an adaptive technique for interpreting the calculated values.
This script demonstrates the application of Bufi's Adaptive Threshold (BAT) in a simple RSI-based strategy and allows users to compare its performance to the traditional fixed-threshold approach. Bufi's observations suggest that using the BAT instead of a static threshold can help improve the backtest performance of oscillator-based systems.
█ DISCLAIMER
This strategy script educates users on the trading systems outlined by the TASC article. By default, it uses 10% of equity as the order size and a slippage amount of 5 ticks. Traders should adjust these settings and the commission amount when using this script.
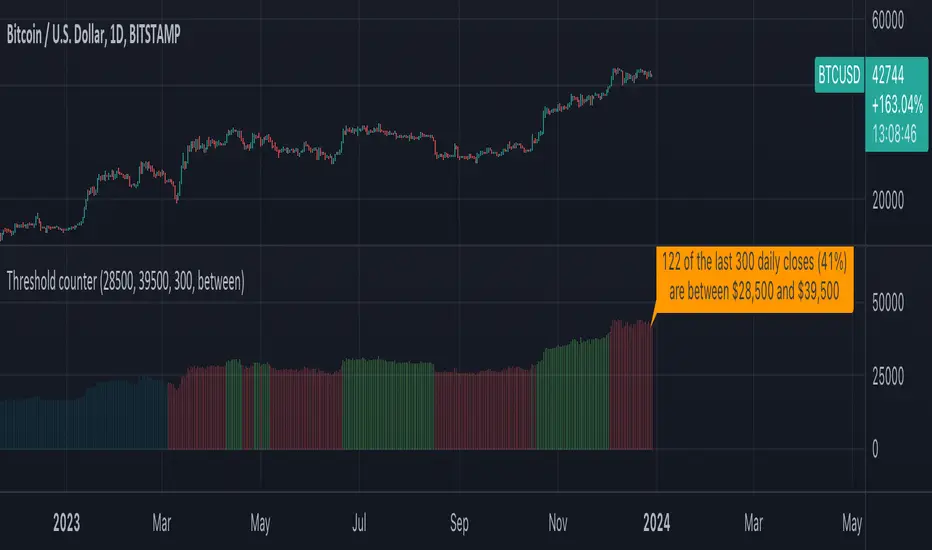
Threshold counterOVERVIEW
The "Threshold Counter" is a tool for quantifying occurrences of closing prices of an asset that align with specified criteria and is a flexible and visual approach to studying price action.
A user-definable target threshold can be set and a comparator (<, =, >, and so on) can be selected. The indicator counts values on the main chart meeting these conditions, over a user-defined `lookback` period.
KEY FEATURES
User definable threshold: target value with optional upper bound can be specified
Versatile Comparisons: Choose from "=", ">=", ">", "<=", "<", "between", and "between (inclusive)" for diverse analysis.
Historical Analysis: Assess occurrences over a customisable period.
Visual Representation: Displays instances graphically on the chart with customisable colours.
Summary: Provides a summary label for a quick understanding of the analysed data.
USE-CASES
Pattern Recognition: Identify patterns or trends based on user-defined price criteria.
Threshold Analysis: Quantify occurrences of prices crossing or staying within a specified range.
Strategy Testing: Evaluate historical performance of strategies relying on specific price conditions.
Behavioural Insights: Gain insights into price behaviour by counting occurrences of interest.
The "Threshold Counter" indicator offers a flexible and visual approach to studying price action, which may aid in making decisions based on historical data.
IMPORTANT CONSIDERATIONS
Period selection: The effectiveness of the analysis may be influenced by the choice of the lookback period. Consider an appropriate duration based on the strategy or pattern being analysed.
Comparator Selection: Comparison operator selection will obviously affect the results. There are two range operators of `between` and `between (inclusive)`. The latter will add closing prices that exactly meet the threshold and upper bound. The former does not.
Visualisation: Interpretation of the visual representation is colour-coded.
Red is threshold condition is not met.
Green is threshold condition is met.
Aqua is outside of the lookback period.
User Discretion: This script relies on historical data and should be used with caution. Past performance is not indicative of future results.
Supplementary Analysis: Trading decisions should not rely solely on this script. Users should exercise judgment and consider market conditions.
Advanced Dynamic Threshold RSI [Elysian_Mind]Advanced Dynamic Threshold RSI Indicator
Overview
The Advanced Dynamic Threshold RSI Indicator is a powerful tool designed for traders seeking a unique approach to RSI-based signals. This indicator combines traditional RSI analysis with dynamic threshold calculation and optional Bollinger Bands to generate weighted buy and sell signals.
Features
Dynamic Thresholds: The indicator calculates dynamic thresholds based on market volatility, providing more adaptive signal generation.
Performance Analysis: Users can evaluate recent price performance to further refine signals. The script calculates the percentage change over a specified lookback period.
Bollinger Bands Integration: Optional integration of Bollinger Bands for additional confirmation and visualization of potential overbought or oversold conditions.
Customizable Settings: Traders can easily customize key parameters, including RSI length, SMA length, lookback bars, threshold multiplier, and Bollinger Bands parameters.
Weighted Signals: The script introduces a unique weighting mechanism for signals, reducing false positives and improving overall reliability.
Underlying Calculations and Methods
1. Dynamic Threshold Calculation:
The heart of the Advanced Dynamic Threshold RSI Indicator lies in its ability to dynamically calculate thresholds based on multiple timeframes. Let's delve into the technical details:
RSI Calculation:
For each specified timeframe (1-hour, 4-hour, 1-day, 1-week), the Relative Strength Index (RSI) is calculated using the standard 14-period formula.
SMA of RSI:
The Simple Moving Average (SMA) is applied to each RSI, resulting in the smoothing of RSI values. This smoothed RSI becomes the basis for dynamic threshold calculations.
Dynamic Adjustment:
The dynamically adjusted threshold for each timeframe is computed by adding a constant value (5 in this case) to the respective SMA of RSI. This dynamic adjustment ensures that the threshold reflects changing market conditions.
2. Weighted Signal System:
To enhance the precision of buy and sell signals, the script introduces a weighted signal system. Here's how it works technically:
Signal Weighting:
The script assigns weights to buy and sell signals based on the crossover and crossunder events between RSI and the dynamically adjusted thresholds. If a crossover event occurs, the weight is set to 2; otherwise, it remains at 1.
Signal Combination:
The weighted buy and sell signals from different timeframes are combined using logical operations. A buy signal is generated if the product of weights from all timeframes is equal to 2, indicating alignment across timeframe.
3. Experimental Enhancements:
The Advanced Dynamic Threshold RSI Indicator incorporates experimental features for educational exploration. While not intended as proven strategies, these features aim to offer users a glimpse into unconventional analysis. Some of these features include Performance Calculation, Volatility Calculation, Dynamic Threshold Calculation Using Volatility, Bollinger Bands Module, Weighted Signal System Incorporating New Features.
3.1 Performance Calculation:
The script calculates the percentage change in the price over a specified lookback period (variable lookbackBars). This provides a measure of recent performance.
pctChange(src, length) =>
change = src - src
pctChange = (change / src ) * 100
recentPerformance1H = pctChange(close, lookbackBars)
recentPerformance4H = pctChange(request.security(syminfo.tickerid, "240", close), lookbackBars)
recentPerformance1D = pctChange(request.security(syminfo.tickerid, "1D", close), lookbackBars)
3.2 Volatility Calculation:
The script computes the standard deviation of the closing price to measure volatility.
volatility1H = ta.stdev(close, 20)
volatility4H = ta.stdev(request.security(syminfo.tickerid, "240", close), 20)
volatility1D = ta.stdev(request.security(syminfo.tickerid, "1D", close), 20)
3.3 Dynamic Threshold Calculation Using Volatility:
The dynamic thresholds for RSI are calculated by adding a multiplier of volatility to 50.
dynamicThreshold1H = 50 + thresholdMultiplier * volatility1H
dynamicThreshold4H = 50 + thresholdMultiplier * volatility4H
dynamicThreshold1D = 50 + thresholdMultiplier * volatility1D
3.4 Bollinger Bands Module:
An additional module for Bollinger Bands is introduced, providing an option to enable or disable it.
// Additional Module: Bollinger Bands
bbLength = input(20, title="Bollinger Bands Length")
bbMultiplier = input(2.0, title="Bollinger Bands Multiplier")
upperBand = ta.sma(close, bbLength) + bbMultiplier * ta.stdev(close, bbLength)
lowerBand = ta.sma(close, bbLength) - bbMultiplier * ta.stdev(close, bbLength)
3.5 Weighted Signal System Incorporating New Features:
Buy and sell signals are generated based on the dynamic threshold, recent performance, and Bollinger Bands.
weightedBuySignal = rsi1H > dynamicThreshold1H and rsi4H > dynamicThreshold4H and rsi1D > dynamicThreshold1D and crossOver1H
weightedSellSignal = rsi1H < dynamicThreshold1H and rsi4H < dynamicThreshold4H and rsi1D < dynamicThreshold1D and crossUnder1H
These features collectively aim to provide users with a more comprehensive view of market dynamics by incorporating recent performance and volatility considerations into the RSI analysis. Users can experiment with these features to explore their impact on signal accuracy and overall indicator performance.
Indicator Placement for Enhanced Visibility
Overview
The design choice to position the "Advanced Dynamic Threshold RSI" indicator both on the main chart and beneath it has been carefully considered to address specific challenges related to visibility and scaling, providing users with an improved analytical experience.
Challenges Faced
1. Differing Scaling of RSI Results:
RSI values for different timeframes (1-hour, 4-hour, and 1-day) often exhibit different scales, especially in markets like gold.
Attempting to display these RSIs on the same chart can lead to visibility issues, as the scaling differences may cause certain RSI lines to appear compressed or nearly invisible.
2. Candlestick Visibility vs. RSI Scaling:
Balancing the visibility of candlestick patterns with that of RSI values posed a unique challenge.
A single pane for both candlesticks and RSIs may compromise the clarity of either, particularly when dealing with assets that exhibit distinct volatility patterns.
Design Solution
Placing the buy/sell signals above/below the candles helps to maintain a clear association between the signals and price movements.
By allocating RSIs beneath the main chart, users can better distinguish and analyze the RSI values without interference from candlestick scaling.
Doubling the scaling of the 1-hour RSI (displayed in blue) addresses visibility concerns and ensures that it remains discernible even when compared to the other two RSIs: 4-hour RSI (orange) and 1-day RSI (green).
Bollinger Bands Module is optional, but is turned on as default. When the module is turned on, the users can see the upper Bollinger Band (green) and lower Bollinger Band (red) on the main chart to gain more insight into price actions of the candles.
User Flexibility
This dual-placement approach offers users the flexibility to choose their preferred visualization:
The main chart provides a comprehensive view of buy/sell signals in relation to candlestick patterns.
The area beneath the chart accommodates a detailed examination of RSI values, each in its own timeframe, without compromising visibility.
The chosen design optimizes visibility and usability, addressing the unique challenges posed by differing RSI scales and ensuring users can make informed decisions based on both price action and RSI dynamics.
Usage
Installation
To ensure you receive updates and enhancements seamlessly, follow these steps:
Open the TradingView platform.
Navigate to the "Indicators" tab in the top menu.
Click on "Community Scripts" and search for "Advanced Dynamic Threshold RSI Indicator."
Select the indicator from the search results and click on it to add to your chart.
This ensures that any future updates to the indicator can be easily applied, keeping you up-to-date with the latest features and improvements.
Review Code
Open TradingView and navigate to the Pine Editor.
Copy the provided script.
Paste the script into the Pine Editor.
Click "Add to Chart."
Configuration
The indicator offers several customizable settings:
RSI Length: Defines the length of the RSI calculation.
SMA Length: Sets the length of the SMA applied to the RSI.
Lookback Bars: Determines the number of bars used for recent performance analysis.
Threshold Multiplier: Adjusts the multiplier for dynamic threshold calculation.
Enable Bollinger Bands: Allows users to enable or disable Bollinger Bands integration.
Interpreting Signals
Buy Signal: Generated when RSI values are above dynamic thresholds and a crossover occurs.
Sell Signal: Generated when RSI values are below dynamic thresholds and a crossunder occurs.
Additional Information
The indicator plots scaled RSI lines for 1-hour, 4-hour, and 1-day timeframes.
Users can experiment with additional modules, such as machine-learning simulation, dynamic real-life improvements, or experimental signal filtering, depending on personal preferences.
Conclusion
The Advanced Dynamic Threshold RSI Indicator provides traders with a sophisticated tool for RSI-based analysis, offering a unique combination of dynamic thresholds, performance analysis, and optional Bollinger Bands integration. Traders can customize settings and experiment with additional modules to tailor the indicator to their trading strategy.
Disclaimer: Use of the Advanced Dynamic Threshold RSI Indicator
The Advanced Dynamic Threshold RSI Indicator is provided for educational and experimental purposes only. The indicator is not intended to be used as financial or investment advice. Trading and investing in financial markets involve risk, and past performance is not indicative of future results.
The creator of this indicator is not a financial advisor, and the use of this indicator does not guarantee profitability or specific trading outcomes. Users are encouraged to conduct their own research and analysis and, if necessary, consult with a qualified financial professional before making any investment decisions.
It is important to recognize that all trading involves risk, and users should only trade with capital that they can afford to lose. The Advanced Dynamic Threshold RSI Indicator is an experimental tool that may not be suitable for all individuals, and its effectiveness may vary under different market conditions.
By using this indicator, you acknowledge that you are doing so at your own risk and discretion. The creator of this indicator shall not be held responsible for any financial losses or damages incurred as a result of using the indicator.
Kind regards,
Ely

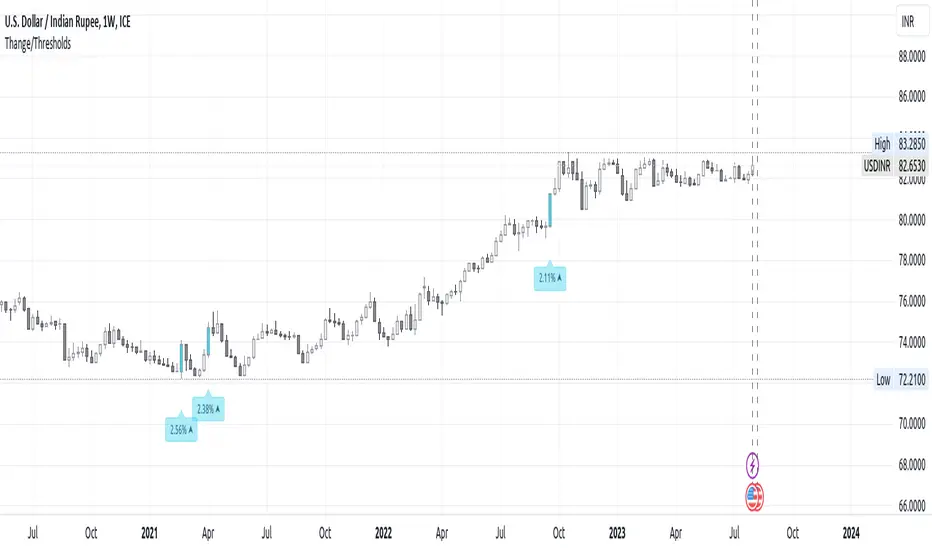
Thange Threshold Candles# Thange Threshold Candles Indicator
Identify Strong Bullish and Bearish Candles
The `Thange Threshold Candles indicator` is a small tool designed to identify candles which are above or below the configured threshold size. By analyzing the size of candles in higher timeframes (say Weekly/Monthly) one can confirm whether there was a momentum or consolidation.
> Disclaimer: This indicator should be used as a tool for technical analysis and does not guarantee specific trading outcomes. Users should exercise their own discretion and risk management when making trading decisions based on this indicator.
I hope that the Thange Momentum Kicks indicator enhances your trading experience and helps you identify strong bullish and bearish candles with ease. Happy trading!
%-[Guz] Vortex Indicator Custom// Custom Vortex Strategy (backtester)
// Custom version of the Vortex indicators that adds many features:
// -Triggers trades after a threshold is reached instead of the normal vortex lines cross (once the difference between the 2 lines is important enough)
// -Smooths the Vortex lines with an EMA
// -Adds Take Profit and Stop Loss selection
// -Adds the possibility to go Long only, Short only or both of them
// ! notice that it uses 10% position size and 0.04% trade fee, found on some crypto exchanges futures contracts
// Allows testing leverage with position size modification (values above 100% position size, to be done with caution)
// Not an investment advice

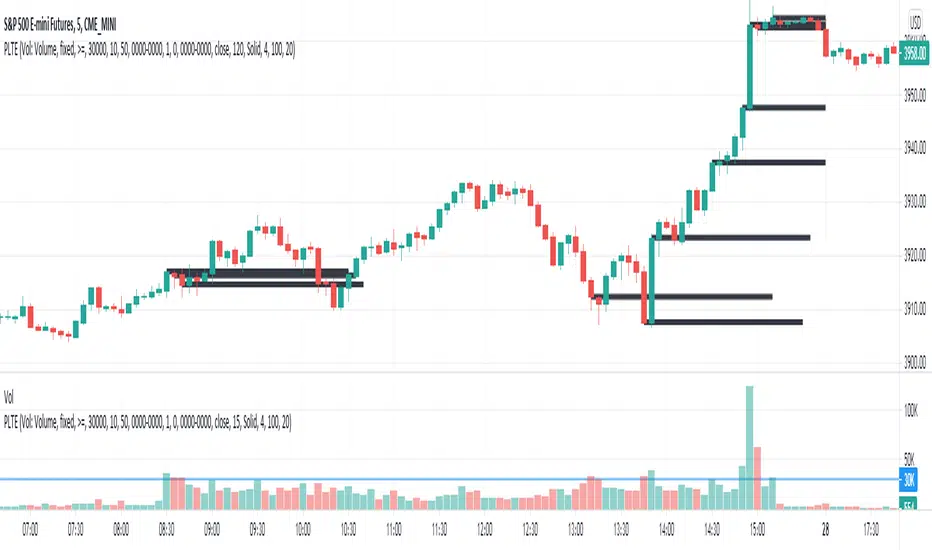
Plot Level on Threshold ExceedThis script plots a line for X minutes, when the given reference source (which could be another indicator like volume, etc), exceeds the fixed value threshold.
There is a line limit in TV, so only the most recent 40 lines are plotted
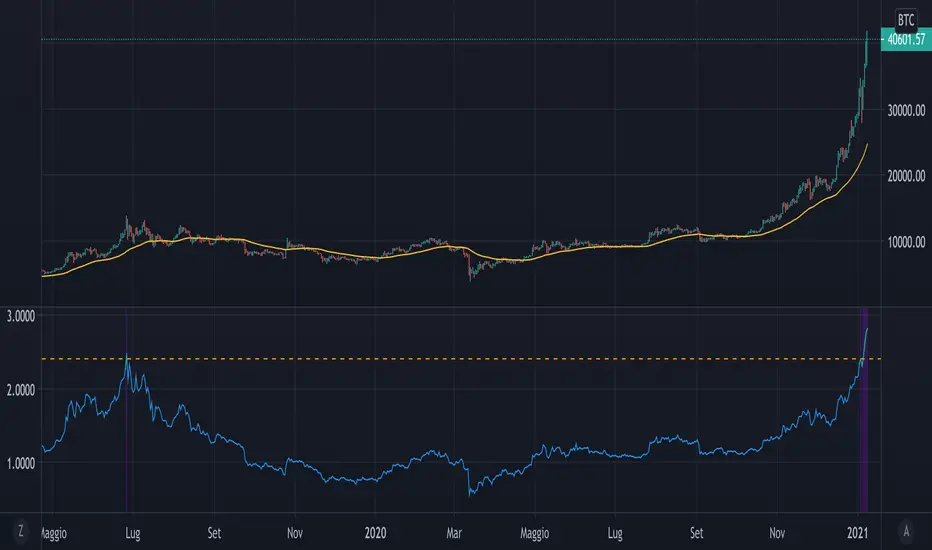
Mayer MultipleThe script implements a custom version of the Mayer multiple and it may be useful for analyzing the price of Bitcoin in a historical context.
Note n.1: Mayer multiple does not tell whether to buy, sell or hold, but highlights the best long-term area when the bitcoin price is below a threshold value (2.4).
Note n.2: the threshold value (2.4) has been determined in the past by simulations performed.
The script user may decide whether to use the shown graph or another graph for the calculation of the Mayer multiple.
The script is very easy to use and it is possible to change the following parameters:
the period of SMA (default value is 200)
the threshold (default value 2.4)
Show or not the sell area
Use or not the shown graph to calculate the Mayer multiple (default value is true)
name of exchange to use for calculation of the Mayer multiple (default value is BNC)
name of chart to use for calculation of the Mayer multiple (default value is BLX)
Simple Study for Sean (threshold-triggered alert)This script illustrates how to create simple alerts, triggered by a share price moving above (or below) an arbitrary threshold.

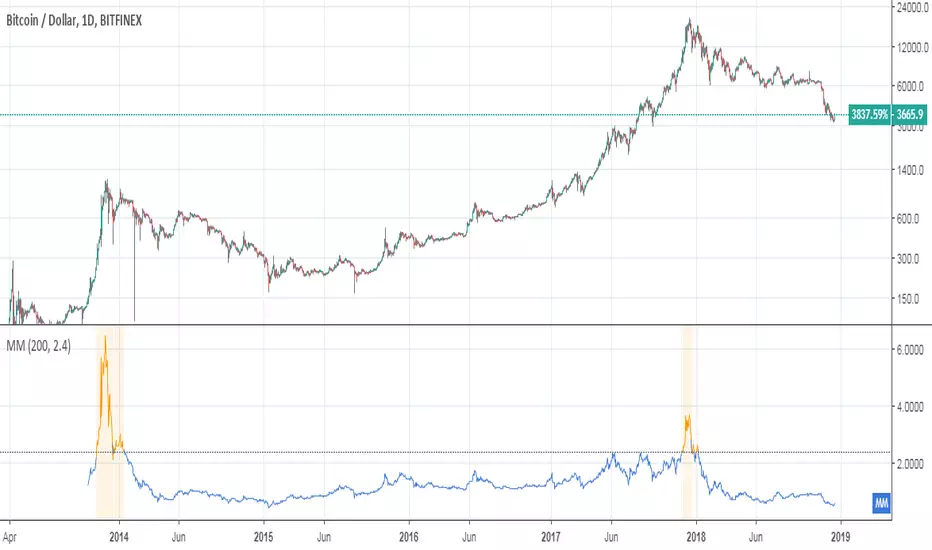
Mayer MultipleThis indicator was created by Trace Mayer as a way to analyze the price of Bitcoin in a historical context. Consider it as a kind of Volatility Ratio that was created by Jack Schwager for the securities.
To learn more about Mayer Multiple see:
charts.woobull.com
mayermultiple.info
www.theinvestorspodcast.com
Good luck!
Barssince Playground (Threshold & Persistence)Playground file for implementing MACD with threshold values while visualizing the persistence plot, which counts the amount of spent bars since the MACD delta crossed 0 value in either way.
