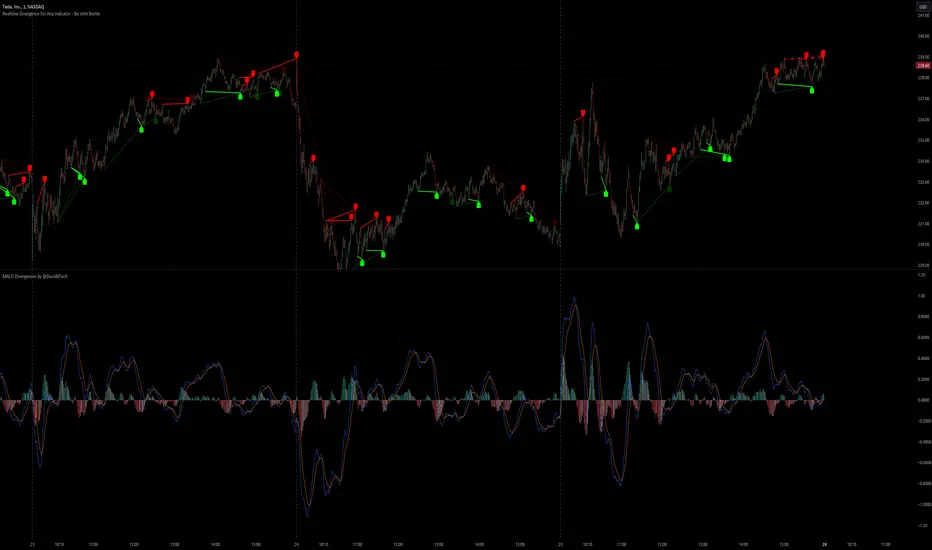
Realtime Divergence for Any Indicator - By John BartleThe main purpose of this script is to show historical and real-time divergences for any oscillating indicator. The secondary purpose is to give the user a lot of precise control over identifying divergences and determining what they are. This is an improved version of my other script which is similarly called "Realtime Divergence for Any Indicator"
There are four types of divergences that are offered:
Bull divergence
Hidden bull divergence
Bear divergence
Hidden Bear divergence
There are three types of potential(real-time) divergences which include:
1) Without right side bars for rightside pivots. Plus without waiting for the rightside pivot bar to complete
2) Without right side bars for rightside pivots. Plus with waiting for the rightside pivot bar to complete
3) With right side bars for rightside pivots. Plus without waiting for the rightside pivot right-most bar to complete
A definite divergence occurs when all specified bars are accounted for and fully formed.
Potential divergences use dashed lines and definite(historical) divergences use solid lines.
In addition to several other categories of settings to filter out unwanted divergences or manipulate the search process, this script also offers Alerts. Remember that alerts must not only be set within this scripts settings but also your "Alerts" panel on your right. It's strange but BOTH must be set for alerts to work...
Other interesting Things To Know:
1)I actually don't trade and so I have no need of a paid account. Unpaid accounts don't have the playback feature so I haven't really tested this script out very well. Sorry. Just let me know if something seems off and IF I have time I'll try to fix it.
2)Keep in mind that Pinescript limits the number of lines that can be shown at one time. This means that if your settings allow for a large number of divergence lines they will be removed from the leftward side of your chart but appear in the rightward side.
3) The time and the values for the price or oscillator are not the same things as each other nor are they physical things with physical space. This means that slopes of lines using the time as X and value as Y can not have definite angles. Consequently, under the setting "DIVERGENCES: SLOPE ANGLE EXCLUSION" YOU have to decide what slope equals what angle by using the setting called "Normalization Factor".
4) Remember that some individual settings apply to both the oscillator and price chart. This means that even if the setting's conditions are fulfilled in one they may not be fulfilled in the other.
5) Under the category "DIVERGENCES: INTERSECTION ALLOWANCE", if you set the "Measurement Type" to Relative Percentage then FYI any single given length will equate to an increasingly smaller percentage the further away from zero it is. Because of this, I think "Reletive Percentage" is probably only useful for price charts or oscillators with big values. Maybe >200 is OK ?
Errors:
1) If you get the error mentioning that the script must complete execution within X amount of time, this is because this is a big script and sometimes takes longer than your service plan's allotted time limit. You can just disable some of the settings to reduce the scripts amount of work and time. The biggest time savers will be to disable some lines and labels
2) If you get an error saying the script accessed a negative index(e.g. ) then try temporarily increasing the "Add More Array Elements" setting to 100-200. Sometimes it fixes the problem.
3) You may sometimes temporarily get an error that reads: "Pine cannot determine the referencing length of a series. Try using max_bars_back in the study or strategy function".
If this happens there are several things that you can do:
3A) Create a copy of my script. Then edit the section of code that looks like this ")//, max_bars_back = INSERT_YOUR_QUANTITY_HERE)" and transform it to look like this new code ", max_bars_back = INSERT_YOUR_QUANTITY_HERE)" then repeatedly try replacing "INSERT_YOUR_QUANTITY_HERE" with an increasingly larger number greater than 244 but less than 5000.
This method will increase your system resources and could cause other problems. Try changing the code back after a few hours and see if all is well again. It is a Pinescript limitation issue and happens when certain functions or variables don't get used at least once within the first 244 bars.
3B) Adjust your settings to hopefully find a divergence within the first 244 bars. If one is found then the problematic variables or functions should get used and the Pinescript 244 bar limitation should be temporarily resolved.
3C) Wait for X number of new bars to occur. If a divergence is eventually found within the first 244 bars that should solve the issue.
Tips:
1) If the amount that a setting changes value is undesirable for each time you click it then you can change that amount in the code. To do that, you'll need your own copy of my script. To make your own copy just click on "create a working copy" in the brown colored strip area above the code. Then within approximately the first 108 lines find the title of the setting you want to change. Then look to it's right to find the parameter called "step =". Change what the step equals to whatever you want. FYI, you can hover your mouse over the blue colored code and a popup will tell you what parameters(i.e. settings) that function(e.g. "input.int()") has available.
時間
Papercuts Time Sampled Higher Timeframe EMA Without SecurityThis EMA uses a higher time sampled method instead of using security to gather higher timeframe data.
Its quite fast and worked well with the timeframes prescribed, up to 8hrs, after 8hrs, the formatting gets more complicated and i probably wouldn't use it anyway.
You can use this as a guide to avoid security and even f_security with this method.
NOTE: This includes the non repainting f_security call so that i woudl be able to check my results against what it does, thats not nessecary to keep at all.
There is some minor differences in data, but its so minor it doesnt bother me, though it would be interesting to know what the difference actually is. If anyone figures that out, leave a comment and let me know!
This is meant to be an example for others to build and learn and play with.. so enjoy!

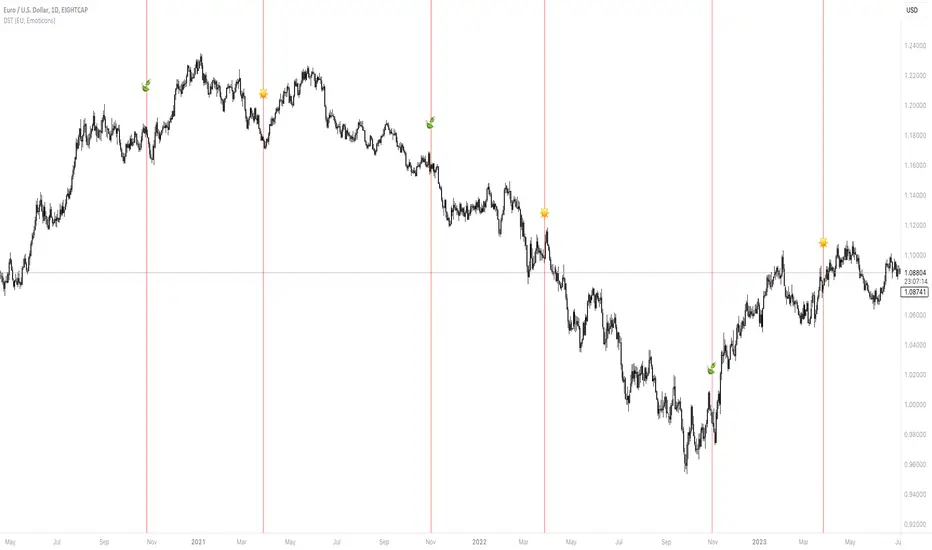
Daylight Saving Time [Open Source]Are you tired of manually tracking daylight saving time transitions on your trading charts? Say goodbye to confusion and hello to a smarter approach with our innovative indicator.
Designed to streamline your trading experience, this indicator automatically detects and highlights the exact moments when daylight saving time shifts occur, ensuring you stay on top of time changes without the hassle.
Key Features:
Customizable Display: Choose between two distinct display modes - "Flag" or "Emoticons" - to suit your visual preference and enhance your chart's clarity.
Global Compatibility: Tailor the indicator to your region by selecting your country for daylight saving time calculations. Choose from popular options like the European Union (EU) or the United States and Canada (US_CA).
Seamless Transitions: No more guessing when daylight saving time starts or ends. Our indicator will automatically mark the transition points, helping you to avoid costly trading mistakes due to incorrect time calculations.
Background Coloring: Elevate your chart's visibility by optionally coloring the background during the transition periods. With a simple toggle, you can make sure you never miss an important shift.
Experience a new level of trading precision and accuracy with the "Daylight Saving Time Indicator". Take control of your trading strategy by focusing on the market instead of time changes. Try it now and witness the difference it makes in your trading routine!
About Daylight Saving Time:
Daylight Saving Time (DST) is a practice observed by many countries to make better use of daylight during the longer days of summer. The EU and California (US_CA) have specific rules for DST transitions:
EU DST Rules:
DST begins on the last Sunday of March.
DST ends on the last Sunday of October.
US_CA DST Rules:
DST begins on the second Sunday of March.
DST ends on the first Sunday of November.
About the code
The code is briefly commented. Please feel free to use or further customize it ... And, of course, I would be happy to be named and/or linked. If you're satisfied, maybe buy me a coffee ;-)
I'm curious to see how this indicator will develop with more ideas - Please keep me updated by commenting below or by sending me a message.
Time Cycles IndicatorThis script is used to analyze the seasonality of any asset (commodities, stocks, indices).
To use the script select a timeframe D or W and select the months you are interested in the script settings. You will see all the candles that are part of those months highlighted in the chart.
You can use this script to understand if assets have a cyclical behavior in certain months of the year.

Day of Month - Volatility Report█ OVERVIEW
The indicator analyses the volatility and reports the statistics by the days of the month.
█ CONCEPTS
The markets move every day. But how does a market move during a month?
Here are some ideas to explore:
Does the volatility kick in with the start of a new month?
Do the markets slow down at the end of the month?
Which period of the month is the most volatile?
How does this relate to your best and worst trades?
When should you take a break?
DAX
EURGBP
Binance Coin
█ FEATURES
Comparison modes
Compare how each day moves relative to the monthly volatility or the average daily volatility.
Configurable outputs
Output the report statistics as mean or median.
Range filter
Select the period to report from.
█ HOW TO USE
Plot the indicator and visit the 1D, 24H, or 1440 minutes timeframe.
█ NOTES
Gaps
The indicator includes the volatility from gaps.
Trading session
The indicator analyses each day from the daily chart, defined by the exchange trading session (see Symbol Info).
Extended trading session
The indicator can include the extended hours when activated on the chart, using the 24H or 1440 minutes timeframe.
Overnight session
The indicator supports overnight sessions (open and close on different calendar days). For example, EURUSD will report Monday’s volatility from Sunday open at 17:00 to Monday close at 17:00.
This is a PREMIUM indicator. In complement, you might find useful my free Time of Day - Volatility Report .
Time Profile [QuantVue]The Time Profile indicator provides traders with a comprehensive view of volume and time-based price activity. The indicator combines two essential components into one indicator: the volume profile and the time profile.
The volume profile represents the distribution of trading volume at different price levels over a specified period and is displayed as a circle on the chart.
It provides a visual representation of where the majority of trading volume occurred and often highlights significant support and resistance levels. The volume profile is calculated as the closing price of the highest volume intraday bar, based on the user selected lower time frame.
On the other hand, the time profile focuses on analyzing the time spent at certain price levels. The indicator divides the current bars range into 10 blocks and counts the number of user selected lower time frame closes within each time block.
The block with the most lower time frame closes in it is deemed the time point of control. Traders can use this information to identify time blocks where price movement was most significant.
The time profile is drawn on the Y axis of the current bar to allow for an easy visualization of where price spent most of its time. Historical time profiles are also noted on previous bars with a dash marking the level.
The Time Profile indicator offers several customization options. Traders can adjust the timeframe for the lower time frame data, decide whether to display the time profile, and customize colors for visual clarity.
Additionally, traders can choose to highlight instances where the Volume POC and Time POC align, indicating a strong concentration of volume and price activity.
Don't hesitate to reach out with any questions or concerns.
We hope you enjoy!
Cheers.

Script TimerWanna know how long your script takes to execute.
Just put this function at the end of your code and it will tell you how much time it takes to run your algo from start to end.
Data will show in the data window panel measured in seconds
Draw Line For High Low Custom Range Interactive█ OVERVIEW
This indicator is an educational indicator to make pine coders easier to how to use interactive inputs with User-Defined Type (UDT) especially when dealing input.time.
█ NOTES
This indicator is not perfect but it is a good starting point or template to start develop custom range interactive indicator.
█ INSPIRATIONS
ABC 123 Harmonic Ratio Custom Range Interactive
XABCD Harmonic Pattern Custom Range Interactive
PriceTimeInteractive
█ CREDITS
CAGR Custom Range
Pine scripts are now interactive
█ FEATURES
1. High Low points are determined based on points selected.
2. Line will be drawn after points are correctly arranged.
3. Label show error once wrong point is selected, move the point as instructed in example.
█ EXAMPLES / USAGE

ICT Time Windows by Scuba SteveJust an easy to use time based indicator that allows you to track ICT London Open Killzone, New York Open killzone, AM session Silver Bullet time window & PM Session Silver Bullet Time Window, and last but not least the Last Hour of trading which often has nice moves.

time between close 1.0 - find active charts
Title: Time Between Close (TBC) Indicator
Description:
The Time Between Close (TBC) Indicator is designed to help traders visualize the time between candle closes in seconds. The timeframe option default is set to 1 second. This is in order to check how often a candle is produced on the one second timeframe regardless of what timeframe your chart is on. These values of time between candles are then averaged using the moving average length.
So if you have a moving average length of 60, it will look at the past 60 candles and count the time between each candle, and give you an average in seconds. The shortest time between candles that it can go is 1 second.
The increment option should only be adjusted to a higher timeframes when you need to see further back because the existing plot is very short.
Note, this indicator is not suitable for BTC as BTC generally always has several ticks per second and the indicator will always show up as 1 second.
1. Timeframe options: Set the timeframe for measuring the time between candle closes (default: 1 second).
2. Moving average length: Choose between simple moving average (SMA) or exponential moving average (EMA) for calculating the average time between candle closes.
3. Time increment option: Adjust the time increment for the color gradient (default: 5 seconds). Increase this value for higher timeframes to see further back when the existing plot is too short.
4. Customizable label sizes, label distances, and horizontal line transparencies.
To get an idea of the gradient,
These are the colors from fastest moving to slowest:
Blue
Light Blue
Cyan
Light Green
Green
Yellow-Green
Yellow
Orange
Red-Orange
Red

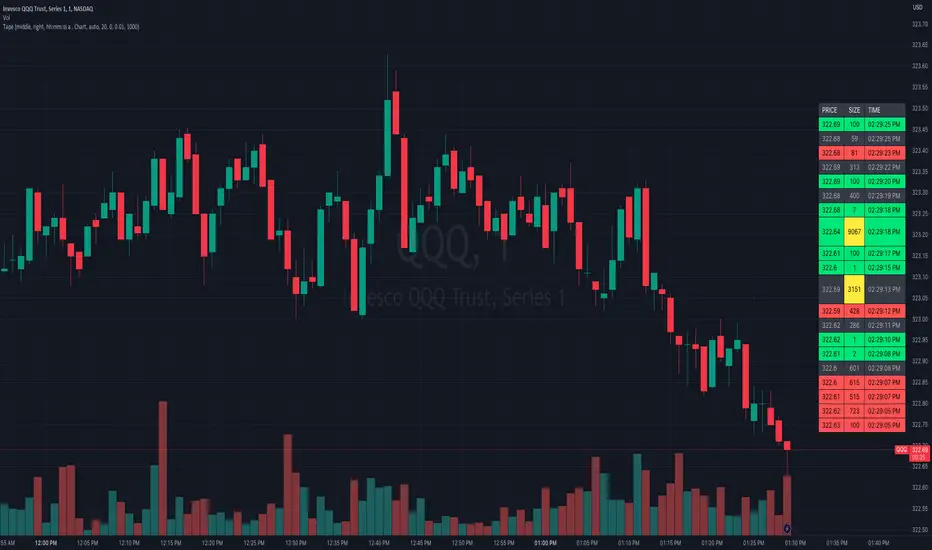
Tape (Time and Sales)OVERVIEW
This indicator is a synthesized "Tape" (aka. Time and Sales) from real time market data. It's specifically designed to be performant, expediting trading insights and decisions.
The table contains color-coded price action, volume size, and a timestamp data for each chart update. Because chart updates are independent of exchange orders, 1 chart update may combine more than 1 exchange and/or order. Even so, you're able to see very small and fast order flow changes, made possible by measuring real time volume differentials, and correlating them with price action.
Real time volume differentials are required for this indicator to be most useful. This is not ideal for historical analysis or TradingViews Replay feature.
INPUTS
You can can configure:
Table Position and Text Size
The Timestamp (visibility, format, timezone)
The number of lines to print
Volume Parameters (minimum size, large sizes, decimal precision)
Highlighting and Enlarging large sized prints
All the colors
DEV NOTES
This script illustrates:
The complimentary nature of loops and arrays
A method for iterative table management
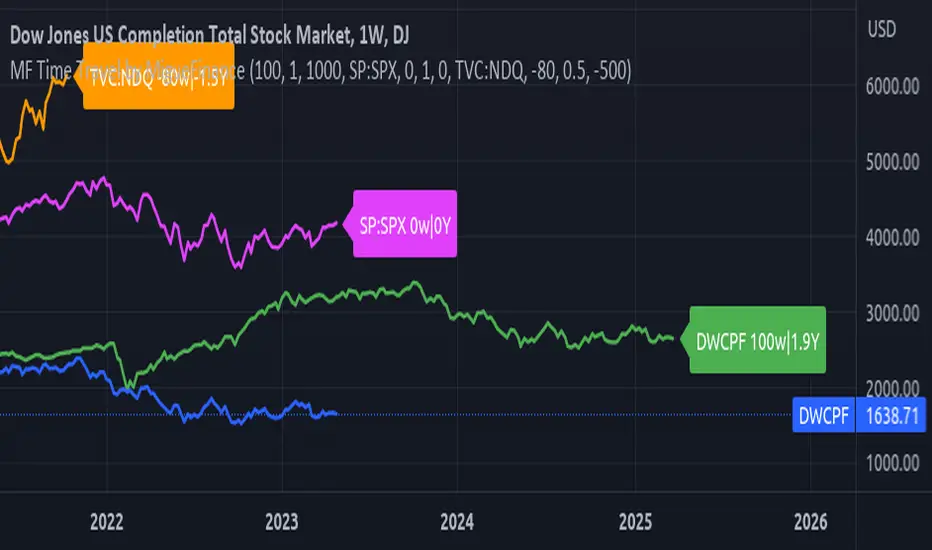
MF Time Travel (Delay or Forward Charts) by MigueFinanceThis indicator allows you to "Time Travel" aka. delay or advance (or forward) the on-screen chart/indicator as well as well as to do the same with other additional charts that can be configured in the settings.
This might be very useful when comparing with other (or the same) indicator in time, if you consider probably an incoming move based on another time performance.
About the Settings:
The moved in time charts can also be expanded or contracted, as well as they can be moved vertically (offset).
To Delay put positive values on the weeks settings, to Advance put Negative values on the same.
The Expansion or Contraction Factor is simply a multiplier of amplitude so you can multiply by number like 0.5, 2, etc
The Vertical Offset simply moves up and down the indicator.
The Labels will also tell you the number of weeks and years that were changed so as to have a reference, as well as the indicator being used.
MathEasingFunctionsLibrary "MathEasingFunctions"
A collection of Easing functions.
Easing functions are commonly used for smoothing actions over time, They are used to smooth out the sharp edges
of a function and make it more pleasing to the eye, like for example the motion of a object through time.
Easing functions can be used in a variety of applications, including animation, video games, and scientific
simulations. They are a powerful tool for creating realistic visual effects and can help to make your work more
engaging and enjoyable to the eye.
---
Includes functions for ease in, ease out, and, ease in and out, for the following constructs:
sine, quadratic, cubic, quartic, quintic, exponential, elastic, circle, back, bounce.
---
Reference:
easings.net
learn.microsoft.com
ease_in_sine_unbound(v)
Sinusoidal function, the position over elapsed time (unbound).
Parameters:
v (float) : `float` Elapsed time.
Returns: Ratio of change.
ease_in_sine(v)
Sinusoidal function, the position over elapsed time (bound).
Parameters:
v (float) : `float` Elapsed time.
Returns: Ratio of change.
ease_out_sine_unbound(v)
Sinusoidal function, the position over elapsed time (unbound).
Parameters:
v (float) : `float` Elapsed time.
Returns: Ratio of change.
ease_out_sine(v)
Sinusoidal function, the position over elapsed time (bound).
Parameters:
v (float) : `float` Elapsed time.
Returns: Ratio of change.
ease_in_out_sine_unbound(v)
Sinusoidal function, the position over elapsed time (unbound).
Parameters:
v (float) : `float` Elapsed time.
Returns: Ratio of change.
ease_in_out_sine(v)
Sinusoidal function, the position over elapsed time (bound).
Parameters:
v (float) : `float` Elapsed time.
Returns: Ratio of change.
ease_in_quad_unbound(v)
Quadratic function, the position equals the square of elapsed time (unbound).
Parameters:
v (float) : `float` Elapsed time.
Returns: Ratio of change.
ease_in_quad(v)
Quadratic function, the position equals the square of elapsed time (bound).
Parameters:
v (float) : `float` Elapsed time.
Returns: Ratio of change.
ease_out_quad_unbound(v)
Quadratic function, the position equals the square of elapsed time (unbound).
Parameters:
v (float) : `float` Elapsed time.
Returns: Ratio of change.
ease_out_quad(v)
Quadratic function, the position equals the square of elapsed time (bound).
Parameters:
v (float) : `float` Elapsed time.
Returns: Ratio of change.
ease_in_out_quad_unbound(v)
Quadratic function, the position equals the square of elapsed time (unbound).
Parameters:
v (float) : `float` Elapsed time.
Returns: Ratio of change.
ease_in_out_quad(v)
Quadratic function, the position equals the square of elapsed time (bound).
Parameters:
v (float) : `float` Elapsed time.
Returns: Ratio of change.
ease_in_cubic_unbound(v)
Cubic function, the position equals the cube of elapsed time (unbound).
Parameters:
v (float) : `float` Elapsed time.
Returns: Ratio of change.
ease_in_cubic(v)
Cubic function, the position equals the cube of elapsed time (bound).
Parameters:
v (float) : `float` Elapsed time.
Returns: Ratio of change.
ease_out_cubic_unbound(v)
Cubic function, the position equals the cube of elapsed time (unbound).
Parameters:
v (float) : `float` Elapsed time.
Returns: Ratio of change.
ease_out_cubic(v)
Cubic function, the position equals the cube of elapsed time (bound).
Parameters:
v (float) : `float` Elapsed time.
Returns: Ratio of change.
ease_in_out_cubic_unbound(v)
Cubic function, the position equals the cube of elapsed time (unbound).
Parameters:
v (float) : `float` Elapsed time.
Returns: Ratio of change.
ease_in_out_cubic(v)
Cubic function, the position equals the cube of elapsed time (bound).
Parameters:
v (float) : `float` Elapsed time.
Returns: Ratio of change.
ease_in_quart_unbound(v)
Quartic function, the position equals the formula `f(t)=t^4` of elapsed time (unbound).
Parameters:
v (float) : `float` Elapsed time.
Returns: Ratio of change.
ease_in_quart(v)
Quartic function, the position equals the formula `f(t)=t^4` of elapsed time (bound).
Parameters:
v (float) : `float` Elapsed time.
Returns: Ratio of change.
ease_out_quart_unbound(v)
Quartic function, the position equals the formula `f(t)=t^4` of elapsed time (unbound).
Parameters:
v (float) : `float` Elapsed time.
Returns: Ratio of change.
ease_out_quart(v)
Quartic function, the position equals the formula `f(t)=t^4` of elapsed time (bound).
Parameters:
v (float) : `float` Elapsed time.
Returns: Ratio of change.
ease_in_out_quart_unbound(v)
Quartic function, the position equals the formula `f(t)=t^4` of elapsed time (unbound).
Parameters:
v (float) : `float` Elapsed time.
Returns: Ratio of change.
ease_in_out_quart(v)
Quartic function, the position equals the formula `f(t)=t^4` of elapsed time (bound).
Parameters:
v (float) : `float` Elapsed time.
Returns: Ratio of change.
ease_in_quint_unbound(v)
Quintic function, the position equals the formula `f(t)=t^5` of elapsed time (unbound).
Parameters:
v (float) : `float` Elapsed time.
Returns: Ratio of change.
ease_in_quint(v)
Quintic function, the position equals the formula `f(t)=t^5` of elapsed time (bound).
Parameters:
v (float) : `float` Elapsed time.
Returns: Ratio of change.
ease_out_quint_unbound(v)
Quintic function, the position equals the formula `f(t)=t^5` of elapsed time (unbound).
Parameters:
v (float) : `float` Elapsed time.
Returns: Ratio of change.
ease_out_quint(v)
Quintic function, the position equals the formula `f(t)=t^5` of elapsed time (bound).
Parameters:
v (float) : `float` Elapsed time.
Returns: Ratio of change.
ease_in_out_quint_unbound(v)
Quintic function, the position equals the formula `f(t)=t^5` of elapsed time (unbound).
Parameters:
v (float) : `float` Elapsed time.
Returns: Ratio of change.
ease_in_out_quint(v)
Quintic function, the position equals the formula `f(t)=t^5` of elapsed time (bound).
Parameters:
v (float) : `float` Elapsed time.
Returns: Ratio of change.
ease_in_expo_unbound(v)
Exponential function, the position equals the exponential formula of elapsed time (unbound).
Parameters:
v (float) : `float` Elapsed time.
Returns: Ratio of change.
ease_in_expo(v)
Exponential function, the position equals the exponential formula of elapsed time (bound).
Parameters:
v (float) : `float` Elapsed time.
Returns: Ratio of change.
ease_out_expo_unbound(v)
Exponential function, the position equals the exponential formula of elapsed time (unbound).
Parameters:
v (float) : `float` Elapsed time.
Returns: Ratio of change.
ease_out_expo(v)
Exponential function, the position equals the exponential formula of elapsed time (bound).
Parameters:
v (float) : `float` Elapsed time.
Returns: Ratio of change.
ease_in_out_expo_unbound(v)
Exponential function, the position equals the exponential formula of elapsed time (unbound).
Parameters:
v (float) : `float` Elapsed time.
Returns: Ratio of change.
ease_in_out_expo(v)
Exponential function, the position equals the exponential formula of elapsed time (bound).
Parameters:
v (float) : `float` Elapsed time.
Returns: Ratio of change.
ease_in_circ_unbound(v)
Circular function, the position equals the circular formula of elapsed time (unbound).
Parameters:
v (float) : `float` Elapsed time.
Returns: Ratio of change.
ease_in_circ(v)
Circular function, the position equals the circular formula of elapsed time (bound).
Parameters:
v (float) : `float` Elapsed time.
Returns: Ratio of change.
ease_out_circ_unbound(v)
Circular function, the position equals the circular formula of elapsed time (unbound).
Parameters:
v (float) : `float` Elapsed time.
Returns: Ratio of change.
ease_out_circ(v)
Circular function, the position equals the circular formula of elapsed time (bound).
Parameters:
v (float) : `float` Elapsed time.
Returns: Ratio of change.
ease_in_out_circ_unbound(v)
Circular function, the position equals the circular formula of elapsed time (unbound).
Parameters:
v (float) : `float` Elapsed time.
Returns: Ratio of change.
ease_in_out_circ(v)
Circular function, the position equals the circular formula of elapsed time (bound).
Parameters:
v (float) : `float` Elapsed time.
Returns: Ratio of change.
ease_in_back_unbound(v)
Back function, the position retreats a bit before resuming (unbound).
Parameters:
v (float) : `float` Elapsed time.
Returns: Ratio of change.
ease_in_back(v)
Back function, the position retreats a bit before resuming (bound).
Parameters:
v (float) : `float` Elapsed time.
Returns: Ratio of change.
ease_out_back_unbound(v)
Back function, the position retreats a bit before resuming (unbound).
Parameters:
v (float) : `float` Elapsed time.
Returns: Ratio of change.
ease_out_back(v)
Back function, the position retreats a bit before resuming (bound).
Parameters:
v (float) : `float` Elapsed time.
Returns: Ratio of change.
ease_in_out_back_unbound(v)
Back function, the position retreats a bit before resuming (unbound).
Parameters:
v (float) : `float` Elapsed time.
Returns: Ratio of change.
ease_in_out_back(v)
Back function, the position retreats a bit before resuming (bound).
Parameters:
v (float) : `float` Elapsed time.
Returns: Ratio of change.
ease_in_elastic_unbound(v)
Elastic function, the position oscilates back and forth like a spring (unbound).
Parameters:
v (float) : `float` Elapsed time.
Returns: Ratio of change.
ease_in_elastic(v)
Elastic function, the position oscilates back and forth like a spring (bound).
Parameters:
v (float) : `float` Elapsed time.
Returns: Ratio of change.
ease_out_elastic_unbound(v)
Elastic function, the position oscilates back and forth like a spring (unbound).
Parameters:
v (float) : `float` Elapsed time.
Returns: Ratio of change.
ease_out_elastic(v)
Elastic function, the position oscilates back and forth like a spring (bound).
Parameters:
v (float) : `float` Elapsed time.
Returns: Ratio of change.
ease_in_out_elastic_unbound(v)
Elastic function, the position oscilates back and forth like a spring (unbound).
Parameters:
v (float) : `float` Elapsed time.
Returns: Ratio of change.
ease_in_out_elastic(v)
Elastic function, the position oscilates back and forth like a spring (bound).
Parameters:
v (float) : `float` Elapsed time.
Returns: Ratio of change.
ease_in_bounce_unbound(v)
Bounce function, the position bonces from the boundery (unbound).
Parameters:
v (float) : `float` Elapsed time.
Returns: Ratio of change.
ease_in_bounce(v)
Bounce function, the position bonces from the boundery (bound).
Parameters:
v (float) : `float` Elapsed time.
Returns: Ratio of change.
ease_out_bounce_unbound(v)
Bounce function, the position bonces from the boundery (unbound).
Parameters:
v (float) : `float` Elapsed time.
Returns: Ratio of change.
ease_out_bounce(v)
Bounce function, the position bonces from the boundery (bound).
Parameters:
v (float) : `float` Elapsed time.
Returns: Ratio of change.
ease_in_out_bounce_unbound(v)
Bounce function, the position bonces from the boundery (unbound).
Parameters:
v (float) : `float` Elapsed time.
Returns: Ratio of change.
ease_in_out_bounce(v)
Bounce function, the position bonces from the boundery (bound).
Parameters:
v (float) : `float` Elapsed time.
Returns: Ratio of change.
select(v, formula, effect, bounded)
Parameters:
v (float)
formula (string)
effect (string)
bounded (bool)

Sessions - AlgoLabA script in UTC for London, New York, Tokyo, & Sydney sessions.
Recommended on any timeframe < 1H.
---
Using this script, a box is plotted on the opening candle of each session; this can show us valuable areas on each chart where price may mediate to show a standing move.
You may also select each of the session boxes, in the settings; this will show you a box of the opening, low, high, and close of each selected sessions.
Each and all boxes are closed at the end of each session.
-The script produces a time table that will show you when each session occurs, and if the current time is within one of those sessions.
---
On this chart you can see boxes formed on the opening candles of the sessions,
London is red, New York is blue, Sydney is green, Tokyo is yellow.
-A key point to notice, before using this script, is how price may mediate around each box, before causing a move.
-Some boxes may be larger / smaller than others, due to the size of the opening candle.
---
Lots of updates to come, any recommendations? Feel free to leave a comment.
Hope it helps, enjoy!

FX Sessions & Killzones ETJust another sessions indicator. Among all the many existing ones, I didn't find anything simple that would cover my needs and that would actually be correct.
New York time is forced here for plotting the stripes so you don't need to worry about the time zone currently set on your chart. The indicator will be accurate during Daylight Saving Time (which, in 2023 for example, started on Sunday, 12 March , 02:00:00 and will be in effect until Sunday, 5 November, 02:00:00).

ICT Algorithmic Macro Tracker° (Open-Source) by toodegreesDescription:
The ICT Algorithmic Macro Tracker° Indicator is a powerful tool designed to enhance your trading experience by clearly and efficiently plotting the known ICT Macro Times on your chart.
Based on the teachings of the Inner Circle Trader , these Time windows correspond to periods when the Interbank Price Delivery Algorithm undergoes a series of checks ( Macros ) and is probable to move towards Liquidity.
The indicator allows traders to visualize and analyze these crucial moments in NY Time:
- 2:33-3:00
- 4:03-4:30
- 8:50-9:10
- 9:50-10:10
- 10:50-11:10
- 11:50-12:10
- 13:10-13:50
- 15:15-15:45
By providing a clean and clutter-free representation of ICT Macros, this indicator empowers traders to make more informed decisions, optimize and build their strategies based on Time.
Massive shoutout to @reastruth for his ICT Macros Indicator , and for allowing to create one of my own, go check him out!
Indicator Features:
– Track ongoing ICT Macros to aid your Live analysis.
- Gain valuable insights by hovering over the plotted ICT Macros to reveal tooltips with interval information.
– Plot the ICT Macros in one of two ways:
"On Chart": visualize ICT Macro timeframes directly on your chart, with automatic adjustments as Price moves.
Pro Tip: toggle Projections to see exactly where Macros begin and end without difficulty.
"New Pane": move the indicator two a New Pane to see both Live and Upcoming Macro events with ease in a dedicated section
Pro Tip: this section can be collapsed by double-clicking on the main chart, allowing for seamless trading preparation.
This indicator is available only on the TradingView platform.
⚠️ Open Source ⚠️
Coders and TV users are authorized to copy this code base, but a paid distribution is prohibited. A mention to the original author is expected, and appreciated.
⚠️ Terms and Conditions ⚠️
This financial tool is for educational purposes only and not financial advice. Users assume responsibility for decisions made based on the tool's information. Past performance doesn't guarantee future results. By using this tool, users agree to these terms.

AstroLibLibrary "AstroLib", or Astro Library, is a collection of public Pinescript functions & calculations for use in astrology & astronomy indicators. Unless noted otherwise, this library was written jointly by @badsector666 and @BarefootJoey.
Library "AstroLib"
t_(txt)
Parameters:
txt (string)
JDNv2(t, withFraction)
Parameters:
t (float)
withFraction (bool)
J2K(t)
Parameters:
t (float)
J2KtoUnix(TimeInJDN)
Parameters:
TimeInJDN (float)
atan2(y, x)
Parameters:
y (float)
x (float)
DegSin(x)
Parameters:
x (float)
DegCos(x)
Parameters:
x (float)
DegTan(x)
Parameters:
x (float)
DegArcsin(x)
Parameters:
x (float)
DegArccos(x)
Parameters:
x (float)
DegArctan(x)
Parameters:
x (float)
DegAtan2(y, x)
Parameters:
y (float)
x (float)
range2pi(x)
Parameters:
x (float)
range360(x)
Parameters:
x (float)
gst(days)
Parameters:
days (float)
DegDecimal(Degrees, Minutes, Seconds)
Parameters:
Degrees (float)
Minutes (float)
Seconds (float)
Rectangular(R, theta, phi, Index)
Parameters:
R (float)
theta (float)
phi (float)
Index (float)
rLength(x, y, z)
Parameters:
x (float)
y (float)
z (float)
spherical(x, y, z, Index)
Parameters:
x (float)
y (float)
z (float)
Index (float)
obliquity(d)
Parameters:
d (float)
requatorial(x, y, z, d, Index)
Parameters:
x (float)
y (float)
z (float)
d (float)
Index (float)
recliptic(x, y, z, d, Index)
Parameters:
x (float)
y (float)
z (float)
d (float)
Index (float)
sequatorial(R, theta, phi, d, Index)
Parameters:
R (float)
theta (float)
phi (float)
d (float)
Index (float)
secliptic(R, theta, phi, d, Index)
Parameters:
R (float)
theta (float)
phi (float)
d (float)
Index (float)
precess(d1, d2, DEC, RA, Index, ddec, dra)
Parameters:
d1 (float)
d2 (float)
DEC (float)
RA (float)
Index (float)
ddec (float)
dra (float)
riset(J2000, DEC, RA, GLat, GLong, Index)
Parameters:
J2000 (float)
DEC (float)
RA (float)
GLat (float)
GLong (float)
Index (float)
ssun(d, Index)
Parameters:
d (float)
Index (float)
rsun(d, Index)
Parameters:
d (float)
Index (float)
sun(d, Index)
Parameters:
d (float)
Index (float)
SunLongitude(d, Index)
Parameters:
d (float)
Index (float)
Sunrise(J2000, GLat, GLong, Index, altitudex)
Parameters:
J2000 (float)
GLat (float)
GLong (float)
Index (float)
altitudex (float)
smoon(dx, Index)
Parameters:
dx (float)
Index (float)
rmoon(d, Index)
Parameters:
d (float)
Index (float)
tmoon(d, GLat, GLong, Index)
Parameters:
d (float)
GLat (float)
GLong (float)
Index (float)
moon(d, Index)
Parameters:
d (float)
Index (float)
Element(d, pnum)
Parameters:
d (float)
pnum (int)
kepler(m, ecc, eps)
Parameters:
m (float)
ecc (float)
eps (float)
rplanet(d, pnumber, Index)
Parameters:
d (float)
pnumber (int)
Index (float)
planet(d, pnumber, Index)
Parameters:
d (float)
pnumber (int)
Index (float)
altaz(d, DEC, RA, GLat, GLong, Index)
Parameters:
d (float)
DEC (float)
RA (float)
GLat (float)
GLong (float)
Index (float)
prise(d, P, GLat, GLong, Index)
Parameters:
d (float)
P (int)
GLat (float)
GLong (float)
Index (float)
MoonSize(d)
Parameters:
d (float)
Refraction(Temperature_C, Atmospheric_Pressure_mBar, Altitude_Deg)
Parameters:
Temperature_C (float)
Atmospheric_Pressure_mBar (float)
Altitude_Deg (float)
MoonRise(d, Longitude, Latitude, Index)
Parameters:
d (float)
Longitude (float)
Latitude (float)
Index (float)
f_to_sec(dec)
Parameters:
dec (float)
f_to_time(sec)
Parameters:
sec (float)
deg_to_time(deg)
Parameters:
deg (float)
toDMS(coordinate)
Parameters:
coordinate (float)
convertDMS(lat, lng)
Parameters:
lat (float)
lng (float)
convlatdec(deg)
Parameters:
deg (float)
PlanetName(pnum)
Parameters:
pnum (int)
PlanetNameV(pnum)
Parameters:
pnum (int)
PlanetSign(pnum)
Parameters:
pnum (int)
PlanetColor(pnum)
Parameters:
pnum (int)
zodiaccolor(deg)
Parameters:
deg (float)
degsign(deg)
Parameters:
deg (float)
degsignf(deg)
Parameters:
deg (float)
degnash(deg)
Parameters:
deg (float)
degname(deg)
Parameters:
deg (float)
retrogradesym(deg)
Parameters:
deg (float)
degaspsign(deg)
Parameters:
deg (float)
degaspname(deg)
Parameters:
deg (float)
degaspfull(deg)
Parameters:
deg (float)
degaspfullV2(deg)
Parameters:
deg (float)
degaspnameV2(deg)
Parameters:
deg (float)
degtolowest180(deg)
Parameters:
deg (float)
degaspfullapproach(deg)
Parameters:
deg (float)
virinchiaspectcol(deg, bull_col, bear_col)
Parameters:
deg (float)
bull_col (color)
bear_col (color)
virinchiaspectemo(deg, bull_emo, bear_emo)
Parameters:
deg (float)
bull_emo (string)
bear_emo (string)
aspectfastsigndeg(deg)
Parameters:
deg (float)
aspectfastfull(deg)
Parameters:
deg (float)
aspectslowfull(deg)
Parameters:
deg (float)
aspectslowsigndeg(deg)
Parameters:
deg (float)
aspectslowsign(deg)
Parameters:
deg (float)
aspectsignprecision(deg, precision)
Parameters:
deg (float)
precision (int)
aspectsignprecisionV2(deg, precision)
Parameters:
deg (float)
precision (float)
aspectsignprecisionV2ext(deg, precision)
Parameters:
deg (float)
precision (float)
IPaspectsignprecision(planet1, planet2, precision)
Parameters:
planet1 (float)
planet2 (float)
precision (float)
IPaspectsignprecisionFull(planet1, planet2, precision)
Parameters:
planet1 (float)
planet2 (float)
precision (float)
IPaspectlineprecision(planet1, planet2, precision, style, width)
Parameters:
planet1 (float)
planet2 (float)
precision (float)
style (string)
width (int)
rDeg(deg)
Parameters:
deg (float)
AngToCirc(angle)
Parameters:
angle (float)
AngToCirc180(angle)
Parameters:
angle (float)
sidereal(deg, sidereal)
Parameters:
deg (float)
sidereal (bool)
J2000(JDN)
Parameters:
JDN (float)
JDN(t, d, tz)
Parameters:
t (float)
d (float)
tz (float)
getsun(index, day, dayr, latitude, longitude, tz)
Parameters:
index (int)
day (float)
dayr (float)
latitude (float)
longitude (float)
tz (float)
getmoon(index, day, dayr, latitude, longitude)
Parameters:
index (int)
day (float)
dayr (float)
latitude (float)
longitude (float)
getplanet(planet, index, day, dayr, latitude, longitude, tz)
Parameters:
planet (int)
index (int)
day (float)
dayr (float)
latitude (float)
longitude (float)
tz (float)

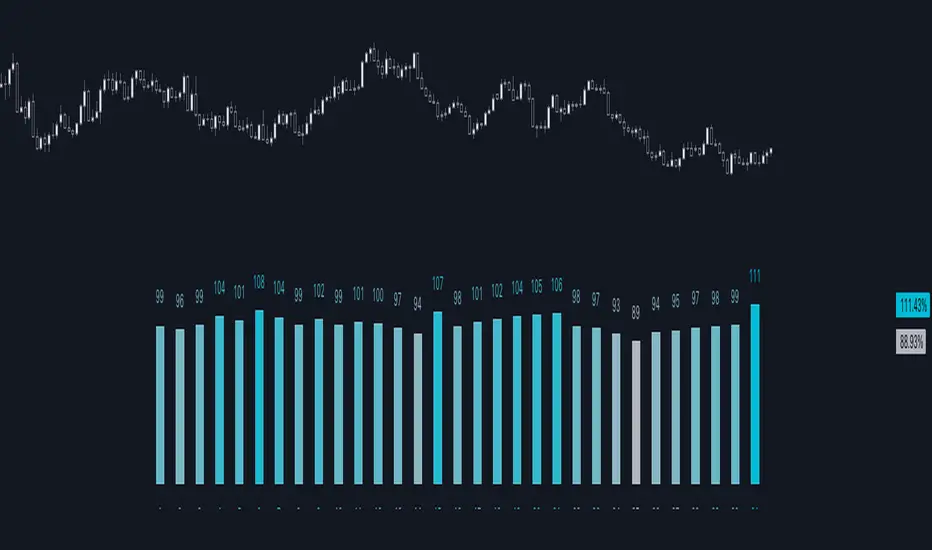
Day of Week - Volatility Report█ OVERVIEW
The indicator analyses the volatility and reports statistics by the days of the week.
█ CONCEPTS
On business days and weekends, different market participants get involved in the markets. How does this affect the markets during the week?
Here are some ideas to explore:
When are the best days for trading?
Which day of the week is the market the most volatile?
Should you trade on business days? Is it worth trading during the weekend?
How does this relate to your most profitable trades?
Is there a confluence with the days having the highest win rate?
Which days of the week should you stop trading?
Ethereum
USDCAD
NZDUSD
█ FEATURES
Configurable outputs
Output the report statistics as mean or median.
█ HOW TO USE
Plot the indicator and visit the 1D, 24H, or 1440 minutes timeframe.
█ NOTES
Gaps
The indicator includes the volatility from gaps.
Calculation
The statistics are not reported from absolute prices (does not favor trending markets) nor percentage prices (does not depict the different periods of volatility that markets can go through). Instead, the script uses the prices relative to the average range of previous weeks (weekly ATR).
Trading session
The indicator analyses weekdays from the daily chart, defined by the exchange trading session (see Symbol Info).
Extended trading session
The indicator can include the extended hours when activated on the chart, using the 24H or 1440 minutes timeframe.
Overnight session
The indicator supports overnight sessions (open and close on different calendar days). For example, EURUSD will report Monday’s volatility from Sunday open at 17:00 to Monday close at 17:00.
This is a PREMIUM indicator. In complement, you might find useful my free Time of Day - Volatility Report .

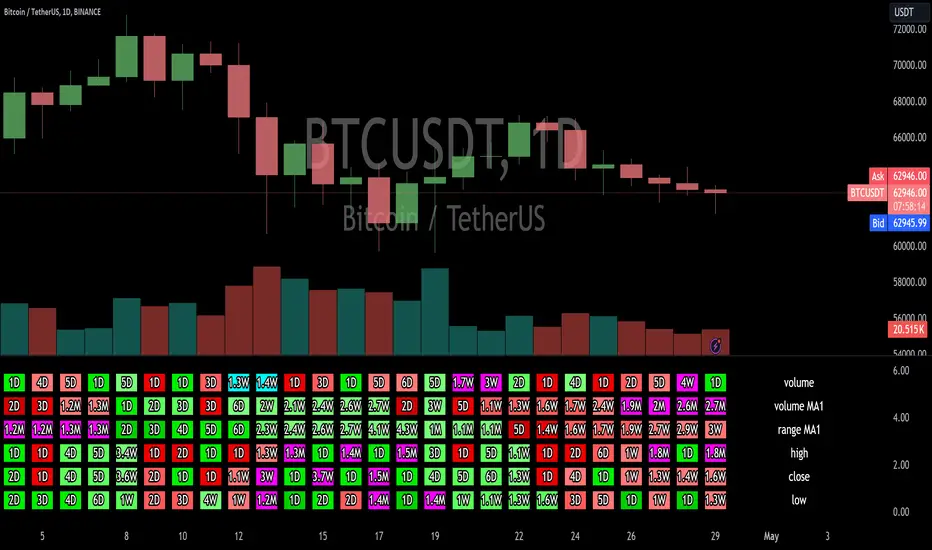
Highest/Lowest value since X time ago, various indicatorsThis script will count the bars back since the last time the current bar indicator value was either this low or this high.
It will provide the time in either, seconds, minutes, hours, days, weeks, months, or years.
please note:
There are currently no alerts setup for this script.
the length options only apply to the sources that have the "(MA)" in their name.
There is a horizontal line display issue which corrects once you adjust the amount of sources you want to use.
Once you select the amount of sources you would like to use, align the indicator so the horizontal lines match up with the table lines.
If find any bugs in the script, let me know.
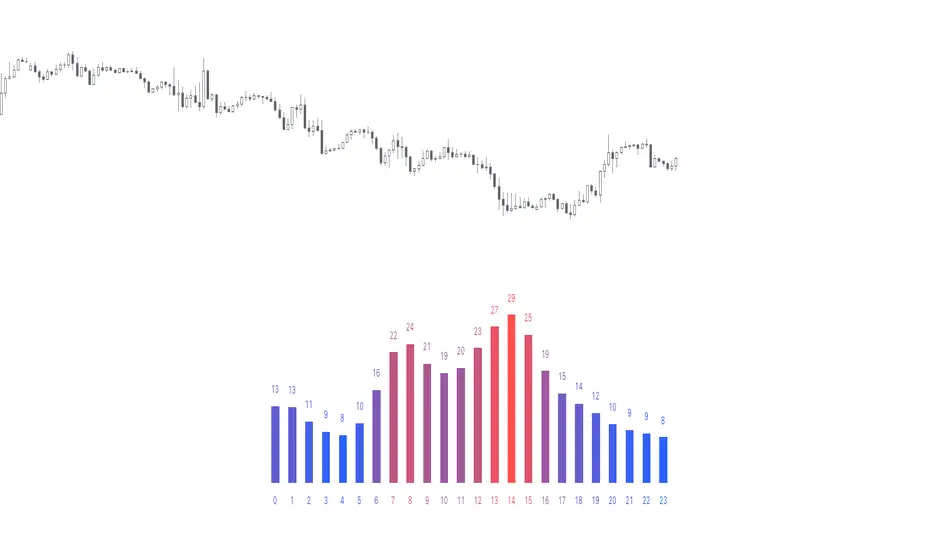
Time of Day - Volatility Report█ OVERVIEW
The indicator analyses the volatility and reports statistics by the time of day.
█ CONCEPTS
Around the world and at various times, different market participants get involved in the markets. How does this affect the market?
Knowing this gets you better prepared and improves your trading. Here are some ideas to explore:
When is the market busy and quiet?
What time is it the most volatile?
Which pairs in your watchlist are moving while you are actively trading?
Should you adjust your trading time? Should you change your trading pairs?
When does your strategy perform the best?
What entry times do your winners have in common? What about the exit times of your losers?
Is it worth keeping your trade open overnight?
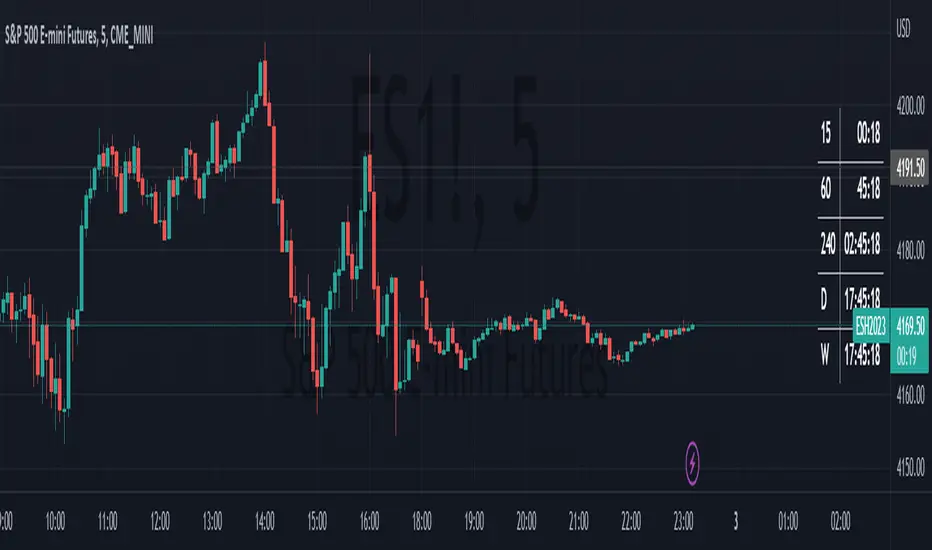
Bitcoin (UTC+0)
Gold (UTC+0)
Tesla, Inc. (UTC+0)
█ FEATURES
Selectable time zones
Display the statistics in your geographical time zone (or other market participants), the exchange time zone, or UTC+0.
Configurable outputs
Output the report statistics as mean or median.
█ HOW TO USE
Plot the indicator and visit the 1H timeframe.
█ NOTES
Gaps
The indicator includes the volatility from gaps.
Calculation
The statistics are not reported from absolute prices (does not favor trending markets) nor percentage prices (does not depict the different periods of volatility that markets can go through). Instead, the script uses the prices relative to the average range of previous days (daily ATR).
Extended trading session
The script analyses extended hours when activated on the chart.
Daylight Saving Time (DST)
The exchange time or geographical time zone selected may observe Daylight Saving Time. For example, NASDAQ:TSLA always opens at 9:30 AM New York time but may see different opening times in another part of the globe (New York time corresponds to UTC-4 and UTC-5 during the year).
ICT MacrosThis script allows traders to visualize the range of time when a macro (an automated series of instructions/trades from large fund traders, executed by an algorithm) will likely occur in the market. It does this by drawing vertical lines and labels on the chart at these specific times:
(Macro Open) - 9:50 AM EST
(Macro Close) - 10:10 AM EST
(Macro Open) - 10:50 AM EST
(Macro Close) - 11:10 AM EST
(Macro Open) - 1:10 PM EST
(Macro Close) - 1:40 PM EST
(Macro Open) - 3:15 PM EST
(Macro Close) - 3:45 PM EST
The theory behind the use of these macros - is that the market will either seek buy side or sell side liquidity, or seek to rebalance price at a point of interest in between the open and close of the macro. Traders who follow this theory can use that information to anticipate how price might behave.
When a macro occurs, the script draws a vertical line on the chart using a dotted line style with a user-defined color. Additionally, a label is placed above the line to indicate whether it is a Macro Open or Macro Close event.
To preserve space, the labels are abbreviated on chart - "Macro Open" (M.O.) and "Macro Close" (M.C.) for both the morning and afternoon trading sessions. The labels may be turned on/off by the user.
The script also includes alerts that can notify traders when a macro occurs. These alerts can be set to go off once per bar close, and the alert message indicates the specific macro type and time.
This script is entirely open-source, meaning that traders can read the code and modify it as needed. Credit to the foundation of this script goes to TradingView user @rickyzcarroll for his open source Strat Assistant Hour Flip script. Important changes include the specific time changes and alert function.

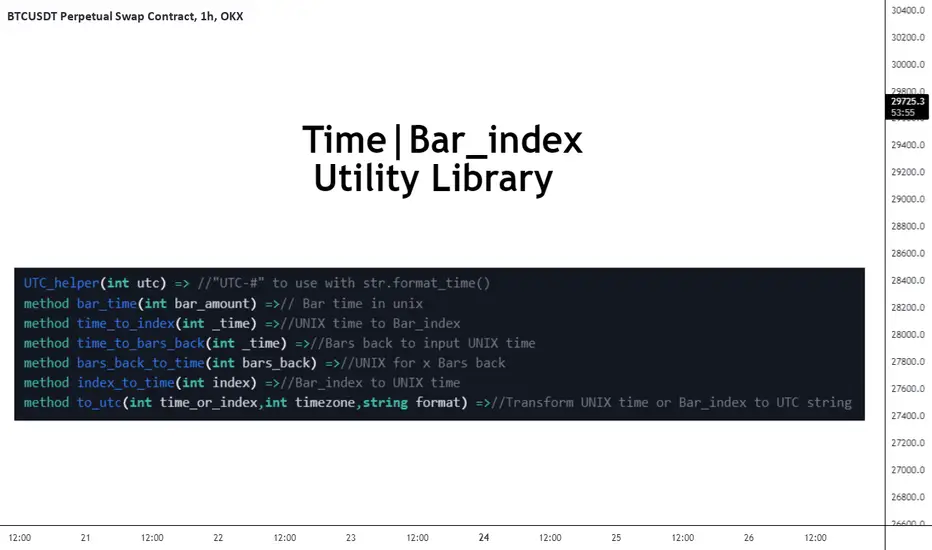
FrizLabz_Time_Utility_MethodsLibrary "FrizLabz_Time_Utility_Methods"
Some time to index and index to time helper methods made them for another library thought I would try to make
them as methods
UTC_helper(utc)
UTC helper function this adds the + to the positive utc times, add "UTC" to the string
and can be used in the timezone arg of for format_time()
Parameters:
utc : (int) | +/- utc offset
Returns: string | string to be added to the timezone paramater for utc timezone usage
bar_time(bar_amount)
from a time to index
Parameters:
bar_amount : (int) | default - 1)
Returns: int bar_time
time_to_index(_time)
from time to bar_index
Parameters:
_time : (int)
Returns: int time_to_index | bar_index that corresponds to time provided
time_to_bars_back(_time)
from a time quanity to bar quanity for use with .
Parameters:
_time : (int)
Returns: int bars_back | yeilds the amount of bars from current bar to reach _time provided
bars_back_to_time(bars_back)
from bars_back to time
Parameters:
bars_back
Returns: int | using same logic as this will return the
time of the bar = to the bar that corresponds to bars_back
index_time(index)
bar_index to UNIX time
Parameters:
index : (int)
Returns: int time | time in unix that corrresponds to the bar_index
to_utc(time_or_index, timezone, format)
method to use with a time or bar_index variable that will detect if it is an index or unix time
and convert it to a printable string
Parameters:
time_or_index : (int) required) | time in unix or bar_index
timezone : (int) required) | utc offset to be appled to output
format : (string) | default - "yyyy-MM-dd'T'HH:mm:ssZ") | the format for the time, provided string is
default one from str.format_time()
Returns: string | time formatted string
GET(line)
Gets the location paramaters of a Line
Parameters:
line : (line)
Returns: tuple
GET(box)
Gets the location paramaters of a Box
Parameters:
box : (box)
Returns: tuple
GET(label)
Gets the location paramaters and text of a Label
Parameters:
label : (label)
Returns: tuple
GET(linefill)
Gets line 1 and 2 from a Linefill
Parameters:
linefill : (linefill)
Returns: tuple
Format(line, timezone)
converts Unix time in time or index params to formatted time
and returns a tuple of the params as string with the time/index params formatted
Parameters:
line : (line) | required
timezone : (int) | default - na
Returns: tuple
Line(x1, y1, x2, y2, extend, color, style, width)
similar to line.new() with the exception
of not needing to include y2 for a flat line, y1 defaults to close,
and it doesnt require xloc.bar_time or xloc.bar_index, if no x1
Parameters:
x1 : (int) default - time
y1 : (float) default - close
x2 : (int) default - last_bar_time/last_bar_index | not required for line that ends on current bar
y2 : (float) default - y1 | not required for flat line
extend : (string) default - extend.none | extend.left, extend.right, extend.both
color : (color) default - chart.fg_color
style : (string) default - line.style_solid | line.style_dotted, line.style_dashed,
line.style_arrow_both, line.style_arrow_left, line.style_arrow_right
width
Returns: line
Box(left, top, right, bottom, extend, border_color, bgcolor, text_color, border_width, border_style, txt, text_halign, text_valign, text_size, text_wrap)
similar to box.new() but only requires top and bottom to create box,
auto detects if it is bar_index or time used in the (left) arg. xloc.bar_time and xloc.bar_index are not used
args are ordered by purpose | position -> colors -> styling -> text options
Parameters:
left : (int) default - time
top : (float) required
right : (int) default - last_bar_time/last_bar_index | will default to current bar index or time
depending on (left) arg
bottom : (float) required
extend : (string) default - extend.none | extend.left, extend.right, extend.both
border_color : (color) default - chart.fg_color
bgcolor : (color) default - color.new(chart.fg_color,75)
text_color : (color) default - chart.bg_color
border_width : (int) default - 1
border_style : (string) default - line.style_solid | line.style_dotted, line.style_dashed,
txt : (string) default - ''
text_halign : (string) default - text.align_center | text.align_left, text.align_right
text_valign : (string) default - text.align_center | text.align_top, text.align_bottom
text_size : (string) default - size.normal | size.tiny, size.small, size.large, size.huge
text_wrap : (string) default - text.wrap_auto | text.wrap_none
Returns: box
Label(x, y, txt, yloc, color, textcolor, style, size, textalign, text_font_family, tooltip)
similar to label.new() but only requires no args to create label,
auto detects if it is bar_index or time used in the (x) arg. xloc.bar_time and xloc.bar_index are not used
args are ordered by purpose | position -> colors -> styling -> text options
Parameters:
x : (int) default - time
y : (float) default - high or low | depending on bar direction
txt : (string) default - ''
yloc : (string) default - yloc.price | yloc.price, yloc.abovebar, yloc.belowbar
color : (color) default - chart.fg_color
textcolor : (color) default - chart.bg_color
style : (string) default - label.style_label_down | label.style_none
label.style_xcross,label.style_cross,label.style_triangleup,label.style_triangledown
label.style_flag, label.style_circle, label.style_arrowup, label.style_arrowdown,
label.style_label_up, label.style_label_down, label.style_label_left, label.style_label_right,
label.style_label_lower_left, label.style_label_lower_right, label.style_label_upper_left,
label.style_label_upper_right, label.style_label_center, label.style_square,
label.style_diamond
size : (string) default - size.normal | size.tiny, size.small, size.large, size.huge
textalign : (string) default - text.align_center | text.align_left, text.align_right
text_font_family : (string) default - font.family_default | font.family_monospace
tooltip : (string) default - na
Returns: label
HTF Bar Close CountdownThis simple indicator displays a countdown for the amount of time left until a bar of your chosen timeframe closes.
Displays up to 5 different HTF countdowns.
Fully Customizable to fit any style, change the text colors, background colors, frame colors, display size and border & frame widths.
Flat display option for a sleek look to mesh with your charts.
Notes/Tips:
Higher Time Frames only! This is only intended to view HTF countdowns, will not work when trying to use a timeframe lower than your current chart's.
Some weird timeframes do not work, you'll know when.
Only works on live charts! Will display "Closed" when on an inactive chart.
Does not work for replay! A countdown is pretty pointless on a replay that is not real-time anyways...
Enjoy!