Time Cycles [TMU]Title: Time Cycles
Description:
This indicator is a comprehensive Time-Based Market Structure tool designed to segment the trading day into fixed temporal windows using New York Time logic. Unlike standard price-lagging indicators (like MA or RSI), this script focuses purely on Time and Price geometry, visualizing how price action behaves within specific 90-minute, 30-minute, and 10-minute intervals.
It is engineered to help traders visualize the "Time" component of the chart by projecting historical high/low ranges and key opening prices automatically using advanced array management.
Underlying Logic & Calculation
The script operates on a fixed time schedule (defaulting to America/New_York timezone) to generate three distinct layers of analysis:
1. The "Previous 90-Minute Cycle" Engine The script identifies fixed 90-minute blocks starting from 02:30 NY time.
Logic: At the close of each 90-minute window, the script records the Highest High and Lowest Low of that specific session .
Projection (PCH/PCL): These levels are projected forward into the next 90-minute window as static support/resistance zones (PCH - Previous Cycle High, PCL - Previous Cycle Low) using a "Step-Locked" mechanism that prevents repainting of the projected level.
Equilibrium (EQ): The script automatically calculates the 50% mean level between the PCH and PCL to highlight the premium/discount midpoint of the previous range.
2. Intraday Cycle Phases The indicator visualizes the fractal nature of time by highlighting specific 30-minute and 90-minute sessions.
Phases: The script categorizes sessions into three customizable structural phases: Accumulation (Blue), Manipulation (Red), and Distribution (Green). This helps traders identify the potential intent of price action within a specific time window.
Visualization: It draws background ranges based on hard-coded timestamps (e.g., 02:30–04:00 for the first London cycle) to visually segregate market phases.
3. Key Opening Price Anchors The script plots significant "Time Opens" that act as institutional reference points.
Midnight Open (00:00 NY): The exact opening price of the day.
09:30 Open: The standard US Equity Market Open price.
Weekly/Yearly Opens: Uses non-repainting request.security calls to fetch higher-timeframe open prices.
Cycle Open (C.O.): The opening price of the current 90-minute macro bucket.
Unique Features & Originality
This script implements custom algorithmic solutions to manage time-based data, distinguishing it from standard library indicators:
Custom 10-Minute Box Arrays: Unlike standard security calls, this script uses a box array system to capture and render 10-minute micro-structures (tenBoxes) directly on the chart. It calculates the High/Low of every 10-minute block dynamically and stores them in a rolling array to visualize sub-fractal structure without changing timeframes.
Object-Oriented Line Management: To optimize performance and maintain a clean chart, the script employs a custom User-Defined Type (type Lines). This allows for an advanced "garbage collection" method (manage_lines) that automatically trims, extends, or deletes opening lines based on the current time, ensuring that historical data does not clutter the workspace.
Predictive "Step-Locked" Projection: The code utilizes a logic state that locks the previous cycle's coordinates (prevCycHigh, prevCycLow) only upon the confirmed close of the session, projecting these specific coordinates forward using box.new rather than plot, allowing for precise, interactive visual blocks.
How to Use
PCH/PCL Boxes: Use the projected boxes from the previous 90m cycle as potential Support (PCL) or Resistance (PCH) for the current cycle.
EQ Line: The orange line represents the "Fair Value" of the previous range.
Settings: Users can toggle visibility for 30m cycles, 10m boxes, and opening lines independently to suit their strategy.
Disclaimer: This tool is for structural analysis and visualization of time windows. It does not guarantee future price movement. Past performance is not indicative of future results.
Timecycle

QuantMotions - Pivot Timeline ProjectionQuantMotions – Pivot Timeline Projections is an advanced time-based forecasting tool that uses a unique Twin Pivot model to project future price-time structures.
It combines classical Gann principles with modern quantitative logic to generate highly precise time projections, dynamic angles, and future support/resistance timelines across multiple timeframes.
Whenever two matching pivots (High ↔ Low) of the same length are detected, the indicator calculates a true calendar-time angle and extends it forward, forming dynamic Gann-style fans that adapt to the market in real time.
Perfect for traders who want to integrate price + time forecasting into their strategy.
Key Features:
✔ Twin Pivot Detection
Automatically identifies valid pivot pairs of equal cycle length and opposite direction.
Once confirmed, the pivot becomes a time anchor for future projections.
✔ True Time-Based Angle Projections
Unlike standard Gann tools that rely on bar-counting, this indicator uses real calendar time (milliseconds) to calculate:
This produces significantly more accurate forecasting lines.
✔ Multi-Timeframe Pivot Cycles
Activate time cycles such as:
30M, 1H, 4H, 12H
1D, 7D, 30D
60D, 90D, 120D, 180D, 270D, 360D
Each cycle uses a dedicated color and projection style for clarity.
✔ Dynamic Support/Resistance Timefans
- Every confirmed pivot generates two future projections:
- The main time-angle projection (Gann-style forward fan)
- A secondary projection based on a fixed ratio (1/8), acting as dynamic future support
Both extend until the structure breaks based on ATR tolerance.
✔ ATR-Based Validation
Projection lines remain valid until price breaks them with a configurable ATR multiplier.
This removes noise and keeps only meaningful structures.
✔ Volume Delta Tracking (Optional)
Tracks up-volume and down-volume along the time cycle to validate directional bias.
Info labels show:
- cycle length
- angle
- delta volume
- delta percentage
Seconds-based volume tracking supported for Premium users.
✔ Smart Info Labels
Displays detailed pivot information only for the highest-timeframe pivot at each bar
→ ensures high usability without chart clutter.
🔷 Why This Indicator Is Special
This tool merges Gann angles, time cycles, and quantitative price action into a single engine.
It does not rely on static angles or simple bar offsets.
Instead, it uses:
- real time
- real slope
- real cycle symmetry
- real price movement
The result is a uniquely accurate forecasting model that is extremely difficult to replicate manually.
🔷 Perfect For
- Intraday traders
- Swing traders
- Index, Crypto, Metals, and FX traders
- Gann and cycle-based analysts
- Structure and trend change detection
- Time/price projection strategies
🔷 Inputs & Customization
- ATR break tolerance
- Multiple cycle activation toggles
- Custom color sets for each timeframe
- Second-based or standard timeframe volume tracking
- Enable/Disable info labels
🔷 Note
Some features (like seconds-based volume tracking) depend on TradingView Premium and additional broker data sources.
Loading times may vary when many long-term cycles are enabled simultaneously.
🔷 Access
This is an Invite-Only Script by QuantMotions.
Access is granted after purchase.
For more information, please visit the official product page or contact us directly.

Thiru Macro Time Cycles🕐 Thiru Macro Time Cycles - Advanced Multi-Session Trading Indicator
═══════════════════════════════════════════
📋 WHAT IT DOES:
Thiru Macro Time Cycles is a professional-grade trading indicator that automatically identifies and visualizes 10 critical macro trading sessions throughout the trading day. This indicator helps traders identify optimal entry windows during high-probability market periods across London and New York sessions.
The indicator displays horizontal lines and labels marking specific 30-minute time windows that are known for significant price movements and institutional trading activity. Perfect for traders who follow ICT (Inner Circle Trader) methodologies, session trading strategies, and time-based market analysis.
═══════════════════════════════════════════
✨ KEY FEATURES:
🕐 MULTI-SESSION COVERAGE
10 Distinct Macro Sessions:
- London Sessions: 2 sessions (2:45-3:15 AM & 3:45-4:15 AM EST)
- NY AM Sessions: 4 sessions (7:45-8:15 AM, 8:45-9:15 AM, 9:45-10:15 AM, 10:45-11:15 AM EST)
- NY PM Sessions: 4 sessions (11:45-12:15 PM, 12:45-1:15 PM, 1:45-2:15 PM, 2:45-3:15 PM EST)
• Each session is a precise 30-minute window optimized for institutional activity
🎨 FULLY CUSTOMIZABLE VISUALS
• Individual Color Control: Set unique colors for each of the 10 sessions
• Plain Text Labels: Clean labels without background boxes for better visibility
• Label Customization: Show/hide labels, adjust text alignment (Left/Center/Right), size (Tiny to Huge)
• Line Customization: Adjustable width (1-10px), style (Solid/Dotted/Dashed), transparency
• Professional Color Coding: Different colors for London vs NY sessions
• Clean Visual Design: Horizontal lines with optional plain text labels
⏰ INTELLIGENT TIME MANAGEMENT
• Days to Show: Control how many days of sessions to display (1-30 days, default: 5)
• Weekend Filtering: Option to skip Saturday and Sunday for cleaner weekly view
• Automatic Cleanup: Smart memory management prevents chart clutter
• Timezone Aware: Uses Eastern Time (EST/EDT) with automatic DST handling
• Historical Tracking: View past sessions for pattern analysis
📊 SESSION CONTROL SYSTEM
• Individual Session Control: Enable/disable each of the 10 sessions independently
• Session Group Toggles: Show/hide all London, NY AM, or NY PM sessions at once
• London Sessions: Marked as "LO 1" and "LO 2"
• NY AM Sessions: Marked as "AM 1", "AM 2", "AM 3", "AM 4"
• NY PM Sessions: Marked as "PM 1", "PM 2", "PM 3", "PM 4"
• Clear Label System: Easy to identify which session you're viewing
═══════════════════════════════════════════
🚀 HOW TO USE:
BASIC SETUP:
1️⃣ Add the indicator to your chart
2️⃣ The indicator will automatically display sessions for the current and past days
3️⃣ Sessions appear as horizontal lines at the bottom of the indicator pane
4️⃣ Labels show session names (LO 1, LO 2, AM 1-4, PM 1-4)
CUSTOMIZATION:
1️⃣ Open Settings (gear icon)
2️⃣ Adjust "Days to Show" to control historical display (1-30 days recommended)
3️⃣ Enable/disable individual sessions or entire session groups
4️⃣ Toggle "Show Labels" on/off based on your preference
5️⃣ Choose "Text Alignment" (Left/Center/Right) and label size
6️⃣ Customize line width, style, and transparency
7️⃣ Customize colors for each session in the "Colors" section
8️⃣ Enable "Skip Weekends" for cleaner weekly view
FOR SESSION TRADING:
• Monitor the horizontal lines to identify active macro sessions
• Watch for price reactions during these specific 30-minute windows
• Use session labels to quickly identify which macro period is active
• Track multiple days to see session patterns and consistency
FOR ICT/SMC TRADERS:
• London sessions (LO 1, LO 2) align with London Killzone periods
• NY AM sessions (AM 1-4) cover the New York morning session
• NY PM sessions (PM 1-4) cover the New York afternoon session
• Use these windows for optimal entry timing in your trading setups
FOR MULTI-TIMEFRAME ANALYSIS:
• Works on all timeframes (optimized for 15m, 30m, 1h, 4h)
• Adjust "Days to Show" based on your timeframe:
- Lower timeframes (15m, 30m): 3-5 days
- Higher timeframes (4h, Daily): 5-10 days
═══════════════════════════════════════════
⚙️ SETTINGS OVERVIEW:
📌 DISPLAY SETTINGS:
• Days to Show: Number of days to display (default: 5, range: 1-30)
• Skip Weekends: Toggle to skip Saturday and Sunday (default: ON)
• Line Y Position: Adjust vertical position of lines (-1.0 to 1.0)
📌 SESSION GROUPS:
• Show London Sessions: Toggle all London sessions on/off
• Show NY AM Sessions: Toggle all NY AM sessions on/off
• Show NY PM Sessions: Toggle all NY PM sessions on/off
📌 INDIVIDUAL SESSIONS:
• Enable/disable each of the 10 sessions independently
📌 LABEL SETTINGS:
• Show Labels: Toggle labels on/off (default: ON)
• Text Alignment: Left, Center, or Right positioning
• Label Size: Tiny, Small, Normal, Large, or Huge (default: Small)
• Label Y Position: Adjust vertical position (-1.0 to 1.0)
• Label Text Color: Customize text color
📌 LINE APPEARANCE:
• Line Width: 1-10 pixels (default: 7)
• Line Style: Solid, Dotted, or Dashed
• Line Transparency: 0-100% (default: 0 = fully opaque)
🎨 COLORS:
• London Macro 1 Line Color (2:45-3:15 AM): Default Blue
• London Macro 2 Line Color (3:45-4:15 AM): Default Blue
• NYAM Macro 1 Line Color (7:45-8:15 AM): Default Orange
• NYAM Macro 2 Line Color (8:45-9:15 AM): Default Orange
• NYAM Macro 3 Line Color (9:45-10:15 AM): Default Blue
• NYAM Macro 4 Line Color (10:45-11:15 AM): Default Blue
• NYPM Macro 1 Line Color (11:45-12:15 PM): Default Orange
• NYPM Macro 2 Line Color (12:45-1:15 PM): Default Orange
• NYPM Macro 3 Line Color (1:45-2:15 PM): Default Blue
• NYPM Macro 4 Line Color (2:45-3:15 PM): Default Blue
═══════════════════════════════════════════
💡 TIPS & BEST PRACTICES:
✅ RECOMMENDED SETTINGS:
• Days to Show: 5 days (good balance of history and clarity)
• Show Labels: ON (helps identify sessions quickly)
• Text Alignment: Center (best visibility)
✅ TRADING STRATEGIES:
• Combine with price action analysis during macro sessions
• Watch for breakouts or reversals at session boundaries
• Use in conjunction with other ICT/SMC indicators
• Track which sessions show highest volatility for your instrument
✅ CHART SETUP:
• Works best on clean charts (minimal other indicators)
• Recommended instruments: Forex pairs, indices, futures
• Optimal timeframes: 15m, 30m, 1h for intraday trading
• Can be used on 4h/Daily for swing trading context
✅ PERFORMANCE OPTIMIZATION:
• Reduce "Days to Show" if chart becomes cluttered
• Turn off labels if you prefer cleaner visual
• Use consistent colors to build visual memory
• Adjust based on your trading style and preferences
═══════════════════════════════════════════
📈 SESSION TIMES (Eastern Time):
🌍 LONDON SESSIONS:
• LO 1: 2:45 AM - 3:15 AM EST
• LO 2: 3:45 AM - 4:15 AM EST
🇺🇸 NEW YORK AM SESSIONS:
• AM 1: 7:45 AM - 8:15 AM EST
• AM 2: 8:45 AM - 9:15 AM EST
• AM 3: 9:45 AM - 10:15 AM EST
• AM 4: 10:45 AM - 11:15 AM EST
🇺🇸 NEW YORK PM SESSIONS:
• PM 1: 11:45 AM - 12:15 PM EST
• PM 2: 12:45 PM - 1:15 PM EST
• PM 3: 1:45 PM - 2:15 PM EST
• PM 4: 2:45 PM - 3:15 PM EST
═══════════════════════════════════════════
🔧 TECHNICAL DETAILS:
• Pine Script Version: v6
• Indicator Type: Non-overlay (separate pane)
• Timezone: America/New_York (Eastern Time)
• Automatic DST Handling: Yes
• Memory Management: Optimized with automatic cleanup
• Performance: Lightweight and efficient
═══════════════════════════════════════════
🎯 USE CASES:
1️⃣ SESSION TRADING
Identify optimal entry windows during high-probability trading sessions
2️⃣ ICT/SMC METHODOLOGY
Align with Inner Circle Trader and Smart Money Concepts time-based strategies
3️⃣ INSTITUTIONAL TIMING
Track when institutional traders are most active in the market
4️⃣ MULTI-SESSION ANALYSIS
Compare price action across different macro sessions to find patterns
5️⃣ TIME-BASED ENTRIES
Use macro sessions as timing filters for your trading setups
═══════════════════════════════════════════
📝 NOTES:
• All times are in Eastern Time (EST/EDT)
• The indicator automatically handles daylight saving time changes
• Sessions are displayed as horizontal lines in a separate indicator pane
• Works with all instruments: Forex, Stocks, Futures, Crypto
• Compatible with all timeframes, optimized for intraday trading
═══════════════════════════════════════════
👤 AUTHOR & SUPPORT:
Created by: ThiruDinesh
TradingView Profile: @ThiruDinesh
For questions, feedback, or support, please contact through TradingView.
═══════════════════════════════════════════
© 2025 ThiruDinesh - All Rights Reserved
Proprietary Algorithm - Do Not Redistribute
This indicator contains proprietary trading logic and methodology
developed exclusively by ThiruDinesh. Unauthorized copying,
distribution, or reverse engineering is strictly prohibited.
═══════════════════════════════════════════

Ichimoku PourSamadi Signal [TradingFinder] KijunSen Magic Number🔵 Introduction
The Ichimoku Kinko Hyo system is one of the most comprehensive market analysis tools ever created. Developed by Goichi Hosoda, a Japanese journalist in the 1930s, its purpose was to allow traders to recognize the balance between price, time, and momentum at a single glance. (In Japanese, Ichimoku literally means “one look.”)
At the core of the system lie five key components: Tenkan-sen (Conversion Line), Kijun-sen (Baseline), Chikou Span (Lagging Line), and the two leading spans, Senkou Span A and Senkou Span B, which together form the well-known Kumo or cloud representing both temporal structure and equilibrium zones in the market.
Although Ichimoku is commonly used to identify trends and support/resistance levels, a deeper layer of time philosophy exists within it. Ichimoku was not designed solely for price analysis but equally for time analysis.
In the classical model, the numerical cycles 9, 26, 52 reflect the natural rhythm of the market originally based on the Tokyo Stock Exchange’s trading schedule in the 1930s.
These values repeat across the system’s calculations, forming the foundation of Ichimoku’s time symmetry where price and time ultimately seek equilibrium.
In recent years, modern analysts have explored new approaches to extract time-based turning points from Ichimoku’s structure. One such approach is the analysis of flat segments on the Kijun-sen and Senkou B lines.
Whenever one of these lines remains flat for a period, it signals temporary balance between buyers and sellers; when the flat breaks, the market exits equilibrium and a new cycle begins.
This indicator is built precisely upon that philosophy. Following the timing methodology introduced by M.A. Poursamadi, the focus shifts away from price signals and line crossovers toward identifying flat periods on Kijun-sen (period 52) as time anchors.
From the first candle that changes the line’s slope, the tool begins a temporal count using a fixed sequence of key numbers: 5, 9, 13, 17, 26, 35, 43, 52, 63, 72, 81, 90.
Derived from both classical Ichimoku cycles and empirical testing, these numbers mark potential timing nodes where a market wave may end, a correction may begin, or a new leg may form.
Thus, this method serves not merely as another Ichimoku tool but as a temporal metronome for market structure a way to visualize moments when the market is ready to change rhythm, often before candles reveal it.
🔵 How to Use
The Kijun Timing BoX is built entirely on Ichimoku’s concept of time analysis.
Its core idea is that within every flat segment of the Kijun-sen, the market enters a temporary balance between opposing forces.
When that flat breaks, a new time cycle begins. From that first breakout candle, the indicator starts counting forward through the predefined time sequence(5, 9, 13, 17, 26, 35, 43, 52, 63, 72, 81, 90).
This counting framework creates a temporal map of market behavior, where each number represents an area where meaningful price fluctuations often occur.
A “meaningful fluctuation” does not necessarily imply reversal or continuation; rather, it marks a moment when the market’s internal energy balance shifts, typically visible as noticeable reactions on lower timeframes.
🟣 Identifying the Anchor Point
The first step is recognizing a valid flat zone on the Kijun-sen.
When this line remains flat for several candles and then changes slope, the indicator marks that bar as the Anchor, initiating the time count.
From that point onward, vertical gray lines appear at each interval in the key-number sequence, visualizing the time nodes ahead.
🟣 Reading the Timing Lines
Each numbered line represents a timing node a temporal point where a change in price rhythm is statistically more likely to occur.
At these nodes, the market may :
Enter a consolidation or minor correction phase.
Develop range-bound movement.
Or simply alter the speed and intensity of its move.
These behaviors do not imply a specific direction; they only highlight zones where time-based activity tends to cluster, giving traders a clearer view of cyclical rhythm.
🟣 Applying Time Analysis
The indicator’s primary use is to observe temporal order, not to predict price direction.
By tracking the distance between Anchors and the reactions that appear near major timing lines, traders can empirically identify each market’s characteristic rhythm—its own time DNA.
For example, one asset may consistently show significant fluctuations around the 13- and 26-bar marks,while another might react closer to 9 or 52. Recognizing such patterns helps traders understand how long typical cycles last before new phases of volatility emerge.
🟣 Combining with Other Tools
The indicator does not generate buy/sell signals on its own.
Its best use is in combination with price- or structure-based methods, to see whether meaningful price reactions occur around the same timing nodes.
In practice, it helps distinguish structured time-based fluctuations from random, noise-driven moves an insight often overlooked in conventional market analysis.
🔵 Settings
🟣 Logical Settings
KijunSen Period : Defines the baseline period used for timing analysis. Default = 52. It is the main line for detecting flats and generating time anchors.
Flat Event Filter : Controls how flat segments are validated before triggering a new timing event.
All : Every flat triggers a new Timing Box.
Automatic : Only flats longer than the historical average are used (recommended).
Custom : User manually defines the minimum flat length via Custom Count.
Update Timing Analysis BoX Per Event : If enabled, a new Timing Box is drawn each time a new flat event occurs. If disabled, the box completes its 90-bar window before refreshing.
🟣 Ichimoku Settings
TenkanSen Period : Defines the period for the Conversion Line (Tenkan-sen). Default = 9.
KijunSen Period : Sets the standard Ichimoku baseline (not the timing line). Default = 26.
Span B Period : Defines the period for Senkou Span B, the slower cloud boundary. Default = 52.
Shift Lines : Offsets cloud projection into the future. Default = 26.
🟣 Display Settings
Users can show or hide all Ichimoku lines Tenkan-sen, Kijun-sen, Chikou Span, Span A, and Span B as well as the Ichimoku Cloud.
They can also customize the color of each element to match personal chart preferences and improve visibility.
🔵 Conclusion
This analytical approach transforms Ichimoku’s time philosophy into a visual and measurable framework. A flat Kijun-sen represents a moment of market equilibrium; when its slope shifts, a new temporal cycle begins.
The purpose is not to forecast price direction but to highlight periods when meaningful fluctuations are more likely to develop.
Through this perspective, traders can observe the hidden rhythm of market time and expand their analysis beyond price into a broader time-cycle dimension.
Ultimately, the method revives Ichimoku’s original principle: the market can only be truly understood through the simultaneous harmony of price, time, and balance.

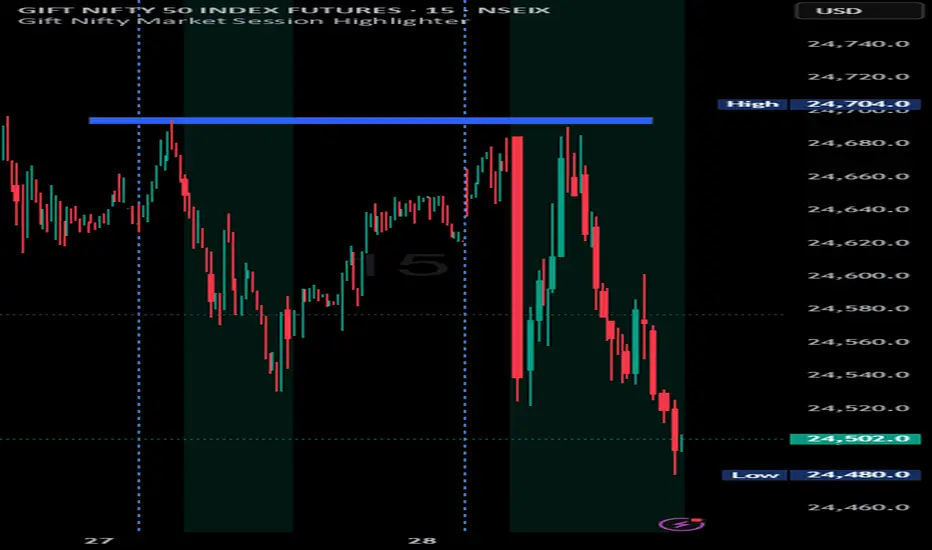
Indian market session on Gift Nifty chartsGift Nifty Market Session Highlighter
This indicator highlights the official Indian market session on Gift Nifty charts — from 9:15 AM to 3:30 PM IST. It shades the background during this time window so traders can instantly identify when the local market is open.
Features:
Marks 9:15 AM to 3:30 PM (IST) session on intraday charts.
Adjustable highlight color and transparency.
Works seamlessly across lower timeframes (1m, 5m, 15m, etc.).
Helps traders align Gift Nifty activity with NSE market hours.
Use Cases:
Quickly distinguish active market hours from overnight or global sessions.
Backtest trading strategies specific to Indian session volatility.
Improv
e focus on expiry-day setups and intraday opportunities.
Disclaimer:
This tool is provided for educational and informational purposes only. It is not financial advice, nor does it guarantee trading success. Always do your own research and consult a licensed financial professional before making investment decisions.
Sessions [New_ProfitEfex]This script is use for displaying session in a very attractive an clarity way
You can give it a try for free

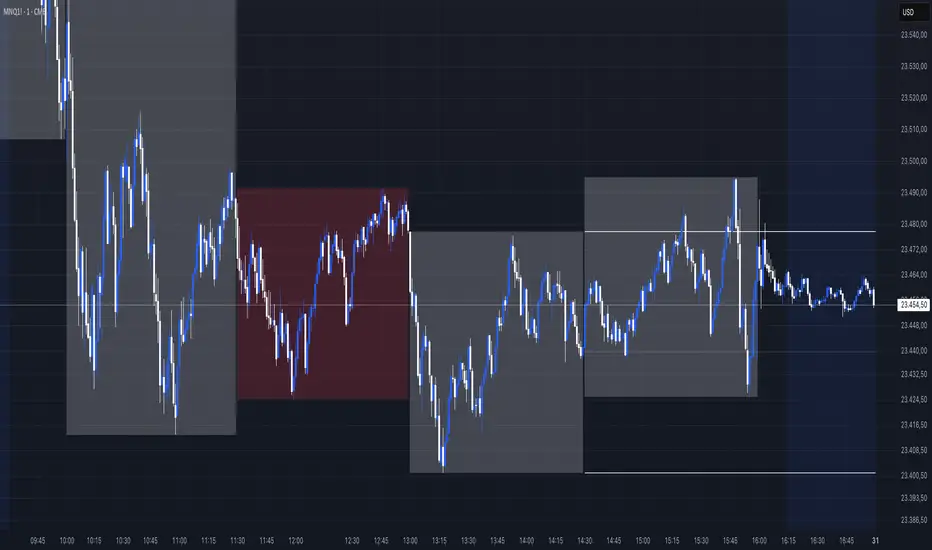
NY Time Cycles# New York Time Cycles Indicator
## Overview
The Time Cycles indicator is a specialized technical analysis tool designed to divide the trading day into distinct time blocks based on New York trading hours. Developed for TradingView, this indicator helps traders identify and analyze market behavior during specific time periods throughout the trading session. The indicator displays six consecutive time blocks, each representing 90-minute segments of the trading day, while tracking price ranges within each block.
## Core Concept
The Time Cycles indicator is built on the premise that different periods during the trading day often exhibit unique market characteristics and behaviors. By segmenting the trading day into standardized 90-minute blocks, traders can:
1. Identify recurring patterns at specific times of day
2. Compare price action across different time blocks
3. Recognize potential support and resistance levels based on the high and low of previous time blocks
4. Develop time-based trading strategies specific to certain market hours
## Time Block Structure
The indicator divides the trading day into six sequential 90-minute blocks based on New York time:
1. **Box 1**: 07:00 - 08:30 ET
2. **Box 2**: 08:30 - 10:00 ET
3. **Box 3**: 10:00 - 11:30 ET
4. **Box 4**: 11:30 - 13:00 ET
5. **Box 5**: 13:00 - 14:30 ET
6. **Box 6**: 14:30 - 16:00 ET
These time blocks cover the core US trading session from pre-market into regular market hours.
## Visual Representation
Each time block is represented on the chart as a visual box that:
- Spans the exact time period of the block (horizontally)
- Extends from the highest high to the lowest low recorded during that time period (vertically)
- Is displayed with customizable colors and transparency levels
- Automatically builds in real-time as price action develops
Additionally, the indicator draws dashed projection lines that:
- Display the high and low of the most recently completed time block
- Extend forward in time (for up to 24 hours)
- Help traders identify potential support and resistance levels
## Technical Implementation
The indicator employs several key technical features:
1. **Time Detection**: Accurately identifies the current New York time to place each box in the correct time period
2. **Dynamic Box Creation**: Initializes and updates boxes in real-time as price action develops
3. **Range Tracking**: Continuously monitors and adjusts the high and low of each active time block
4. **Projection Lines**: Creates horizontal dashed lines projecting the high and low of the most recently completed time block
5. **Daily Reset**: Automatically resets all boxes and lines at the start of each new trading day
6. **Customization**: Allows users to set custom colors and transparency levels for each time block
This Time Cycles indicator provides traders with a structured framework for analyzing intraday market movements based on specific time periods. By understanding how the market typically behaves during each 90-minute block, traders can develop more targeted strategies and potentially identify higher-probability trading opportunities throughout the trading day.
WD Gann: Close Price X Bars Ago with Line or Candle PlotThis indicator is inspired by the principles of WD Gann, a legendary trader known for his groundbreaking methods in time and price analysis. It helps traders track the close price of a security from X bars ago, a technique that is often used to identify key price levels in relation to past price movements. This concept is essential for Gann’s market theories, which emphasize the relationship between time and price.
WD Gann’s analysis often revolved around specific numbers that he considered significant, many of which correspond to squared numbers (e.g., 1, 4, 9, 16, 25, 36, 49, 64, 81, 100, 121, 144, 169, 196, 225, 256, 289, 324, 361, 400, 441, 484, 529, 576, 625, 676, 729, 784, 841, 900, 961, 1024, 1089, 1156, 1225, 1296, 1369, 1444, 1521, 1600, 1681, 1764, 1849, 1936). These numbers are believed to represent natural rhythms and cycles in the market. This indicator can help you explore how past price levels align with these significant numbers, potentially revealing key price zones that could act as support, resistance, or reversal points.
Key Features:
- Historical Close Price Calculation: The indicator calculates and displays the close price of a security from X bars ago (where X is customizable). This method aligns with Gann's focus on price relationships over specific time intervals, providing traders with valuable reference points to assess market conditions.
- Customizable Plot Type: You can choose between two plot types for visualizing the historical close price:
- Line Plot: A simple line that represents the close price from X bars ago, ideal for those who prefer a clean and continuous representation.
- Candle Plot: Displays the close price as a candlestick chart, providing a more detailed view with open, high, low, and close prices from X bars ago.
- Candle Color Coding: For the candle plot type, the script color-codes the candles. Green candles appear when the close price from X bars ago is higher than the open price, indicating bullish sentiment; red candles appear when the close is lower, indicating bearish sentiment. This color coding gives a quick visual cue to market sentiment.
- Customizable Number of Bars: You can adjust the number of bars (X) to look back, providing flexibility for analyzing different timeframes. Whether you're conducting short-term or long-term analysis, this input can be fine-tuned to suit your trading strategy.
- Gann Method Application: WD Gann's methods involved analyzing price action over specific time periods to predict future movements. This indicator offers traders a way to assess how the price of a security has behaved in the past in relation to a chosen time interval, a critical concept in Gann's theories.
How to Use:
1. Input Settings:
- Number of Bars (X): Choose the number of bars to look back (e.g., 100, 200, or any custom period).
- Plot Type: Select whether to display the data as a Line or Candles.
2. Interpretation:
- Using the Line plot, observe how the close price from X bars ago compares to the current market price.
- Using the Candles plot, analyze the full price action of the chosen bar from X bars ago, noting how the close price relates to the open, high, and low of that bar.
3. Gann Analysis: Integrate this indicator into your broader Gann-based analysis. By looking at past price levels and their relationship to significant squared numbers, traders can uncover potential key levels of support and resistance or even potential reversal points. The historical close price can act as a benchmark for predicting future market movements.
Suggestions on WD Gann's Emphasis in Trading:
WD Gann’s trading methods were rooted in several key principles that emphasized the relationship between time and price. These principles are vital to understanding how the "Close Price X Bars Ago" indicator fits into his overall analysis:
1. Time Cycles: Gann believed that markets move in cyclical patterns. By studying price levels from specific time intervals, traders can spot these cycles and predict future market behavior. This indicator allows you to see how the close price from X bars ago relates to current market conditions, helping to spot cyclical highs and lows.
2. Price and Time Squaring: A core concept in Gann’s theory is that certain price levels and time periods align, often marking significant reversal points. The squared numbers (e.g., 1, 4, 9, 16, 25, etc.) serve as potential key levels where price and time might "square" to create support or resistance. This indicator helps traders spot these historical price levels and their potential relevance to future price action.
3. Geometric Angles: Gann used angles (like the 45-degree angle) to predict market movements, with the belief that prices move at specific geometric angles over time. This indicator gives traders a reference for past price levels, which could align with key angles, helping traders predict future price movement based on Gann's geometry.
4. Numerology and Key Intervals: Gann paid particular attention to numbers that held significance, including squared numbers and numbers related to the Fibonacci sequence. This indicator allows traders to analyze price levels based on these key numbers, which can help in identifying potential turning points in the market.
5. Support and Resistance Levels: Gann’s methods often involved identifying levels of support and resistance based on past price action. By tracking the close price from X bars ago, traders can identify past support and resistance levels that may become significant again in future market conditions.
Perfect for:
Traders using WD Gann’s methods, such as Gann angles, time cycles, and price theory.
Analysts who focus on historical price levels to predict future price action.
Those who rely on numerology and geometric principles in their trading strategies.
By integrating this indicator into your trading strategy, you gain a powerful tool for analyzing market cycles and price movements in relation to key time intervals. The ability to track and compare the historical close price to significant numbers—like Gann’s squared numbers—can provide valuable insights into potential support, resistance, and reversal points.
Disclaimer:
This indicator is based on the methods and principles of WD Gann and is for educational purposes only. It is not intended as financial advice. Trading involves significant risk, and you should not trade with money that you cannot afford to lose. Past performance is not indicative of future results. The use of this indicator is at your own discretion and risk. Always do your own research and consider consulting a licensed financial advisor before making any investment decisions.

Customizable Vertical LinesCustomizable Vertical Lines (CVL) Indicator
Version 2.0 (November 2023)
Description:
The Customizable Vertical Lines (CVL) indicator is a powerful tool for traders who want to mark specific times on their charts with vertical lines. This indicator allows users to customize the appearance of these lines, including their color, line style, and width, providing a flexible and visually intuitive way to highlight key time points.
Key Features:
User-Friendly Inputs: Easily set up to five distinct times, each associated with a unique color for the vertical lines.
Color Customization: Choose from a wide range of colors for each vertical line, allowing for clear differentiation.
Line Style Options: Tailor the appearance of the lines with three selectable styles: solid, dotted, or dashed.
Adjustable Line Width: Modify the thickness of the lines to suit your preferred visual style.
Timezone Offset: Account for different time zones by adjusting the timezone offset parameter.
How to Use:
Simply input the desired times, colors, and other parameters in the script settings. The CVL indicator will then automatically plot vertical lines at the specified times on the chart with the chosen customization.
Cycles: 4x dual inputs: Swing / Time Cycles projected forward//Purpose/Premise:
To project forward vertical 'cycle' lines based on user-input anchor points, and to search for confluence.
The idea being that if several well-anchored cycles agree (i.e. we see multiple bunched vertical line confluence in the future), then this may add support to an already existing trade idea, or may indicate an increased likelihood of a shift in direction.
//Usage & notes:
~In the above chart I've anchored to obvious swing lows and swing highs in Btc/Usd from 2020-2022. You could also use fixed time-based cycles from a favored start anchor point. Bars per cycle are printed at the top of each cycle box if your're interested in time cycles. I.e. for 1, 2, 3 month cycles: for BTC you could use 30, 60, 90 bars on daily; for S&P you could use 20, 40, 60 bars on daily.
~On first loading the indicator you will be asked select 'start date', and 'end date' for each of 4 sessions (8x clicks on chart). After this you can easily reset points by clicking the indicator display line three dots>> reset points. Or you can simply drag the vertical box edges (purple lines) to change your cycle anchor points.
~Be sure the start anchor point is before the end anchor point or box/lines won't appear.
~When you drop down to low timeframes you might get bar_index error due to history available: you need then to click the three dots on indicator display line >> reset points >> 8x clicks on the chart.
~Vertical projected lines will match the color of the cycle box they origninate from.
~Lines will project into the future as far as is allowed by tradingview (500 bars max)
//Inputs:
~Time start and end dates for each cycle (change these as described above, or input manually)
~Show/hide each cycle (default is show all 4)
~Formatting options: color of forward projected lines, line width, line style, line / box / text color.
~Box transparancy: Set to 100 to make boxes invisible & declutter the chart. Set to 0 for maximum opacity. Default is 80.
thanks to @Sathyamurthie for his ideas on cycle confluence which caused me to write this.

Time Cycles IndicatorThis script is used to analyze the seasonality of any asset (commodities, stocks, indices).
To use the script select a timeframe D or W and select the months you are interested in the script settings. You will see all the candles that are part of those months highlighted in the chart.
You can use this script to understand if assets have a cyclical behavior in certain months of the year.

Market Time Cycle (Expo)█ Time Cycles Overview
Time cycles are a fascinating and powerful concept in the world of trading and investing. They are all about understanding and predicting the timing of market moves based on the premise that market events and price movements are not random, but instead occur in repeatable, cyclical patterns.
The Concept of Time Cycles: The foundation of time cycles lies in the belief that historical market patterns tend to repeat themselves over specific periods. These periods or cycles could be influenced by a myriad of factors like economic data releases, earnings reports, geopolitical events, or even natural human behavior. For example, some traders observe increased market activity around the start and end of a trading day, which is a form of intraday time cycle.
Understanding time cycles can provide traders with a roadmap, helping them anticipate potential trend shifts and make more informed decisions about when to buy or sell.
█ Indicator Overview
The Market Time Cycle (Expo) is designed to help traders track and analyze market cycles and generate signals for potential trading opportunities. It uses mathematical techniques to analyze market cycles and detect possible turning points. It does this by projecting the estimated cycle timeline and providing visual indications of cyclical phases through the use of color-coded lines and sine wave cycles.
Time cycles offer a compelling way to forecast market trends and time your trades better. By adding time cycles to your trading toolbox, you could potentially gain a new perspective on market movements and refine your trading strategy further. The indicator generates trading signals based on the sine wave's behavior. When the sine wave crosses certain thresholds, the indicator generates a signal suggesting a potential trading opportunity based on cycle behavior.
█ How to use
This indicator can be a valuable tool to help traders understand and predict market trends and time their trades more accurately. By visualizing the cyclic nature of markets, traders can better anticipate potential turning points and adjust their trading strategies accordingly. It helps traders to spot ideal entry and exit points based on the cyclical nature of financial markets.
█ Settings
You can customize the number of bars (NumbOfBars) that are taken into consideration for the cycle. Including a higher number of bars will provide more data, which can be helpful for analyzing long-term trends.
-----------------
Disclaimer
The information contained in my Scripts/Indicators/Ideas/Algos/Systems does not constitute financial advice or a solicitation to buy or sell any securities of any type. I will not accept liability for any loss or damage, including without limitation any loss of profit, which may arise directly or indirectly from the use of or reliance on such information.
All investments involve risk, and the past performance of a security, industry, sector, market, financial product, trading strategy, backtest, or individual's trading does not guarantee future results or returns. Investors are fully responsible for any investment decisions they make. Such decisions should be based solely on an evaluation of their financial circumstances, investment objectives, risk tolerance, and liquidity needs.
My Scripts/Indicators/Ideas/Algos/Systems are only for educational purposes!

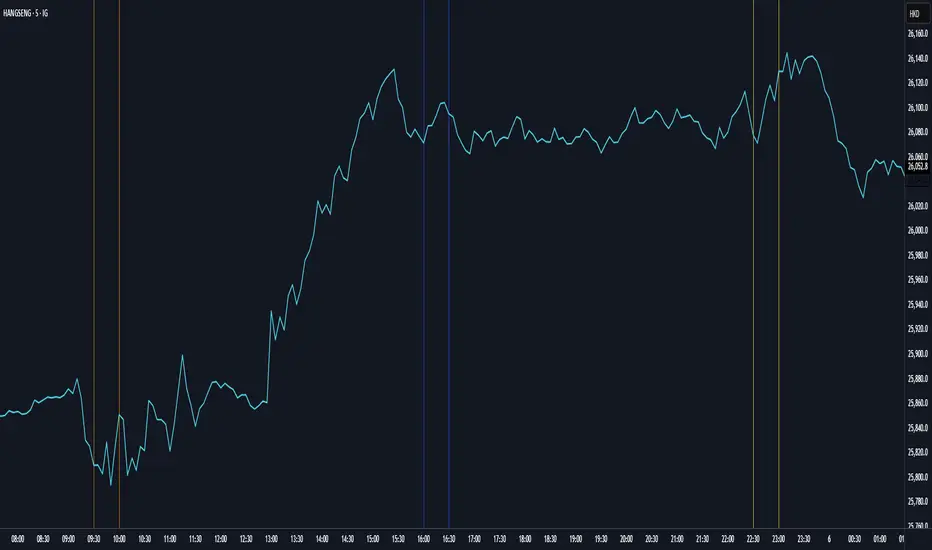
ORB Aspect-Nodes 2023-25(G-T)In astrology, the Moon's Node refers to the two points where the Moon's orbit intersects the ecliptic (the plane of the Earth's orbit around the Sun). The North Node, or Rahu, is the ascending point of the Moon's orbit whle the South Node, or Ketu, is the descending point of the Moon's orbit.
Whenever a planet hits these Nodes, extreme volatility is seen in stocks and temporary tops and bottoms are observed.
This indicator plots these periods and also shows upcoming dates if it falls in the next 7 days.
This indicator is for the period 2023-25.

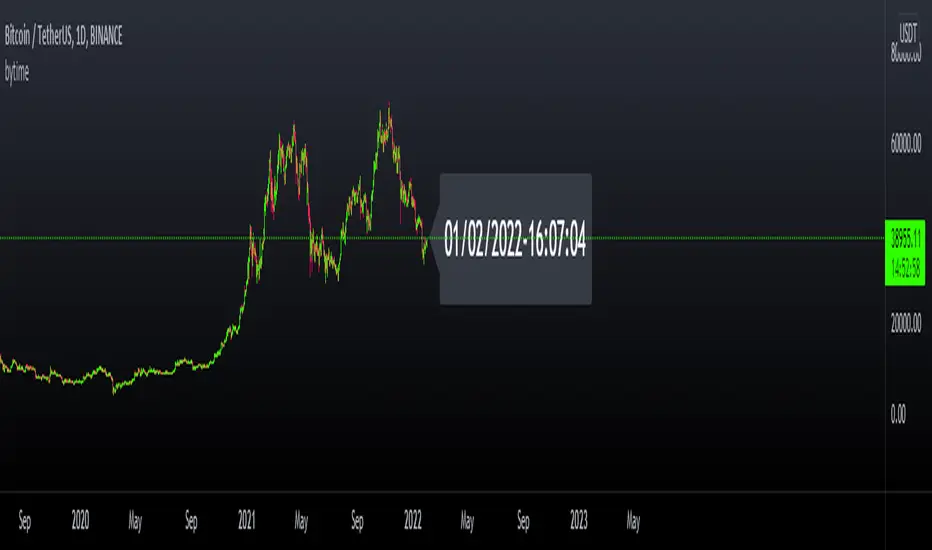
bytimeLibrary "bytime"
TODO: to do something at the specified time.
////Return =>> ht = hour , mt = minute , st = second ,Dt = Day, Mt = month, Yt = year , dateTime = full time format./////////////
Note : Remember to always add import when you call our library and change Gtime() to Timeset.Gtime() is used to access internal data.
import hapharmonic/bytime/1 as Timeset
=Timeset.Gtime()
/////////////Set a time to trigger an alert./////////////
ck = false
///hour : minute : second
if ht == TH and mt == TM and st == TS
//some action
//...
//.
ck := true
Gtime()
Stochastic With Neutral Zone and Time CycleThis oscillator includes 2 Stochastic oscillators ( Stoch 5 3 2, Stoch 14 7 3). Stoch 5 3 2 is used for market momentum, and Stock 14 7 3 is used for market overall time cycle (orange).
There is also a neutral zone highlighted in yellow from 45 to 55 to indicate whether the market has created a low or it is still in the cycle-high and vice versa.

TM_GANN_LEVELTM_GANN_LEVEL indicator have price values those play an important role in market structure explanation. This indicator is used with Day_Price _Level indicator with common values .
These price level must be draw with common values of swing? day levels and must be used during trading decision.
Value with " * " shows important level or a price cycle between two " * " values
Price respect to these levels if used with proper logic.
All the levels are very important .
Use the Below Contacts to Access this Indicator


intraday trading perioddisplay the intraday trading period (08:30 - 15:00) on chart with high transparent white background.
you can edit the time period by yourself in the pine editor mode.

⚛WPO - Wave Period Oscillator by Cryptorhythms⚛WPO - Wave Period Oscillator by Cryptorhythms
Intro
The indicator is based on Akram El Sherbini's article "Time Cycle Oscillators" published in IFTA journal 2018. The third in a series of 4 time cycle indicators I will be publishing.
The WPO is a short-term oscillator that measures the buying and selling period of price cycles over a certain time interval. The leading oscillator indicates a rise in buying period when it moves above the zero line and a rise in selling period when it moves below the zero line.
Description
Centerline Crossover: A bullish centerline crossover occurs when the WPO line moves above the zero level to turn positive. A bearish centerline crossover occurs when the WPO line moves below the zero level to turn negative. When bulls are in control, the price rally begins and the average of the bull’s period T increases to drive the WPO line above the centerline. A buy signal is subsequently triggered. When the bulls start to loose power, prices move sideways and the average period decreases. In this case, the WPO line may flutter near the centerline and cause false signals, whipsaws. To avoid the whipsaws occurring on the centerline, the following trading tactics are proposed.
TL:DR
Bullish signals are generated when WPO crosses over 0
Bearish signals are generated when WPO crosses under 0
OverBought level is 2
OverSold level is -2
ExtremeOB level is 2.7
ExtremeOS level is -2.7
👍 Enjoying this indicator or find it useful? Please give me a like and follow! I post crypto analysis, price action strategies and free indicators regularly.
💬 Questions? Comments? Want to get access to an entire suite of proven trading indicators? Come visit us on telegram and chat, or just soak up some knowledge. We make timely posts about the market, news, and strategy everyday. Our community isn't open only to subscribers - everyone is welcome to join.
For Trialers & Chat: t.me

⚛SHO - Simple Harmonic Oscillator by Cryptorhythms⚛SHO - Simple Harmonic Oscillator by Cryptorhythms
Intro
SHO – Simple Harmonic Oscillator - A Time Cycle Oscillator. Published in IFTA Journal 2018 by Akram El Sherbini.
Description
Bullish signals are generated when SHO crosses over 0
Bearish signals are generated when SHO crosses under 0
OverBought level is 40
OverSold level is -40
ExtremeOB level is 60
ExtremeOS level is -60
As with most oscillators, divergences can be taken advantage of.
Zero line represent the point of control between bears and bulls. A companion indicator to the Simple Harmonic Index ()
👍 Enjoying this indicator or find it useful? Please give me a like and follow! I post crypto analysis, price action strategies and free indicators regularly.
💬 Questions? Comments? Want to get access to an entire suite of proven trading indicators? Come visit us on telegram and chat, or just soak up some knowledge. We make timely posts about the market, news, and strategy everyday. Our community isn't open only to subscribers - everyone is welcome to join.
For Trialers & Chat: t.me
