Root Deviation Loop | Lyro RSThe Root Deviation Loop indicator is a multi-mode trend signal tool that detects price momentum and breakout conditions using Root Mean Square Deviation (RMSD) instead of standard deviation. It provides a flexible framework for analyzing market conditions through three distinct signal generation methods: Bollinger Band-style deviation, a loop-based scoring system, and a hybrid combined signal. These modes help highlight trend continuation or reversal zones with a focus on smoothing out noise and avoiding extreme outlier effects.
Indicator Modes
Bollinger-Style RMSD Bands
This mode plots upper and lower volatility bands using RMSD around a selected moving average. RMSD is used instead of standard deviation for a more stable measurement of price dispersion. The formula for the bands is:
Upper Band = Moving Average + (RMSD × Multiplier)
Lower Band = Moving Average − (RMSD × Multiplier)
The bands dynamically expand and contract based on market volatility. Crossovers above or below these bands are used to signal trend shifts or breakouts.
For-Loop Momentum Scoring
This mode calculates a loop-based trend score by comparing the RMSD-weighted source to its historical values within a defined range. The loop evaluates the directional bias of price changes:
If the current value is greater than past values, it adds to the score.
If it is lower, it subtracts from the score.
This produces a net momentum score used to determine bullish or bearish dominance.
RMSD Weighted Source = (Price × RMSD) / RMSD
Score = Sum over loop: (src > src ) ? +1 : -1
Combined Signal
This mode merges the outputs of the Bollinger RMSD and For-Loop modes. It averages both signals into a single composite score. A long or short signal is generated based on whether the combined score crosses above or below user-defined thresholds.
Signal Interpretation
In the Bollinger Bands mode, signals are generated based on price interaction with the RMSD bands:
A long signal occurs when price crosses above the upper RMSD band
A short signal occurs when price crosses below the lower RMSD band
No signal is produced when price remains between bands
These signals suggest potential breakout points when price momentum exceeds recent volatility-defined boundaries.
⚠️Disclaimer
This indicator is a technical analysis tool and does not guarantee results. It should be used in conjunction with additional analysis methods and proper risk management strategies. The creators of this indicator are not responsible for any financial decisions made based on its signals.
Toolkit

Mean Deviation Loop | Lyro RSThe MAD Bollinger Bands + Loops is a sophisticated technical analysis tool designed to identify and quantify market trends by combining dynamic moving averages with robust statistical dispersion measures. This indicator employs a multi-model approach, integrating Bollinger-style MAD bands, for-loop momentum scoring, and a hybrid signal system to provide traders with adaptive insights across varying market conditions.
Indicator Modes
Bollinger-Style MAD Bands
This mode calculates dynamic volatility bands around price using Mean Absolute Deviation (MAD) instead of standard deviation or RMSE. MAD offers a smoother and more outlier-resistant measure of price dispersion.
Upper Band = Dynamic Moving Average + (MAD × Multiplier)
Lower Band = Dynamic Moving Average − (MAD × Multiplier)
These bands expand and contract with market volatility, helping to identify potential breakout and breakdown zones with reduced sensitivity to extreme price spikes.
For-Loop Momentum Scoring
Momentum is evaluated by analyzing recent price behavior through a loop-based comparison system applied to a MAD-weighted price series.
A rising momentum score indicates strengthening bullish pressure
A declining momentum score signals increasing bearish dominance
This method emphasizes directional consistency rather than short-term noise.
Hybrid Combined Signal
This mode combines the outputs of the MAD Bands and For-Loop Momentum Scoring into a unified directional signal.
+1 indicates bullish conditions (green)
−1 indicates bearish conditions (red)
An average of these scores is calculated to generate a combined signal, providing a clearer and more reliable indication of overall market trend.
Practical Application
Signal Interpretation
A buy signal is generated when both the MAD Bands and For-Loop Momentum align bullishly.
A sell signal is generated when both components align bearishly.
Trend Confirmation
The Hybrid Combined Signal serves as a confirmation layer, helping traders validate trend direction and reduce the likelihood of false signals during choppy or low-volatility conditions.
⚠️ Disclaimer
This indicator is a technical analysis tool and does not guarantee results. It should be used in conjunction with additional analysis methods and proper risk management strategies. The creators of this indicator are not responsible for any financial decisions made based on its signals.

eBacktesting: MultieBacktesting: Multi is an all-in-one chart toolkit built for structured day-trading study: multi-timeframe levels, “clean” movement zones, session context, bias, candle normalization, gaps, and a powerful alert system — all from one indicator.
What it can show on your chart
1) Multi-timeframe Support/Resistance (S/R) markup
- Detects and plots S/R levels from up to 8 configurable timeframes (mix HTF + LTF).
- Optional labeling styles: Simple, Type (S/R), or Directional.
- Optional price labels next to levels.
- Levels cleanup (decongestion): hides clustered levels to keep the chart readable
- Grouping: can group timeframes that share the same level into a single line.
- Level invalidation: levels can disappear after X passthroughs (with a “getting weaker” dashed style when close to invalidation).
2) Psychological levels (round numbers)
- Automatically draws round-number lines at a practical interval (with optional manual interval control).
- Has smart defaults for common markets (e.g., indices, BTC, metals).
3) Levels heatmap
- Shows level density as shaded “pressure areas”: areas where an agglomeration of S/R levels are present
- Can be simple or persisted (so you can study where price repeatedly reacts)
4) Repeated levels highlight
- Highlights “same area again” levels using a tolerance setting.
- Can require same direction (support with support / resistance with resistance) or allow any direction.
5) LTAs (Low Traffic Areas)
- Marks “air pockets” between levels where price can travel fast.
- Can be built from:
- S/R spacing (between detected levels), or
- Candle sequences (clean directional runs).
- Optional filters:
- By how “untouched” the boundary levels are (passthrough filter)
- By number of candles
- By size (points)
6) Clean zones (candle-based)
- Detects strong same-direction runs and boxes them as “clean zones” for study and backtesting practice.
7) Session Bias
- Computes a bias score from selected timeframes and shows it as a %.
- Can be weighted, inverted weight, or not weighted across timeframes (e.g. HTF candles having more weight towards bias calculation).
- Optional color coded “bias candles” overlay + option to dim weak candles so the signal is clearer.
- Alert when bias flips bullish/bearish/neutral.
8) Candles tools
- Smooth candles: removes candle gaps by drawing candles with open = previous close (useful for price action analysis).
- Ghost current candle: de-emphasizes the still-forming candle until it’s near completion (useful for not going in FOMO).
- Highlight no-wick candles: helps spot strong displacement / clean opens/closes.
- Snap candles: rounds candles to a chosen interval (ATR % or fixed), for cleaner structure reading.
- Optional candle stats: ATR & Average candle size
- Candle score: rates the last candle’s strength (body/wicks/size + context), useful for quick quality checks.
- Gaps: highlights unfilled gaps and optionally removes them once filled.
9) Sessions
- Up to 4 customizable sessions, each with its own color and optional background highlight.
- Option to hide candles outside session hours (great for focused session study).
10) Notifications
- Before session start alerts (X minutes early).
- Before session end alerts (X minutes early).
- Closing beyond detected S/R levels
- Closing beyond custom prices: type your prices (one per line)
- Proximity allowance + “advance notice” option for getting notified 30s/1m/5m before the candle closes based on your preferences
- Timer alerts (“check chart every X minutes”) with a custom message template.
eBacktesting integration (the important part)
This indicator fully integrates with the eBacktesting extension to automatically detect “important moments” during backtesting, so it can auto-pause, tag, and allow you to practice them step-by-step.
- When bias changed
- When a candle closed beyond an automatically detected S/R level
- When a candle closed beyond your custom price
- When new LTAs & clean zones are detected or invalidated
These indicator is built to pair perfectly with the eBacktesting extension, where traders can practice these concepts step-by-step. Backtesting concepts visually like this is one of the fastest ways to learn, build confidence, and improve trading performance.
Educational use only. Not financial advice.

BE-Indicator Aggregator toolkit█ Overview:
BE-Indicator Aggregator toolkit is a toolkit which is built for those we rely on taking multi-confirmation from different indicators available with the traders. This Toolkit aid's traders in understanding their custom logic for their trade setups and provides the summarized results on how it performed over the past.
█ How It Works:
Load the external indicator plots in the indicator input setting
Provide your custom logic for the trade setup
Set your expected SL & TP values
█ Legends, Definitions & Logic Building Rules:
Building the logic for your trade setup plays a pivotal role in the toolkit, it shall be broken into parts and toolkit aims to understand each of the logical parts of your setup and interpret the outcome as trade accuracy.
Toolkit broadly aims to understand 4 types of inputs in "Condition Builder"
Comments : Line which starts with single quotation ( ' ) shall be ignored by toolkit while understanding the logic.
Note: Blank line space or less than 3 characters are treated equally to comments.
Long Condition: Line which starts with " L- " shall be considered for identifying Long setups.
Short Condition: Line which starts with " S- " shall be considered for identifying Short setups.
Variables: Line which starts with " VAR- " shall be considered as variables. Variables can be one such criteria for Long or short condition.
Building Rules: Define all variables first then specify the condition. The usual declare and assign concept of programming. :p)
Criteria Rules: Criteria are individual logic for your one parent condition. multiple criteria can be present in one condition. Each parameter should be delimited with ' | ' key and each criteria should be delimited with ' , ' (Comma with a space - IMPORTANT!!!)
█ Sample Codes for Conditional Builder:
For Trading Long when Open = Low
For Trading Short when Open = High with a Red candle
'Long Setup <---- Comment
L-O|E|L
' E <- in the above line refers to Equals ' = '
'Short Setup
S-AND:O|E|H, O|G|C
' 2 Criteria for used building one condition. Since, both have to satisfied used "AND:" logic.
Understanding of Operator Legends:
"E" => Refers to Equals
"NE" => Refers to Not Equals
"NEOR" => Logical value is Either Comparing value 1 or Comparing value 2
"NEAND" => Logical value is Comparing value 1 And Comparing value 2
"G" => Logical value Greater than Comparing value 1
"GE" => Logical value Greater than and equal to Comparing value 1
"L" => Logical value Lesser than Comparing value 1
"LE" => Logical value Lesser than and equal to Comparing value 1
"B" => Logical value is Between Comparing value 1 & Comparing value 2
"BE" => Logical value is Between or Equal to Comparing value 1 & Comparing value 2
"OSE" => Logical value is Outside of Comparing value 1 & Comparing value 2
"OSI" => Logical value is Outside or Equal to Comparing value 1 & Comparing value 2
"ERR" => Logical value is 'na'
"NERR" => Logical value is not 'na'
"CO" => Logical value Crossed Over Comparing value 1
"CU" => Logical value Crossed Under Comparing value 1
Understanding of Condition Legends:
AND: -> All criteria's to be satisfied for the condition to be True.
NAND: -> Output of AND condition shall be Inversed for the condition to be True.
OR: -> One of criteria to be satisfied for the condition to be True.
NOR: -> Output of OR condition shall be Inversed for the condition to be True.
ATLEAST:X: -> At-least X no of criteria to be satisfied for the condition to be True.
Note: "X" can be any number
NATLEAST:X: -> Output of ATLEAST condition shall be Inversed for the condition to be True
WASTRUE:X: -> Single criteria WAS TRUE within X bar in past for the condition to be True.
Note: "X" can be any number.
ISTRUE:X: -> Single criteria is TRUE since X bar in past for the condition to be True.
Note: "X" can be any number.
Understanding of Variable Legends:
While Condition Supports 8 Types, Variable supports only 6 Types listed below
AND: -> All criteria's to be satisfied for the Variable to be True.
NAND: -> Output of AND condition shall be Inversed for the Variable to be True.
OR: -> One of criteria to be satisfied for the Variable to be True.
NOR: -> Output of OR condition shall be Inversed for the Variable to be True.
ATLEAST:X: -> At-least X no of criteria to be satisfied for the Variable to be True.
Note: "X" can be any number
NATLEAST:X: -> Output of ATLEAST condition shall be Inversed for the Variable to be True
█ Sample Outputs with Logics:
1. RSI Indicator + Technical Indicator: StopLoss: 2.25 against Reward ratio of 1.75 (3.94 value)
Plots Used in Indicator Settings:
Source 1:- RSI
Source 2:- RSI Based MA
Source 3:- Strong Buy
Source 4:- Strong Sell
Logic Used:
For Long Setup : RSI Should be above RSI Based MA, RSI has been Rising when compared to 3 candles ago, Technical Indicator signaled for a Strong Buy on the current candle, however in last 6 candles Technical indicator signaled for Strong Sell.
Similarly Inverse for Short Setup.
L-AND:ES1|GE|ES2, ES1|G|ES1
L-ES3|E|1
L-OR:ES4 |E|1, ES4 |E|1, ES4 |E|1, ES4 |E|1, ES4 |E|1, ES4 |E|1
S-AND:ES1|LE|ES2, ES1|L|ES1
S-ES4|E|1
S-OR:ES3 |E|1, ES3 |E|1, ES3 |E|1, ES3 |E|1, ES3 |E|1, ES3 |E|1
'Note: Last OR condition can also be written by using WASTRUE definition like below
'L-WASTRUE:6:ES4|E|1
'S-WASTRUE:6:ES3|E|1
Output:
2. Volumatic Support / Resistance Levels :
Plots Used in Indicator Settings:
Source 1:- Resistance
Source 2:- Support
Logic Used:
For Long Setup : Long Trade on Liquidity Support.
For Short Setup : Short Trade on Liquidity Resistance.
'Variable Named "ChkLowTradingAbvSupport" is declared to check if last 3 candles is trading above support line of liquidity.
VAR-ChkLowTradingAbvSupport:AND:L|G|ES2, L |G|ES2, L |G|ES2
'Variable Named "ChkCurBarClsdAbv4thBarHigh" is declared to check if current bar closed above the high of previous candle where the Liquidity support is taken (4th Bar).
VAR-ChkCurBarClsdAbv4thBarHigh:OR:C|GE|H , L|G|H
'Combining Condition and Variable to Initiate Long Trade Logic
L-L |LE|ES2
L-AND:ChkLowTradingAbvSupport, ChkCurBarClsdAbv4thBarHigh
VAR-ChkHghTradingBlwRes:AND:H|L|ES1, H |L|ES1, H |L|ES1
VAR-ChkCurBarClsdBlw4thBarLow:OR:C|LE|L , H|L|L
S-H |GE|ES1
S-AND:ChkHghTradingBlwRes, ChkCurBarClsdBlw4thBarLow
Output 1: Day Trading Version
Output 2: Scalper Version
Output 3: Position Version

Trending Market Toolkit [LuxAlgo]The Trending Market Toolkit focuses exclusively on trending market structures and high-confluence, high-risk-to-reward entry models. It is designed to complement discretionary trading by offering different entry strategies based on market structure.
🔶 USAGE
In the chart above we can see how the tool detects several reversals, draws the broken trendlines, the reversal areas from which the tool starts looking for a trigger, and when it finally happens, a potential trade with risk and reward areas and the risk/reward ratio.
🔹 Detection Mode
Traders can choose between three different modes: trend only, reversal only, or both.
If both are active, reversals have priority over trends, so the tool will not detect a trend if a reversal is active.
In the chart above we can see all three modes.
🔹 Detection on Higher Timeframes
Traders can choose to identify structures on the chart timeframe or on a higher timeframe.
In the chart above, we have the SP500 futures on the 5m timeframe with different settings: chart timeframe, 30m, and 1H.
🔹 Risk And Targets
Depending on whether the high-risk/reward parameter is enabled, traders can choose between three different targets and two different stops.
The chart above shows how different choices affect the risk/reward ratio for the same potential trade on the Gold Futures 2m chart.
🔶 SETTINGS
Show: Traders can choose between Trends, Reversals or Both.
🔹 Structures
Swing Length: Number of candles to confirm a swing high or swing low. A higher number detects larger swings.
Custom Timeframe: Traders can make use of the current chart timeframe, or choose a custom timeframe.
Reversal Area Threshold: A higher number increases the reversal area.
🔹 Trades
Trade Trigger Length: Number of candles to confirm an internal high or internal low. A lower number detects smaller swings. It must be the same size or smaller than the swing length.
Target: Traders can choose between the default target (0) or two extended targets (0.27 or 0.618).
Risk to Reward Threshold: Set the minimum risk-to-reward ratio to detect trades. Use the 0 value to detect all trades.
High Risk to Reward: Enable/Disable the high risk to reward mode.

lib_kernelLibrary "lib_kernel"
Library "lib_kernel"
This is a tool / library for developers, that contains several common and adapted kernel functions as well as a kernel regression function and enum to easily select and embed a list into the settings dialog.
How to Choose and Modify Kernels in Practice
Compact Support Kernels (e.g., Epanechnikov, Triangular): Use for localized smoothing and emphasizing nearby data.
Oscillatory Kernels (e.g., Wave, Cosine): Ideal for detecting periodic patterns or mean-reverting behavior.
Smooth Tapering Kernels (e.g., Gaussian, Logistic): Use for smoothing long-term trends or identifying global price behavior.
kernel_Epanechnikov(u)
Parameters:
u (float)
kernel_Epanechnikov_alt(u, sensitivity)
Parameters:
u (float)
sensitivity (float)
kernel_Triangular(u)
Parameters:
u (float)
kernel_Triangular_alt(u, sensitivity)
Parameters:
u (float)
sensitivity (float)
kernel_Rectangular(u)
Parameters:
u (float)
kernel_Uniform(u)
Parameters:
u (float)
kernel_Uniform_alt(u, sensitivity)
Parameters:
u (float)
sensitivity (float)
kernel_Logistic(u)
Parameters:
u (float)
kernel_Logistic_alt(u)
Parameters:
u (float)
kernel_Logistic_alt2(u, sigmoid_steepness)
Parameters:
u (float)
sigmoid_steepness (float)
kernel_Gaussian(u)
Parameters:
u (float)
kernel_Gaussian_alt(u, sensitivity)
Parameters:
u (float)
sensitivity (float)
kernel_Silverman(u)
Parameters:
u (float)
kernel_Quartic(u)
Parameters:
u (float)
kernel_Quartic_alt(u, sensitivity)
Parameters:
u (float)
sensitivity (float)
kernel_Biweight(u)
Parameters:
u (float)
kernel_Triweight(u)
Parameters:
u (float)
kernel_Sinc(u)
Parameters:
u (float)
kernel_Wave(u)
Parameters:
u (float)
kernel_Wave_alt(u)
Parameters:
u (float)
kernel_Cosine(u)
Parameters:
u (float)
kernel_Cosine_alt(u, sensitivity)
Parameters:
u (float)
sensitivity (float)
kernel(u, select, alt_modificator)
wrapper for all standard kernel functions, see enum Kernel comments and function descriptions for usage szenarios and parameters
Parameters:
u (float)
select (series Kernel)
alt_modificator (float)
kernel_regression(src, bandwidth, kernel, exponential_distance, alt_modificator)
wrapper for kernel regression with all standard kernel functions, see enum Kernel comments for usage szenarios. performance optimized version using fixed bandwidth and target
Parameters:
src (float) : input data series
bandwidth (simple int) : sample window of nearest neighbours for the kernel to process
kernel (simple Kernel) : type of Kernel to use for processing, see Kernel enum or respective functions for more details
exponential_distance (simple bool) : if true this puts more emphasis on local / more recent values
alt_modificator (float) : see kernel functions for parameter descriptions. Mostly used to pronounce emphasis on local values or introduce a decay/dampening to the kernel output

lib_smcLibrary "lib_smc"
This is an adaptation of LuxAlgo's Smart Money Concepts indicator with numerous changes. Main changes include integration of object based plotting, plenty of performance improvements, live tracking of Order Blocks, integration of volume profiles to refine Order Blocks, and many more.
This is a library for developers, if you want this converted into a working strategy, let me know.
buffer(item, len, force_rotate)
Parameters:
item (float)
len (int)
force_rotate (bool)
buffer(item, len, force_rotate)
Parameters:
item (int)
len (int)
force_rotate (bool)
buffer(item, len, force_rotate)
Parameters:
item (Profile type from robbatt/lib_profile/32)
len (int)
force_rotate (bool)
swings(len)
INTERNAL: detect swing points (HH and LL) in given range
Parameters:
len (simple int) : range to check for new swing points
Returns: values are the price level where and if a new HH or LL was detected, else na
method init(this)
Namespace types: OrderBlockConfig
Parameters:
this (OrderBlockConfig)
method delete(this)
Namespace types: OrderBlock
Parameters:
this (OrderBlock)
method clear_broken(this, broken_buffer)
INTERNAL: delete internal order blocks box coordinates if top/bottom is broken
Namespace types: map
Parameters:
this (map)
broken_buffer (map)
Returns: any_bull_ob_broken, any_bear_ob_broken, broken signals are true if an according order block was broken/mitigated, broken contains the broken block(s)
create_ob(id, mode, start_t, start_i, top, end_t, end_i, bottom, break_price, early_confirmation_price, config, init_plot, force_overlay)
INTERNAL: set internal order block coordinates
Parameters:
id (int)
mode (int) : 1: bullish, -1 bearish block
start_t (int)
start_i (int)
top (float)
end_t (int)
end_i (int)
bottom (float)
break_price (float)
early_confirmation_price (float)
config (OrderBlockConfig)
init_plot (bool)
force_overlay (bool)
Returns: signals are true if an according order block was broken/mitigated
method align_to_profile(block, align_edge, align_break_price)
Namespace types: OrderBlock
Parameters:
block (OrderBlock)
align_edge (bool)
align_break_price (bool)
method create_profile(block, opens, tops, bottoms, closes, values, resolution, vah_pc, val_pc, args, init_calculated, init_plot, force_overlay)
Namespace types: OrderBlock
Parameters:
block (OrderBlock)
opens (array)
tops (array)
bottoms (array)
closes (array)
values (array)
resolution (int)
vah_pc (float)
val_pc (float)
args (ProfileArgs type from robbatt/lib_profile/32)
init_calculated (bool)
init_plot (bool)
force_overlay (bool)
method create_profile(block, resolution, vah_pc, val_pc, args, init_calculated, init_plot, force_overlay)
Namespace types: OrderBlock
Parameters:
block (OrderBlock)
resolution (int)
vah_pc (float)
val_pc (float)
args (ProfileArgs type from robbatt/lib_profile/32)
init_calculated (bool)
init_plot (bool)
force_overlay (bool)
track_obs(swing_len, hh, ll, top, btm, bull_bos_alert, bull_choch_alert, bear_bos_alert, bear_choch_alert, min_block_size, max_block_size, config_bull, config_bear, init_plot, force_overlay, enabled, extend_blocks, clear_broken_buffer_before, align_edge_to_value_area, align_break_price_to_poc, profile_args_bull, profile_args_bear, use_soft_confirm, soft_confirm_offset, use_retracements_with_FVG_out)
Parameters:
swing_len (int)
hh (float)
ll (float)
top (float)
btm (float)
bull_bos_alert (bool)
bull_choch_alert (bool)
bear_bos_alert (bool)
bear_choch_alert (bool)
min_block_size (float)
max_block_size (float)
config_bull (OrderBlockConfig)
config_bear (OrderBlockConfig)
init_plot (bool)
force_overlay (bool)
enabled (bool)
extend_blocks (simple bool)
clear_broken_buffer_before (simple bool)
align_edge_to_value_area (simple bool)
align_break_price_to_poc (simple bool)
profile_args_bull (ProfileArgs type from robbatt/lib_profile/32)
profile_args_bear (ProfileArgs type from robbatt/lib_profile/32)
use_soft_confirm (simple bool)
soft_confirm_offset (float)
use_retracements_with_FVG_out (simple bool)
method draw(this, config, extend_only)
Namespace types: OrderBlock
Parameters:
this (OrderBlock)
config (OrderBlockConfig)
extend_only (bool)
method draw(blocks, config)
INTERNAL: plot order blocks
Namespace types: array
Parameters:
blocks (array)
config (OrderBlockConfig)
method draw(blocks, config)
INTERNAL: plot order blocks
Namespace types: map
Parameters:
blocks (map)
config (OrderBlockConfig)
method cleanup(this, ob_bull, ob_bear)
removes all Profiles that are older than the latest OrderBlock from this profile buffer
Namespace types: array
Parameters:
this (array type from robbatt/lib_profile/32)
ob_bull (OrderBlock)
ob_bear (OrderBlock)
_plot_swing_points(mode, x, y, show_swing_points, linecolor_swings, keep_history, show_latest_swings_levels, trail_x, trail_y, trend)
INTERNAL: plot swing points
Parameters:
mode (int) : 1: bullish, -1 bearish block
x (int) : x-coordingate of swing point to plot (bar_index)
y (float) : y-coordingate of swing point to plot (price)
show_swing_points (bool) : switch to enable/disable plotting of swing point labels
linecolor_swings (color) : color for swing point labels and lates level lines
keep_history (bool) : weater to remove older swing point labels and only keep the most recent
show_latest_swings_levels (bool)
trail_x (int) : x-coordinate for latest swing point (bar_index)
trail_y (float) : y-coordinate for latest swing point (price)
trend (int) : the current trend 1: bullish, -1: bearish, to determine Strong/Weak Low/Highs
_pivot_lvl(mode, trend, hhll_x, hhll, super_hhll, filter_insignificant_internal_breaks)
INTERNAL: detect whether a structural level has been broken and if it was in trend direction (BoS) or against trend direction (ChoCh), also track the latest high and low swing points
Parameters:
mode (simple int) : detect 1: bullish, -1 bearish pivot points
trend (int) : current trend direction
hhll_x (int) : x-coordinate of newly detected hh/ll (bar_index)
hhll (float) : y-coordinate of newly detected hh/ll (price)
super_hhll (float) : level/y-coordinate of superior hhll (if this is an internal structure pivot level)
filter_insignificant_internal_breaks (bool) : if true pivot points / internal structure will be ignored where the wick in trend direction is longer than the opposite (likely to push further in direction of main trend)
Returns: coordinates of internal structure that has been broken (x,y): start of structure, (trail_x, trail_y): tracking hh/ll after structure break, (bos_alert, choch_alert): signal whether a structural level has been broken
_plot_structure(x, y, is_bos, is_choch, line_color, line_style, label_style, label_size, keep_history)
INTERNAL: plot structural breaks (BoS/ChoCh)
Parameters:
x (int) : x-coordinate of newly broken structure (bar_index)
y (float) : y-coordinate of newly broken structure (price)
is_bos (bool) : whether this structural break was in trend direction
is_choch (bool) : whether this structural break was against trend direction
line_color (color) : color for the line connecting the structural level and the breaking candle
line_style (string) : style (line.style_dashed/solid) for the line connecting the structural level and the breaking candle
label_style (string) : style (label.style_label_down/up) for the label above/below the line connecting the structural level and the breaking candle
label_size (string) : size (size.small/tiny) for the label above/below the line connecting the structural level and the breaking candle
keep_history (bool) : weater to remove older swing point labels and only keep the most recent
structure_values(length, super_hh, super_ll, filter_insignificant_internal_breaks)
detect (and plot) structural breaks and the resulting new trend
Parameters:
length (simple int) : lookback period for swing point detection
super_hh (float) : level/y-coordinate of superior hh (for internal structure detection)
super_ll (float) : level/y-coordinate of superior ll (for internal structure detection)
filter_insignificant_internal_breaks (bool) : if true pivot points / internal structure will be ignored where the wick in trend direction is longer than the opposite (likely to push further in direction of main trend)
Returns: trend: direction 1:bullish -1:bearish, (bull_bos_alert, bull_choch_alert, top_x, top_y, trail_up_x, trail_up): whether and which level broke in a bullish direction, trailing high, (bbear_bos_alert, bear_choch_alert, tm_x, btm_y, trail_dn_x, trail_dn): same in bearish direction
structure_plot(trend, bull_bos_alert, bull_choch_alert, top_x, top_y, trail_up_x, trail_up, hh, bear_bos_alert, bear_choch_alert, btm_x, btm_y, trail_dn_x, trail_dn, ll, color_bull, color_bear, show_swing_points, show_latest_swings_levels, show_bos, show_choch, line_style, label_size, keep_history)
detect (and plot) structural breaks and the resulting new trend
Parameters:
trend (int) : crrent trend 1: bullish, -1: bearish
bull_bos_alert (bool) : if there was a bullish bos alert -> plot it
bull_choch_alert (bool) : if there was a bullish choch alert -> plot it
top_x (int) : latest shwing high x
top_y (float) : latest swing high y
trail_up_x (int) : trailing high x
trail_up (float) : trailing high y
hh (float) : if there was a higher high
bear_bos_alert (bool) : if there was a bearish bos alert -> plot it
bear_choch_alert (bool) : if there was a bearish chock alert -> plot it
btm_x (int) : latest swing low x
btm_y (float) : latest swing low y
trail_dn_x (int) : trailing low x
trail_dn (float) : trailing low y
ll (float) : if there was a lower low
color_bull (color) : color for bullish BoS/ChoCh levels
color_bear (color) : color for bearish BoS/ChoCh levels
show_swing_points (bool) : whether to plot swing point labels
show_latest_swings_levels (bool) : whether to track and plot latest swing point levels with lines
show_bos (bool) : whether to plot BoS levels
show_choch (bool) : whether to plot ChoCh levels
line_style (string) : whether to plot BoS levels
label_size (string) : label size of plotted BoS/ChoCh levels
keep_history (bool) : weater to remove older swing point labels and only keep the most recent
structure(length, color_bull, color_bear, super_hh, super_ll, filter_insignificant_internal_breaks, show_swing_points, show_latest_swings_levels, show_bos, show_choch, line_style, label_size, keep_history, enabled)
detect (and plot) structural breaks and the resulting new trend
Parameters:
length (simple int) : lookback period for swing point detection
color_bull (color) : color for bullish BoS/ChoCh levels
color_bear (color) : color for bearish BoS/ChoCh levels
super_hh (float) : level/y-coordinate of superior hh (for internal structure detection)
super_ll (float) : level/y-coordinate of superior ll (for internal structure detection)
filter_insignificant_internal_breaks (bool) : if true pivot points / internal structure will be ignored where the wick in trend direction is longer than the opposite (likely to push further in direction of main trend)
show_swing_points (bool) : whether to plot swing point labels
show_latest_swings_levels (bool) : whether to track and plot latest swing point levels with lines
show_bos (bool) : whether to plot BoS levels
show_choch (bool) : whether to plot ChoCh levels
line_style (string) : whether to plot BoS levels
label_size (string) : label size of plotted BoS/ChoCh levels
keep_history (bool) : weater to remove older swing point labels and only keep the most recent
enabled (bool)
_check_equal_level(mode, len, eq_threshold, enabled)
INTERNAL: detect equal levels (double top/bottom)
Parameters:
mode (int) : detect 1: bullish/high, -1 bearish/low pivot points
len (int) : lookback period for equal level (swing point) detection
eq_threshold (float) : maximum price offset for a level to be considered equal
enabled (bool)
Returns: eq_alert whether an equal level was detected and coordinates of the first and the second level/swing point
_plot_equal_level(show_eq, x1, y1, x2, y2, label_txt, label_style, label_size, line_color, line_style, keep_history)
INTERNAL: plot equal levels (double top/bottom)
Parameters:
show_eq (bool) : whether to plot the level or not
x1 (int) : x-coordinate of the first level / swing point
y1 (float) : y-coordinate of the first level / swing point
x2 (int) : x-coordinate of the second level / swing point
y2 (float) : y-coordinate of the second level / swing point
label_txt (string) : text for the label above/below the line connecting the equal levels
label_style (string) : style (label.style_label_down/up) for the label above/below the line connecting the equal levels
label_size (string) : size (size.tiny) for the label above/below the line connecting the equal levels
line_color (color) : color for the line connecting the equal levels (and it's label)
line_style (string) : style (line.style_dotted) for the line connecting the equal levels
keep_history (bool) : weater to remove older swing point labels and only keep the most recent
equal_levels_values(len, threshold, enabled)
detect (and plot) equal levels (double top/bottom), returns coordinates
Parameters:
len (int) : lookback period for equal level (swing point) detection
threshold (float) : maximum price offset for a level to be considered equal
enabled (bool) : whether detection is enabled
Returns: (eqh_alert, eqh_x1, eqh_y1, eqh_x2, eqh_y2) whether an equal high was detected and coordinates of the first and the second level/swing point, (eql_alert, eql_x1, eql_y1, eql_x2, eql_y2) same for equal lows
equal_levels_plot(eqh_x1, eqh_y1, eqh_x2, eqh_y2, eql_x1, eql_y1, eql_x2, eql_y2, color_eqh, color_eql, show, keep_history)
detect (and plot) equal levels (double top/bottom), returns coordinates
Parameters:
eqh_x1 (int) : coordinates of first point of equal high
eqh_y1 (float) : coordinates of first point of equal high
eqh_x2 (int) : coordinates of second point of equal high
eqh_y2 (float) : coordinates of second point of equal high
eql_x1 (int) : coordinates of first point of equal low
eql_y1 (float) : coordinates of first point of equal low
eql_x2 (int) : coordinates of second point of equal low
eql_y2 (float) : coordinates of second point of equal low
color_eqh (color) : color for the line connecting the equal highs (and it's label)
color_eql (color) : color for the line connecting the equal lows (and it's label)
show (bool) : whether plotting is enabled
keep_history (bool) : weater to remove older swing point labels and only keep the most recent
Returns: (eqh_alert, eqh_x1, eqh_y1, eqh_x2, eqh_y2) whether an equal high was detected and coordinates of the first and the second level/swing point, (eql_alert, eql_x1, eql_y1, eql_x2, eql_y2) same for equal lows
equal_levels(len, threshold, color_eqh, color_eql, enabled, show, keep_history)
detect (and plot) equal levels (double top/bottom)
Parameters:
len (int) : lookback period for equal level (swing point) detection
threshold (float) : maximum price offset for a level to be considered equal
color_eqh (color) : color for the line connecting the equal highs (and it's label)
color_eql (color) : color for the line connecting the equal lows (and it's label)
enabled (bool) : whether detection is enabled
show (bool) : whether plotting is enabled
keep_history (bool) : weater to remove older swing point labels and only keep the most recent
Returns: (eqh_alert) whether an equal high was detected, (eql_alert) same for equal lows
_detect_fvg(mode, enabled, o, h, l, c, filter_insignificant_fvgs, change_tf)
INTERNAL: detect FVG (fair value gap)
Parameters:
mode (int) : detect 1: bullish, -1 bearish gaps
enabled (bool) : whether detection is enabled
o (float) : reference source open
h (float) : reference source high
l (float) : reference source low
c (float) : reference source close
filter_insignificant_fvgs (bool) : whether to calculate and filter small/insignificant gaps
change_tf (bool) : signal when the previous reference timeframe closed, triggers new calculation
Returns: whether a new FVG was detected and its top/mid/bottom levels
_clear_broken_fvg(mode, upper_boxes, lower_boxes)
INTERNAL: clear mitigated FVGs (fair value gaps)
Parameters:
mode (int) : detect 1: bullish, -1 bearish gaps
upper_boxes (array) : array that stores the upper parts of the FVG boxes
lower_boxes (array) : array that stores the lower parts of the FVG boxes
_plot_fvg(mode, show, top, mid, btm, border_color, extend_box)
INTERNAL: plot (and clear broken) FVG (fair value gap)
Parameters:
mode (int) : plot 1: bullish, -1 bearish gap
show (bool) : whether plotting is enabled
top (float) : top level of fvg
mid (float) : center level of fvg
btm (float) : bottom level of fvg
border_color (color) : color for the FVG box
extend_box (int) : how many bars into the future the FVG box should be extended after detection
fvgs_values(o, h, l, c, filter_insignificant_fvgs, change_tf, enabled)
detect (and plot / clear broken) FVGs (fair value gaps), and return alerts and level values
Parameters:
o (float) : reference source open
h (float) : reference source high
l (float) : reference source low
c (float) : reference source close
filter_insignificant_fvgs (bool) : whether to calculate and filter small/insignificant gaps
change_tf (bool) : signal when the previous reference timeframe closed, triggers new calculation
enabled (bool) : whether detection is enabled
Returns: (bullish_fvg_alert, bull_top, bull_mid, bull_btm): whether a new bullish FVG was detected and its top/mid/bottom levels, (bearish_fvg_alert, bear_top, bear_mid, bear_btm): same for bearish FVGs
fvgs_plot(bullish_fvg_alert, bull_top, bull_mid, bull_btm, bearish_fvg_alert, bear_top, bear_mid, bear_btm, color_bull, color_bear, extend_box, show)
Parameters:
bullish_fvg_alert (bool)
bull_top (float)
bull_mid (float)
bull_btm (float)
bearish_fvg_alert (bool)
bear_top (float)
bear_mid (float)
bear_btm (float)
color_bull (color) : color for bullish FVG boxes
color_bear (color) : color for bearish FVG boxes
extend_box (int) : how many bars into the future the FVG box should be extended after detection
show (bool) : whether plotting is enabled
Returns: (bullish_fvg_alert, bull_top, bull_mid, bull_btm): whether a new bullish FVG was detected and its top/mid/bottom levels, (bearish_fvg_alert, bear_top, bear_mid, bear_btm): same for bearish FVGs
fvgs(o, h, l, c, filter_insignificant_fvgs, change_tf, color_bull, color_bear, extend_box, enabled, show)
detect (and plot / clear broken) FVGs (fair value gaps)
Parameters:
o (float) : reference source open
h (float) : reference source high
l (float) : reference source low
c (float) : reference source close
filter_insignificant_fvgs (bool) : whether to calculate and filter small/insignificant gaps
change_tf (bool) : signal when the previous reference timeframe closed, triggers new calculation
color_bull (color) : color for bullish FVG boxes
color_bear (color) : color for bearish FVG boxes
extend_box (int) : how many bars into the future the FVG box should be extended after detection
enabled (bool) : whether detection is enabled
show (bool) : whether plotting is enabled
Returns: (bullish_fvg_alert): whether a new bullish FVG was detected, (bearish_fvg_alert): same for bearish FVGs
OrderBlock
Fields:
id (series int)
dir (series int)
left_top (chart.point)
right_bottom (chart.point)
break_price (series float)
early_confirmation_price (series float)
ltf_high (array)
ltf_low (array)
ltf_volume (array)
plot (Box type from robbatt/lib_plot_objects/49)
profile (Profile type from robbatt/lib_profile/32)
trailing (series bool)
extending (series bool)
awaiting_confirmation (series bool)
touched_break_price_before_confirmation (series bool)
soft_confirmed (series bool)
has_fvg_out (series bool)
hidden (series bool)
broken (series bool)
OrderBlockConfig
Fields:
show (series bool)
show_last (series int)
show_id (series bool)
show_profile (series bool)
args (BoxArgs type from robbatt/lib_plot_objects/49)
txt (series string)
txt_args (BoxTextArgs type from robbatt/lib_plot_objects/49)
delete_when_broken (series bool)
broken_args (BoxArgs type from robbatt/lib_plot_objects/49)
broken_txt (series string)
broken_txt_args (BoxTextArgs type from robbatt/lib_plot_objects/49)
broken_profile_args (ProfileArgs type from robbatt/lib_profile/32)
use_profile (series bool)
profile_args (ProfileArgs type from robbatt/lib_profile/32)

TrendLine Toolkit w/ Breaks (Real-Time)The TrendLine Toolkit script introduces an innovating capability by extending the conventional use of trendlines beyond price action to include oscillators and other technical indicators. This tool allows traders to automatically detect and display trendlines on any TradingView built-in oscillator or community-built script, offering a versatile approach to trend analysis. With breakout detection and real-time alerts, this script enhances the way traders interpret trends in various indicators.
🔲 Methodology
Trendlines are a fundamental tool in technical analysis used to identify and visualize the direction and strength of a price trend. They are drawn by connecting two or more significant points on a price chart, typically the highs or lows of consecutive price movements (pivots).
Drawing Trendlines:
Uptrend Line - Connects a series of higher lows. It signals an upward price trend.
Downtrend Line - Connects a series of lower highs. It indicates a downward price trend.
Support and Resistance:
Support Line - A trendline drawn under rising prices, indicating a level where buying interest is historically strong.
Resistance Line - A trendline drawn above falling prices, showing a level where selling interest historically prevails.
Identification of Trends:
Uptrend - Prices making higher highs and higher lows.
Downtrend - Prices making lower highs and lower lows.
Sideways (or Range-bound) - Prices moving within a horizontal range.
A trendline helps confirm the existence and direction of a trend, providing guidance in aligning with the prevailing market sentiment. Additionally, they are usually paired with breakout analysis, a breakout occurs when the price breaches a trendline. This signals a potential change in trend direction or an acceleration of the existing trend.
The script adapts this methodology to oscillators and other indicators. Instead of relying on price pivots, which can only be detected in retrospect, the script utilizes a trailing stop on the oscillator to identify potential swings in real-time, you may find more info about it here (SuperTrend toolkit) . We detect swings or pivots simply by testing for crosses between the indicator and its trailing stop.
type oscillator
float o = Oscillator Value
float s = Trailing Stop Value
oscillator osc = oscillator.new()
bool l = ta.crossunder(osc.o, osc.s) => Utilized as a formed high
bool h = ta.crossover (osc.o, osc.s) => Utilized as a formed low
This approach enables the algorithm to detect trendlines between consecutive pivot highs or lows on the oscillator itself, providing a dynamic and immediate representation of trend dynamics.
🔲 Breakout Detection
The script goes beyond trendline creation by incorporating breakout detection directly within the oscillator. After identifying a trendline, the algorithm continuously monitors the oscillator for potential breakouts, signaling shifts in market sentiment.
🔲 Setup Guide
A simple example on one of my public scripts, Z-Score Heikin-Ashi Transformed
🔲 Settings
Source - Choose an oscillator source of which to base the Toolkit on.
Zeroing - The Mid-Line value of the oscillator, for example RSI & MFI use 50.
Sensitivity - Calibrates the Sensitivity of which TrendLines are detected, higher values result in more detections.
🔲 Alerts
Bearish TrendLine
Bullish TrendLine
Bearish Breakout
Bullish Breakout
As well as the option to trigger 'any alert' call.
By integrating trendline analysis into oscillators, this Toolkit enhances the capabilities of technical analysis, bringing a dynamic and comprehensive approach to identifying trends, support/resistance levels, and breakout signals across various indicators.

ICT Killzones Toolkit [LuxAlgo]The ICT Killzones Toolkit is a comprehensive set of tools designed to assist traders in identifying key trading zones and patterns within the market.
The ICT Killzones Toolkit includes the following Price Action components:
ICT Killzones with Pivot Highs/Lows
Order Blocks
Breaker Blocks
Fair Value Gaps
Market Structure Shifts
By combining these components, the ICT Killzones Toolkit provides traders with a comprehensive framework for analyzing the market and identifying setups of interest. Leveraging these tools effectively can enhance traders' decision-making process and improve killzones interpretability.
🔶 USAGE
In forex/futures trading, timing is crucial. ICT Killzone are specific periods when there's a higher chance of finding setups of interest. Mastering these time intervals can offer significant advantages to traders who know how to use them effectively.
The image above highlights a potential setup of interest when using the ICT Killzones Toolkit.
As another example for utilizing the ICT Killzones Toolkit, we can see in the image above when price retests setups generated from killzones such as Order Blocks or Fair Value Gaps, a potential strategy could be to look for entries on those & take profits as the next killzone appears.
🔹 Order Blocks
Order Blocks are sections on a price chart where notable buying or selling activity has occured, often signaling interest zones for institutional traders. This toolkit's Order Blocks component pinpoints these areas within the Killzone, which may act as potential support or resistance levels.
🔹 Breaker Blocks
Breaker Blocks are zones built from mitigated order blocks, and highlight zones on the chart where price has previously stalled or reversed. These areas may act as significant barriers to price movement in the future, and the Breaker Blocks component helps traders identify them for potential trading opportunities.
🔹 Fair Value Gaps
Fair value gaps are especially favored by price action traders and arise from market inefficiencies or imbalances, typically when buying and selling are unequal. These gaps often attract price movement before resuming in the same direction. the Fair Value Gaps component of the toolkit helps traders identify and analyze them.
🔹 Market Structure Shifts
Market Structure Shifts refer to significant changes in the overall structure of the market, such as shifts in trend direction, volatility, or trading activity. These shifts can provide valuable insights into market sentiment and potential trading opportunities, and the Market Structure Shifts component helps traders identify and interpret them.
Overall, the ICT Killzone Toolkit combines these components to provide traders with a comprehensive framework for analyzing the markets and identifying high-probability trading setups.
🔶 SETTINGS
🔹 ICT Killzones
Asian, London Open, New York, and London Close: toggles the visibility of specific Killzones, allowing users to customize time periods and Killzone colors.
Killzone Lines : Top/Bottom, Mean and Extend Top/Bottom: toggles the visibility of the Killzone's pivot high and low lines, mean (average) line, and allows users to extend the pivot lines.
Killzone Labels: Toggles the visibility of the Killzone labels.
Display Killzones within Timeframes Up To: Toggles the visibility of the Killzones up to selected Timeframes.
Open Price, Separator, Label, and Color: toggles the visibility of the open price of the Killzones or for the day, week, or month. If the day, week, or month is selected, a separator will be displayed to highlight the beginning of each respective period. Additionally, users can customize the color and toggle the label as needed.
🔹 Order Blocks & Breaker Blocks
Order Blocks | Breaker Blocks: toggles the visibility of the order blocks & breaker blocks.
Swing Detection Length: lookback period used for the detection of the swing points used to create order blocks & breaker blocks.
Mitigation Price: allows users to select between closing price or wick of the candle.
Use Candle Body in Detection: allows users to use candle bodies as order block areas instead of the full candle range.
Remove Mitigated Order Blocks & Breaker Blocks: toggles the visibility of the mitigated order blocks & breaker blocks.
Extend Order Blocks & Breaker Blocks: enables processing of the order blocks & breaker blocks beyond the boundaries of the killzones.
Display Order Blocks & Breaker Blocks: enables the display of the first, last, or all occurrences of the order blocks & breaker blocks.
Order Blocks : Bullish, Bearish Color: color customization option for order blocks.
Breaker Blocks : Bullish, Bearish Color: color customization option for breaker blocks.
Show Order Blocks & Breaker Blocks Text: toggles the visibility of the order blocks & breaker blocks labels.
🔹 Market Structure Shifts
Market Structure Shifts: toggles the visibility of the market structure shifts.
Detection Length: market structure shift detection length.
Display Market Structure Shifts: enables the display of the first, last, or all occurrences of the market structure shifts.
Market Structure Shifts : Bullish, Bearish Color: color custumization option for market structure shifts.
Show Market Structure Shifts Text: toggles the visibility of the market structure shifts labels.
🔹 Fair Value Gaps
Fair Value Gaps: toggles the visibility of the fair value gaps.
Fair Value Gap Width Filter: filtering threshold wile detecting fair value gaps.
Remove Mitigated Fair Value Gaps: removes mitigated fair value gaps.
Extend Fair Value Gaps: enables processing of the fair value gaps beyond the boundaries of the killzones.
Display Fair Value Gaps: enables the display of the first, last, or all occurrences of the fair value gaps.
Bullish Imbalance Color: color customization option.
Bearish Imbalance Color: color customization option.
Show Fair Value Gaps Text: toggles the visibility of the fair value gaps labels.
🔶 RELATED SCRIPTS
Smart-Money-Concepts
Order-Blocks-Breaker-Blocks
Thanks to our community for recommending this script. For more conceptual scripts and related content, we welcome you to explore by visiting >>> LuxAlgo-Scripts .

lib_fvgLibrary "lib_fvg"
further expansion of my object oriented library toolkit. This lib detects Fair Value Gaps and returns them as objects.
Drawing them is a separate step so the lib can be used with securities. It also allows for usage of current/close price to detect fill/invalidation of a gap and to adjust the fill level dynamically. FVGs can be detected while forming and extended indefinitely while they're unfilled.
method draw(this)
Namespace types: FVG
Parameters:
this (FVG)
method draw(fvgs)
Namespace types: FVG
Parameters:
fvgs (FVG )
is_fvg(mode, precondition, filter_insignificant, filter_insignificant_atr_factor, live)
Parameters:
mode (int) : switch for detection 1 for bullish FVGs, -1 for bearish FVGs
precondition (bool) : allows for other confluences to block/enable detection
filter_insignificant (bool) : allows to ignore small gaps
filter_insignificant_atr_factor (float) : allows to adjust how small (compared to a 50 period ATR)
live (bool) : allows to detect FVGs while the third bar is forming -> will cause repainting
Returns: a tuple of (bar_index of gap bar, gap top, gap bottom)
create_fvg(mode, idx, top, btm, filled_at_pc, config)
Parameters:
mode (int) : switch for detection 1 for bullish FVGs, -1 for bearish FVGs
idx (int) : the bar_index of the FVG gap bar
top (float) : the top level of the FVG
btm (float) : the bottom level of the FVG
filled_at_pc (float) : the ratio (0-1) that the fill source needs to retrace into the gap to consider it filled/invalidated/ready for removal
config (FVGConfig) : the plot configuration/styles for the FVG
Returns: a new FVG object if there was a new FVG, else na
detect_fvg(mode, filled_at_pc, precondition, filter_insignificant, filter_insignificant_atr_factor, live, config)
Parameters:
mode (int) : switch for detection 1 for bullish FVGs, -1 for bearish FVGs
filled_at_pc (float)
precondition (bool) : allows for other confluences to block/enable detection
filter_insignificant (bool) : allows to ignore small gaps
filter_insignificant_atr_factor (float) : allows to adjust how small (compared to a 50 period ATR)
live (bool) : allows to detect FVGs while the third bar is forming -> will cause repainting
config (FVGConfig)
Returns: a new FVG object if there was a new FVG, else na
method update(this, fill_src)
Namespace types: FVG
Parameters:
this (FVG)
fill_src (float) : allows for usage of different fill source series, e.g. high for bearish FVGs, low vor bullish FVGs or close for both
method update(all, fill_src)
Namespace types: FVG
Parameters:
all (FVG )
fill_src (float)
method remove_filled(unfilled_fvgs)
Namespace types: FVG
Parameters:
unfilled_fvgs (FVG )
method delete(this)
Namespace types: FVG
Parameters:
this (FVG)
method delete_filled_fvgs_buffered(filled_fvgs, max_keep)
Namespace types: FVG
Parameters:
filled_fvgs (FVG )
max_keep (int) : the number of filled, latest FVGs to retain on the chart.
FVGConfig
Fields:
box_args (|robbatt/lib_plot_objects/36;BoxArgs|#OBJ)
line_args (|robbatt/lib_plot_objects/36;LineArgs|#OBJ)
box_show (series__bool)
line_show (series__bool)
keep_filled (series__bool)
extend (series__bool)
FVG
Fields:
config (|FVGConfig|#OBJ)
startbar (series__integer)
mode (series__integer)
top (series__float)
btm (series__float)
center (series__float)
size (series__float)
fill_size (series__float)
fill_lvl_target (series__float)
fill_lvl_current (series__float)
fillbar (series__integer)
filled (series__bool)
_fvg_box (|robbatt/lib_plot_objects/36;Box|#OBJ)
_fill_line (|robbatt/lib_plot_objects/36;Line|#OBJ)

lib_retracement_patternsLibrary "lib_retracement_patterns"
types and functions for XABCD pattern detection and plotting
method set_tolerances(this, tolerance_Bmin, tolerance_Bmax, tolerance_Cmin, tolerance_Cmax, tolerance_Dmin, tolerance_Dmax)
sets tolerances for B, C and D retracements. This creates another Pattern instance that is set as tolerances field on the original and will be used for detection instead of the original ratios.
Namespace types: Pattern
create_config(pattern_line_args, pattern_point_args, name_label_args, retracement_line_args, retracement_label_args, line_args_Dtarget, line_args_completion, line_args_tp1, line_args_tp2, line_args_sl, label_args_completion, label_args_tp1, label_args_tp2, label_args_sl, label_terminal, label_terminal_up_char, label_terminal_down_char, color_bull, color_bear, color_muted, fill_opacity, draw_point_labels, draw_retracements, draw_target_range, draw_levels, hide_shorter_if_shared_legs_greater_than_max, hide_engulfed_pattern, hide_engulfed_pattern_of_same_type, hide_longer_pattern_with_same_X, mute_previous_pattern_when_next_overlaps, keep_failed_patterns)
method direction(this)
Namespace types: Match
method length(this)
return the length of this pattern, determined by the distance between X and D point
Namespace types: Match
method height(this)
return the height of this pattern, determined by the distance between the biggest distance between A/C and X/D
Namespace types: Match
method is_forming(this)
returns true if not complete, not expired and not invalidated
Namespace types: Match
method tostring(this)
return a string representation of all Matches in this map
Namespace types: Match
method tostring(this)
Namespace types: map
remove_complete_and_expired(this)
method add(this, item)
Namespace types: map
method is_engulfed_by(this, other)
checks if this Match is engulfed by the other
Namespace types: Match
method update(tracking_matches, zigzag, patterns, max_age_idx, detect_dir, pattern_minlen, pattern_maxlen, max_sub_waves, max_shared_legs, max_XB_BD_ratio, debug_log)
checks this map of tracking Matches if any of them was completed or invalidated in
Namespace types: map
method mute(this, mute_color, mute_fill_color)
mute this pattern by making it all one color (lines and labels, for pattern fill there's another)
Namespace types: Match
method mute(this, mute_color, mute_fill_color)
mute all patterns in this map by making it all one color (lines and labels, for pattern fill there's another)
Namespace types: map
method hide(this)
hide this pattern by muting it with a transparent color
Namespace types: Match
method reset_styles(this)
reset the style of a muted or hidden match back to the preset configuration
Namespace types: Match
method delete(this)
remove the plot of this Match from the chart
Namespace types: Match
method delete(this)
remove all the plots of the Matches in this map from the chart
Namespace types: map
method draw(this)
draw this Match on the chart
Namespace types: Match
method draw(this, config, all_patterns, debug_log)
draw all Matches in this map, considering all other patterns for engulfing and overlapping
Namespace types: map
method check_hide_or_mute(this, all, config, debug_log)
checks if this pattern needs to be hidden or muted based on other plotted patterns and given configuration
Namespace types: Match
method add_if(id, item, condition)
convenience function to add a search pattern to a list, only if given condition (input.bool) is true
Namespace types: Pattern
Pattern
type to hold retracement ratios and tolerances for this pattern, as well as targets for trades
Config
allows control of pattern plotting shape and colors, as well as settings for hiding overlapped patterns etc.
Match
holds all information on a Pattern and a successful match in the chart. Includes XABCD pivot points as well as all Line and Label objects to draw it

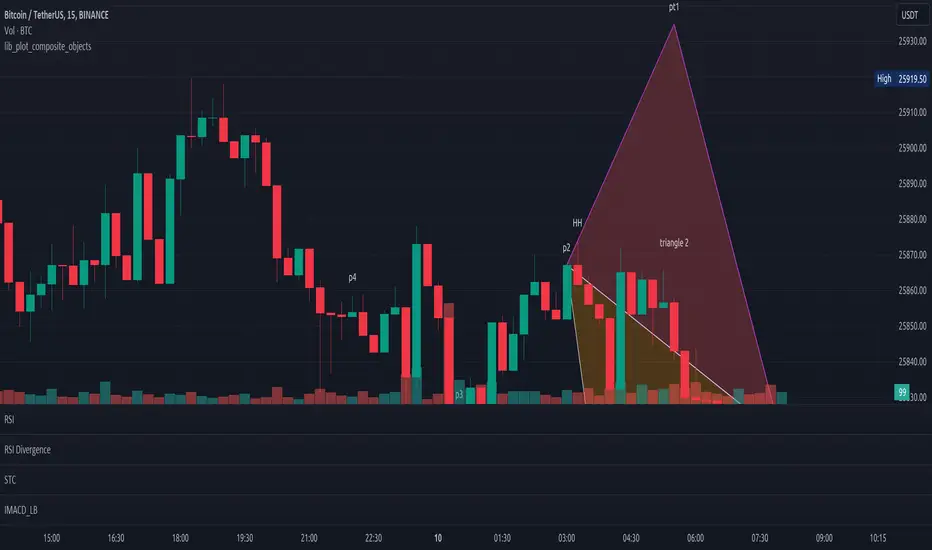
lib_plot_composite_objectsLibrary "lib_plot_composite_objects"
library building on top of lib_plot_objects for composite objects such as Triangles and Polygons. heavily using chart.points
method tostring(this, date_format)
Namespace types: Triangle
Parameters:
this (Triangle)
date_format (simple string)
method tostring(this, date_format)
Namespace types: TriangleFill
Parameters:
this (TriangleFill)
date_format (simple string)
method tostring(this, date_format)
Namespace types: Polygon
Parameters:
this (Polygon)
date_format (simple string)
method tostring(this, date_format)
Namespace types: PolygonFill
Parameters:
this (PolygonFill)
date_format (simple string)
method tostring(this, date_format)
Namespace types: Triangle
Parameters:
this (Triangle )
date_format (simple string)
method tostring(this, date_format)
Namespace types: Polygon
Parameters:
this (Polygon )
date_format (simple string)
method tostring(this, date_format)
Namespace types: TriangleFill
Parameters:
this (TriangleFill )
date_format (simple string)
method tostring(this, date_format)
Namespace types: PolygonFill
Parameters:
this (PolygonFill )
date_format (simple string)
method create_triangle(this, b, c, args)
Namespace types: chart.point
Parameters:
this (chart.point)
b (chart.point)
c (chart.point)
args (LineArgs type from robbatt/lib_plot_objects/32)
method create_triangle(this, c)
Namespace types: D.Line
Parameters:
this (Line type from robbatt/lib_plot_objects/32)
c (chart.point)
method create_polygon(points, args)
Namespace types: chart.point
Parameters:
points (chart.point )
args (LineArgs type from robbatt/lib_plot_objects/32)
method create_polygon(start, others, args)
Namespace types: chart.point
Parameters:
start (chart.point)
others (chart.point )
args (LineArgs type from robbatt/lib_plot_objects/32)
method create_fill(this, fill_color)
Namespace types: Triangle
Parameters:
this (Triangle)
fill_color (color)
method create_fill(this, fill_color)
Namespace types: Polygon
Parameters:
this (Polygon)
fill_color (color)
method create_center_label(this, txt, args, tooltip)
Namespace types: Triangle
Parameters:
this (Triangle)
txt (string)
args (LabelArgs type from robbatt/lib_plot_objects/32)
tooltip (string)
method create_label(this, txt, args, tooltip)
Namespace types: Polygon
Parameters:
this (Polygon)
txt (string)
args (LabelArgs type from robbatt/lib_plot_objects/32)
tooltip (string)
method nz(this, default)
Namespace types: Triangle
Parameters:
this (Triangle)
default (Triangle)
method nz(this, default)
Namespace types: TriangleFill
Parameters:
this (TriangleFill)
default (TriangleFill)
method nz(this, default)
Namespace types: Polygon
Parameters:
this (Polygon)
default (Polygon)
method nz(this, default)
Namespace types: PolygonFill
Parameters:
this (PolygonFill)
default (PolygonFill)
method enqueue(id, item, max)
Namespace types: Triangle
Parameters:
id (Triangle )
item (Triangle)
max (int)
method enqueue(id, item, max)
Namespace types: Polygon
Parameters:
id (Polygon )
item (Polygon)
max (int)
method enqueue(id, item, max)
Namespace types: TriangleFill
Parameters:
id (TriangleFill )
item (TriangleFill)
max (int)
method enqueue(id, item, max)
Namespace types: PolygonFill
Parameters:
id (PolygonFill )
item (PolygonFill)
max (int)
method update(this, a, b, c)
Namespace types: Triangle
Parameters:
this (Triangle)
a (chart.point)
b (chart.point)
c (chart.point)
method update(this, points)
Namespace types: Polygon
Parameters:
this (Polygon)
points (chart.point )
method delete(this)
Namespace types: Triangle
Parameters:
this (Triangle)
method delete(this)
Namespace types: TriangleFill
Parameters:
this (TriangleFill)
method delete(this)
Namespace types: Polygon
Parameters:
this (Polygon)
method delete(this)
Namespace types: PolygonFill
Parameters:
this (PolygonFill)
method delete(this)
Namespace types: Triangle
Parameters:
this (Triangle )
method delete(this)
Namespace types: TriangleFill
Parameters:
this (TriangleFill )
method delete(this)
Namespace types: Polygon
Parameters:
this (Polygon )
method delete(this)
Namespace types: PolygonFill
Parameters:
this (PolygonFill )
method draw(this, ab_args_override, ac_args_override, bc_args_override)
Namespace types: Triangle
Parameters:
this (Triangle)
ab_args_override (LineArgs type from robbatt/lib_plot_objects/32)
ac_args_override (LineArgs type from robbatt/lib_plot_objects/32)
bc_args_override (LineArgs type from robbatt/lib_plot_objects/32)
method draw(this)
Namespace types: Polygon
Parameters:
this (Polygon)
method draw(this)
Namespace types: TriangleFill
Parameters:
this (TriangleFill)
method draw(this)
Namespace types: PolygonFill
Parameters:
this (PolygonFill)
method draw(this)
Namespace types: Triangle
Parameters:
this (Triangle )
method draw(this)
Namespace types: TriangleFill
Parameters:
this (TriangleFill )
method draw(this)
Namespace types: Polygon
Parameters:
this (Polygon )
method draw(this)
Namespace types: PolygonFill
Parameters:
this (PolygonFill )
method apply_style(this, args)
Namespace types: Triangle
Parameters:
this (Triangle)
args (LineArgs type from robbatt/lib_plot_objects/32)
method apply_style(this, args)
Namespace types: Polygon
Parameters:
this (Polygon)
args (LineArgs type from robbatt/lib_plot_objects/32)
method apply_style(this, args)
Namespace types: Triangle
Parameters:
this (Triangle )
args (LineArgs type from robbatt/lib_plot_objects/32)
method apply_style(this, args)
Namespace types: Polygon
Parameters:
this (Polygon )
args (LineArgs type from robbatt/lib_plot_objects/32)
Triangle
Fields:
a (chart.point) : first Corner
b (chart.point) : second Corner
c (chart.point) : third Corner
args (LineArgs type from robbatt/lib_plot_objects/32) : Wrapper for reusable arguments for line.new()
ab (Line type from robbatt/lib_plot_objects/32)
ac (Line type from robbatt/lib_plot_objects/32)
bc (Line type from robbatt/lib_plot_objects/32)
TriangleFill
Fields:
triangle (Triangle) : The Triangle object
plot (LineFill type from robbatt/lib_plot_objects/32) : The linefill object to be added and plotted via draw()
Polygon
Fields:
points (chart.point ) : array of points that make up the Polygon
center (chart.point) : Center point of the Polygon, can be used for a label and will be center for PolygonFill
args (LineArgs type from robbatt/lib_plot_objects/32) : Wrapper for reusable arguments for line.new()
plot (Line type from robbatt/lib_plot_objects/32) : An array of Lines that form Polygon Border
PolygonFill
Fields:
poly (Polygon) : the Polygon
fill_color (series color) : The color used to fill the space between the lines.
plot (TriangleFill )
lib_profileLibrary "lib_profile"
a library with functions to calculate a volume profile for either a set of candles within the current chart, or a single candle from its lower timeframe security data. All you need is to feed the
method delete(this)
deletes this bucket's plot from the chart
Namespace types: Bucket
Parameters:
this (Bucket)
method delete(this)
Namespace types: Profile
Parameters:
this (Profile)
method delete(this)
Namespace types: Bucket
Parameters:
this (Bucket )
method delete(this)
Namespace types: Profile
Parameters:
this (Profile )
method update(this, top, bottom, value, fraction)
updates this bucket's data
Namespace types: Bucket
Parameters:
this (Bucket)
top (float)
bottom (float)
value (float)
fraction (float)
method update(this, tops, bottoms, values)
update this Profile's data (recalculates the whole profile and applies the result to this object) TODO optimisation to calculate this incremental to improve performance in realtime on high resolution
Namespace types: Profile
Parameters:
this (Profile)
tops (float ) : array of range top/high values (either from ltf or chart candles using history() function
bottoms (float ) : array of range bottom/low values (either from ltf or chart candles using history() function
values (float ) : array of range volume/1 values (either from ltf or chart candles using history() function (1s can be used for analysing candles in bucket/price range over time)
method tostring(this)
allows debug print of a bucket
Namespace types: Bucket
Parameters:
this (Bucket)
method draw(this, start_t, start_i, end_t, end_i, args, line_color)
allows drawing a line in a Profile, representing this bucket and it's value + it's value's fraction of the Profile total value
Namespace types: Bucket
Parameters:
this (Bucket)
start_t (int) : the time x coordinate of the line's left end (depends on the Profile box)
start_i (int) : the bar_index x coordinate of the line's left end (depends on the Profile box)
end_t (int) : the time x coordinate of the line's right end (depends on the Profile box)
end_i (int) : the bar_index x coordinate of the line's right end (depends on the Profile box)
args (LineArgs type from robbatt/lib_plot_objects/24) : the default arguments for the line style
line_color (color) : the color override for POC/VAH/VAL lines
method draw(this, forced_width)
draw all components of this Profile (Box, Background, Bucket lines, POC/VAH/VAL overlay levels and labels)
Namespace types: Profile
Parameters:
this (Profile)
forced_width (int) : allows to force width of the Profile Box, overrides the ProfileArgs.default_size and ProfileArgs.extend arguments (default: na)
method init(this)
Namespace types: ProfileArgs
Parameters:
this (ProfileArgs)
method init(this)
Namespace types: Profile
Parameters:
this (Profile)
profile(tops, bottoms, values, resolution, vah_pc, val_pc, bucket_buffer)
split a chart/parent bar into 'resolution' sections, figure out in which section the most volume/time was spent, by analysing a given set of (intra)bars' top/bottom/volume values. Then return price center of the bin with the highest volume, essentially marking the point of control / highest volume (poc) in the chart/parent bar.
Parameters:
tops (float ) : array of range top/high values (either from ltf or chart candles using history() function
bottoms (float ) : array of range bottom/low values (either from ltf or chart candles using history() function
values (float ) : array of range volume/1 values (either from ltf or chart candles using history() function (1s can be used for analysing candles in bucket/price range over time)
resolution (int) : amount of buckets/price ranges to sort the candle data into (analyse how much volume / time was spent in a certain bucket/price range) (default: 25)
vah_pc (float) : a threshold percentage (of values' total) for the top end of the value area (default: 80)
val_pc (float) : a threshold percentage (of values' total) for the bottom end of the value area (default: 20)
bucket_buffer (Bucket ) : optional buffer of empty Buckets to fill, if omitted a new one is created and returned. The buffer length must match the resolution
Returns: poc (price level), vah (price level), val (price level), poc_index (idx in buckets), vah_index (idx in buckets), val_index (idx in buckets), buckets (filled buffer or new)
create_profile(start_idx, tops, bottoms, values, resolution, vah_pc, val_pc, args)
split a chart/parent bar into 'resolution' sections, figure out in which section the most volume/time was spent, by analysing a given set of (intra)bars' top/bottom/volume values. Then return price center of the bin with the highest volume, essentially marking the point of control / highest volume (poc) in the chart/parent bar.
Parameters:
start_idx (int) : the bar_index at which the Profile should start drawing
tops (float ) : array of range top/high values (either from ltf or chart candles using history() function
bottoms (float ) : array of range bottom/low values (either from ltf or chart candles using history() function
values (float ) : array of range volume/1 values (either from ltf or chart candles using history() function (1s can be used for analysing candles in bucket/price range over time)
resolution (int) : amount of buckets/price ranges to sort the candle data into (analyse how much volume / time was spent in a certain bucket/price range) (default: 25)
vah_pc (float) : a threshold percentage (of values' total) for the top end of the value area (default: 80)
val_pc (float) : a threshold percentage (of values' total) for the bottom end of the value area (default: 20)
args (ProfileArgs)
Returns: poc (price level), vah (price level), val (price level), poc_index (idx in buckets), vah_index (idx in buckets), val_index (idx in buckets), buckets (filled buffer or new)
history(src, len, offset)
allows fetching an array of values from the history series with offset from current candle
Parameters:
src (int)
len (int)
offset (int)
history(src, len, offset)
allows fetching an array of values from the history series with offset from current candle
Parameters:
src (float)
len (int)
offset (int)
history(src, len, offset)
allows fetching an array of values from the history series with offset from current candle
Parameters:
src (bool)
len (int)
offset (int)
history(src, len, offset)
allows fetching an array of values from the history series with offset from current candle
Parameters:
src (string)
len (int)
offset (int)
Bucket
Fields:
idx (series int) : the index of this Bucket within the Profile starting with 0 for the lowest Bucket at the bottom of the Profile
value (series float) : the value of this Bucket, can be volume or time, for using time pass and array of 1s to the update function
top (series float) : the top of this Bucket's price range (for calculation)
btm (series float) : the bottom of this Bucket's price range (for calculation)
center (series float) : the center of this Bucket's price range (for plotting)
fraction (series float) : the fraction this Bucket's value is compared to the total of the Profile
plot_bucket_line (Line type from robbatt/lib_plot_objects/24) : the line that resembles this bucket and it's valeu in the Profile
ProfileArgs
Fields:
show_poc (series bool) : whether to plot a POC line across the Profile Box (default: true)
show_profile (series bool) : whether to plot a line for each Bucket in the Profile Box, indicating the value per Bucket (Price range), e.g. volume that occured in a certain time and price range (default: false)
show_va (series bool) : whether to plot a VAH/VAL line across the Profile Box (default: false)
show_va_fill (series bool) : whether to fill the 'value' area between VAH/VAL line (default: false)
show_background (series bool) : whether to fill the Profile Box with a background color (default: false)
show_labels (series bool) : whether to add labels to the right end of the POC/VAH/VAL line (default: false)
show_price_levels (series bool) : whether add price values to the labels to the right end of the POC/VAH/VAL line (default: false)
extend (series bool) : whether extend the Profile Box to the current candle (default: false)
default_size (series int) : the default min. width of the Profile Box (default: 30)
args_poc_line (LineArgs type from robbatt/lib_plot_objects/24) : arguments for the poc line plot
args_va_line (LineArgs type from robbatt/lib_plot_objects/24) : arguments for the va line plot
args_poc_label (LabelArgs type from robbatt/lib_plot_objects/24) : arguments for the poc label plot
args_va_label (LabelArgs type from robbatt/lib_plot_objects/24) : arguments for the va label plot
args_profile_line (LineArgs type from robbatt/lib_plot_objects/24) : arguments for the Bucket line plots
args_profile_bg (BoxArgs type from robbatt/lib_plot_objects/24)
va_fill_color (series color) : color for the va area fill plot
Profile
Fields:
start (series int) : left x coordinate for the Profile Box
end (series int) : right x coordinate for the Profile Box
resolution (series int) : the amount of buckets/price ranges the Profile will dissect the data into
vah_threshold_pc (series float) : the percentage of the total data value to mark the upper threshold for the main value area
val_threshold_pc (series float) : the percentage of the total data value to mark the lower threshold for the main value area
args (ProfileArgs) : the style arguments for the Profile Box
h (series float) : the highest price of the data
l (series float) : the lowest price of the data
total (series float) : the total data value (e.g. volume of all candles, or just one each to analyse candle distribution over time)
buckets (Bucket ) : the Bucket objects holding the data for each price range bucket
poc_bucket_index (series int) : the Bucket index in buckets, that holds the poc Bucket
vah_bucket_index (series int) : the Bucket index in buckets, that holds the vah Bucket
val_bucket_index (series int) : the Bucket index in buckets, that holds the val Bucket
poc (series float) : the according price level marking the Point Of Control
vah (series float) : the according price level marking the Value Area High
val (series float) : the according price level marking the Value Area Low
plot_poc (Line type from robbatt/lib_plot_objects/24)
plot_vah (Line type from robbatt/lib_plot_objects/24)
plot_val (Line type from robbatt/lib_plot_objects/24)
plot_poc_label (Label type from robbatt/lib_plot_objects/24)
plot_vah_label (Label type from robbatt/lib_plot_objects/24)
plot_val_label (Label type from robbatt/lib_plot_objects/24)
plot_va_fill (LineFill type from robbatt/lib_plot_objects/24)
plot_profile_bg (Box type from robbatt/lib_plot_objects/24)
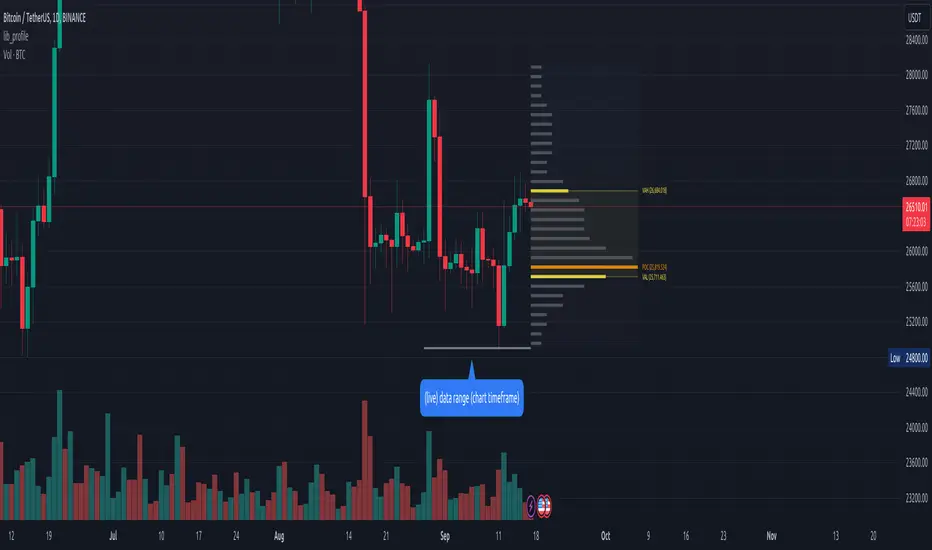
lib_retracement_labelLibrary "lib_retracement_label"
creates a retracement label between the origin and target of a retracement, updating it's position (via update + draw) when the target moves.
create_tooltip(name, min, max, tol_min, tol_max)
Parameters:
name (string)
min (float)
max (float)
tol_min (float)
tol_max (float)
method update(this)
Namespace types: RetracementLabel
Parameters:
this (RetracementLabel)
method create_retracement_label(this, move_endpoint, args, tooltip)
Creates a new RetracementLabel object.
Namespace types: D.Line
Parameters:
this (Line type from robbatt/lib_plot_objects/23)
move_endpoint (Point type from robbatt/lib_plot_objects/23)
args (LabelArgs type from robbatt/lib_plot_objects/23)
tooltip (string)
method create_retracement_label(this, move_end, args, tooltip)
Creates a new RetracementLabel object.
Namespace types: D.Line
Parameters:
this (Line type from robbatt/lib_plot_objects/23)
move_end (Pivot type from robbatt/lib_pivot/43)
args (LabelArgs type from robbatt/lib_plot_objects/23)
tooltip (string)
method enqueue(id, item, max)
Namespace types: RetracementLabel
Parameters:
id (RetracementLabel )
item (RetracementLabel)
max (int)
method draw(this)
Namespace types: RetracementLabel
Parameters:
this (RetracementLabel)
method draw(this)
Namespace types: RetracementLabel
Parameters:
this (RetracementLabel )
method delete(this)
Namespace types: RetracementLabel
Parameters:
this (RetracementLabel)
method delete(this)
Namespace types: RetracementLabel
Parameters:
this (RetracementLabel )
RetracementLabel
Fields:
move_endpoint (|robbatt/lib_plot_objects/23;Point|#OBJ)
center_label (|robbatt/lib_plot_objects/23;CenterLabel|#OBJ)
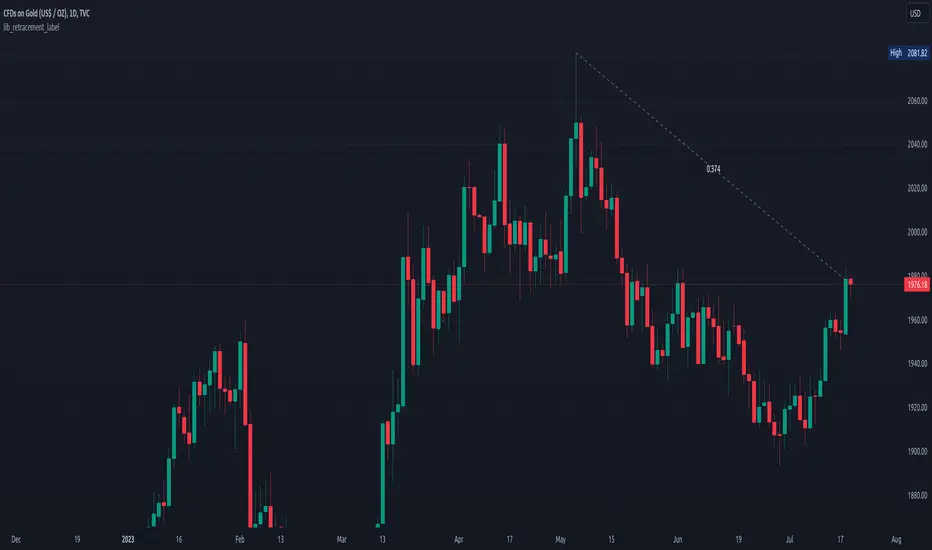
lib_zigLibrary "lib_zig"
Object oriented implementation of ZigZag
method tostring(this, date_format)
Namespace types: Zigzag
Parameters:
this (Zigzag)
date_format (simple string)
method update(this)
Namespace types: Zigzag
Parameters:
this (Zigzag)
method draw(this, colors)
Namespace types: Zigzag
Parameters:
this (Zigzag)
colors (PivotColors type from robbatt/lib_pivot/19)
Zigzag
Fields:
max_pivots (series__integer)
hldata (|robbatt/lib_pivot/19;HLData|#OBJ)
pivots (array__|robbatt/lib_pivot/19;Pivot|#OBJ)
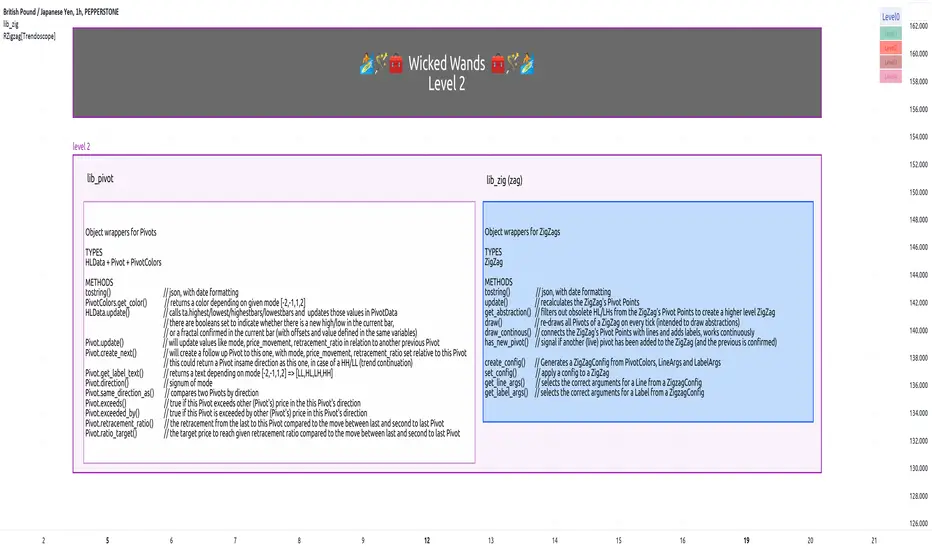
lib_pivotLibrary "lib_pivot"
Object oriented implementation of Pivot methods.
method tostring(this)
Converts HLData to a json string representation
Namespace types: HLData
Parameters:
this (HLData) : HLData
Returns: string representation of Pivot
method tostring(this, date_format)
Namespace types: Pivot
Parameters:
this (Pivot)
date_format (simple string)
method tostring(this, date_format)
Namespace types: Pivot
Parameters:
this (Pivot )
date_format (simple string)
method get_color(this, mode)
Namespace types: PivotColors
Parameters:
this (PivotColors)
mode (int)
method get_label_text(this)
Namespace types: Pivot
Parameters:
this (Pivot)
method direction(this)
Namespace types: Pivot
Parameters:
this (Pivot)
method same_direction_as(this, other)
Namespace types: Pivot
Parameters:
this (Pivot)
other (Pivot)
method exceeds(this, price)
Namespace types: Pivot
Parameters:
this (Pivot)
price (float)
method exceeds(this, other)
Namespace types: Pivot
Parameters:
this (Pivot)
other (Pivot)
method exceeded_by(this, price)
Namespace types: Pivot
Parameters:
this (Pivot)
price (float)
method exceeded_by(this, other)
Namespace types: Pivot
Parameters:
this (Pivot)
other (Pivot)
method retracement_ratio(this, lastPivot, sec_lastPivot)
Namespace types: Pivot
Parameters:
this (Pivot)
lastPivot (Pivot)
sec_lastPivot (Pivot)
ratio_target(sec_lastPivot, lastPivot, target_ratio)
Parameters:
sec_lastPivot (Pivot)
lastPivot (Pivot)
target_ratio (float)
method update(this, ref_highest, ref_lowest)
Namespace types: HLData
Parameters:
this (HLData)
ref_highest (float)
ref_lowest (float)
method update(this, bar_time, bar_idx, price, prev)
Namespace types: Pivot
Parameters:
this (Pivot)
bar_time (int)
bar_idx (int)
price (float)
prev (Pivot)
method create_next(this, bar_time, bar_idx, price)
Namespace types: Pivot
Parameters:
this (Pivot)
bar_time (int)
bar_idx (int)
price (float)
HLData
HLData wraps the data received from ta.highest, ta.highestbars, ta.lowest, ta.lowestbars, as well as the reference sources
Fields:
length (series int) : lookback length for pivot points
highest_offset (series int) : offset to highest value bar
lowest_offset (series int) : offset to lowest value bar
highest (series float) : highest value within lookback bars
lowest (series float) : lowest value within lookback bars
new_highest (series bool) : update() will set this true if the current candle forms a new highest high at the last (current) bar of set period (length)
new_lowest (series bool) : update() will set this true if the current candle forms a new lowest low at the last (current) bar of set period (length)
new_highest_fractal (series bool) : update() will set this true if the current candle forms a new fractal high at the center of set period (length)
new_lowest_fractal (series bool) : update() will set this true if the current candle forms a new fractal low at the center of set period (length)
PivotColors
Pivot colors for different modes
Fields:
hh (series color) : Color for Pivot mode 2 (HH)
lh (series color) : Color for Pivot mode 1 (LH)
hl (series color) : Color for Pivot mode -1 (HL)
ll (series color) : Color for Pivot mode -2 (LL)
Pivot
Pivot additional pivot data around basic Point
Fields:
point (Point type from robbatt/lib_plot_objects/5)
mode (series int) : can be -2/-1/1/2 for LL/HL/LH/HH
price_movement (series float) : The price difference between this and the previous pivot point in the opposite direction
retracement_ratio (series float) : The ratio between this price_movement and the previous
prev (Pivot)

lib_drawing_composite_typesLibrary "lib_drawing_composite_types"
User Defined Types for basic drawing structure. Other types and methods will be built on these. (added type Triangle and Polygon to )
TriangleProperties
TriangleProperties object
Fields:
border_color (series color) : Box border color. Default is color.blue
fill_color (series color) : Fill color
fill_transparency (series int)
border_width (series int) : Box border width. Default is 1
border_style (series string) : Box border style. Default is line.style_solid
xloc (series string) : defines if drawing needs to be done based on bar index or time. default is xloc.bar_index
Triangle
Triangle object
Fields:
p1 (Point type from HeWhoMustNotBeNamed/DrawingTypes/2) : point one
p2 (Point type from HeWhoMustNotBeNamed/DrawingTypes/2) : point two
p3 (Point type from HeWhoMustNotBeNamed/DrawingTypes/2) : point three
properties (TriangleProperties) : Triangle properties
l12 (series line) : line object created
l23 (series line) : line object created
l31 (series line) : line object created
Trianglefill
Trianglefill object
Fields:
triangle (Triangle) : to create a linefill for
fill_color (series color) : Fill color
transparency (series int) : Fill transparency range from 0 to 100
object (series linefill) : linefill object created
Polygon
Polygon object
Fields:
center (Point type from HeWhoMustNotBeNamed/DrawingTypes/2) : Point that triangles are using as common center
triangles (Triangle ) : an array of triangles that form the Polygon
Polygonfill
Polygonfill object
Fields:
_polygon (Polygon) : to create a fill for
_fills (Trianglefill ) : an array of Trianglefill objects that match the array of triangles in _polygon
lib_priceactionLibrary "lib_priceaction"
a library for everything related to price action, starting off with displacements
displacement(len, min_strength, o, c)
calculate if there is a displacement and how strong it is
Parameters:
len (int) : The amount of candles to consider for the deviation
min_strength (float) : The minimum displacement strength to trigger a signal
o (float) : The source series on which calculations are based
c (float) : The source series on which calculations are based
Returns: a tuple of (bool signal, float displacement_strength)

lib_statemachineLibrary "lib_statemachine"
simple state machine that allows tracking a state an manipulating it with conditions
method step(this, before, after, condition)
will step the state of the state machine from one to the next in case of condition
Namespace types: StateMachine
Parameters:
this (StateMachine) : (StateMachine) the state machine to use
before (int) : (int) from state
after (int) : (int) to state
condition (bool) : (bool) if condition is true
Returns: true (bool) if the state of the statemachine changed
method step(this, after, condition)
will change the state of the state machine to the next in case of condition (not depending on previous state)
Namespace types: StateMachine
Parameters:
this (StateMachine) : (StateMachine) the state machine to use
after (int) : (int) to state
condition (bool) : (bool) if condition is true
Returns: true (bool) if the state of the statemachine changed
method changed(this, within_bars)
will return true if the state of the state machine was changed in this iteration
Namespace types: StateMachine
Parameters:
this (StateMachine) : (StateMachine) the state machine to use
within_bars (int)
Returns: true (bool) if the state of the statemachine changed
method reset(this, condition, min_occurrences)
will reset the state machine if a certain 'condition' appears 'min_occurrences' times
Namespace types: StateMachine
Parameters:
this (StateMachine) : (StateMachine) the state machine to use
condition (bool) : (bool) reset condition
min_occurrences (int) : (int) min times 'condition' must appear for the reset to happen
Returns: true (bool) if the state of the statemachine changed
StateMachine
Fields:
state (series__integer)
neutral (series__integer)
enabled (series__bool)
reset_counter (series__integer)

lib_colorLibrary "lib_color"
offset_mono(original, offset, transparency)
get offset color
Parameters:
original (simple color) : original color
offset (float) : offset for new color
transparency (float) : transparency for new color
Returns: offset color

lib_colorsLibrary "lib_colors"
offset_mono(original, offset, transparency)
get offset color
Parameters:
original (simple color) : original color
offset (float) : offset for new color
transparency (float) : transparency for new color
Returns: offset color
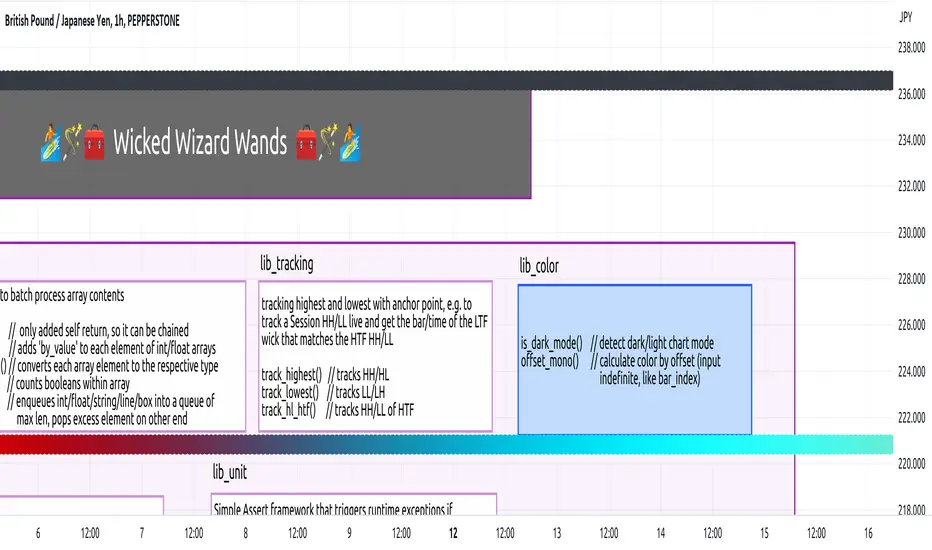
lib_arrayLibrary "lib_array"
several array functions for chained calls, batch conversion, incrementing and comparing arrays.
method sort(id, descending)
Namespace types: int
Parameters:
id (int ) : The array to sort (and return again)
descending (bool) : The sort order: order.ascending (default:false, meaning omit this param and just call myArray.sort()) or order.descending => set descending=true
@return The array that was passed as parameter id
method sort(id, descending)
Namespace types: float
Parameters:
id (float ) : The array to sort (and return again)
descending (bool) : The sort order: order.ascending (default:false, meaning omit this param and just call myArray.sort()) or order.descending => set descending=true
@return The array that was passed as parameter id
method sort(id, descending)
Namespace types: string
Parameters:
id (string ) : The array to sort (and return again)
descending (bool) : The sort order: order.ascending (default:false, meaning omit this param and just call myArray.sort()) or order.descending => set descending=true
@return The array that was passed as parameter id
method increment(id, by_value)
Namespace types: int
Parameters:
id (int ) : The array to increment (and return again)
by_value (int) : The value by which to increment (default: 1)
@return The array that was passed as parameter id
method increment(id, by_value)
Namespace types: float
Parameters:
id (float ) : The array to increment (and return again)
by_value (float) : The value by which to increment (default: 1.0)
@return The array that was passed as parameter id
method decrement(id, by_value)
Namespace types: int
Parameters:
id (int ) : The array to increment (and return again)
by_value (int) : The value by which to increment (default: 1)
@return The array that was passed as parameter id
method decrement(id, by_value)
Namespace types: float
Parameters:
id (float ) : The array to increment (and return again)
by_value (float) : The value by which to increment (default: 1.0)
@return The array that was passed as parameter id
method toint(id)
Namespace types: string
Parameters:
id (string ) : The array to convert
method toint(id)
Namespace types: float
Parameters:
id (float ) : The array to convert
method tofloat(id)
Namespace types: string
Parameters:
id (string ) : The array to convert
method tofloat(id)
Namespace types: int
Parameters:
id (int ) : The array to convert
method tostring(id)
Namespace types: int
Parameters:
id (int ) : The array to convert
method tostring(id)
Namespace types: float
Parameters:
id (float ) : The array to convert
method tobool(id)
Namespace types: float
Parameters:
id (float ) : The array to convert
method tobool(id)
Namespace types: int
Parameters:
id (int ) : The array to convert
method tobool(id)
Namespace types: string
Parameters:
id (string ) : The array to convert
method sum(id)
Namespace types: bool
Parameters:
id (bool ) : The array to convert
method enqueue(id, item, max, condition, lifo)
Namespace types: int
Parameters:
id (int ) : The array that is used as queue
item (int) : The item to enqueue (at pos 0, unless lifo = true)
max (int) : The max size of the queue
condition (bool) : An optional flag that allows disabling the adding, which in turn will prevent for in loops from ever running and save performance where not needed
lifo (bool) : An optional flag that allows to change the behavior from First In Last Out (default and consistent with pine scripts history operator with most recent elements at index 0) to a more common and resource efficient approach in programming languages: Last In First Out
Returns: The queue passed as param id
method enqueue(id, item, max, condition, lifo)
Namespace types: float
Parameters:
id (float ) : The array that is used as queue
item (float) : The item to enqueue (at pos 0, unless lifo = true)
max (int) : The max size of the queue
condition (bool) : An optional flag that allows disabling the adding, which in turn will prevent for in loops from ever running and save performance where not needed
lifo (bool) : An optional flag that allows to change the behavior from First In Last Out (default and consistent with pine scripts history operator with most recent elements at index 0) to a more common and resource efficient approach in programming languages: Last In First Out
Returns: The queue passed as param id
method enqueue(id, item, max, condition, lifo)
Namespace types: string
Parameters:
id (string ) : The array that is used as queue
item (string) : The item to enqueue (at pos 0, unless lifo = true)
max (int) : The max size of the queue
condition (bool) : An optional flag that allows disabling the adding, which in turn will prevent for in loops from ever running and save performance where not needed
lifo (bool) : An optional flag that allows to change the behavior from First In Last Out (default and consistent with pine scripts history operator with most recent elements at index 0) to a more common and resource efficient approach in programming languages: Last In First Out
Returns: The queue passed as param id
method enqueue(id, item, max, condition, lifo)
Namespace types: line
Parameters:
id (line ) : The array that is used as queue
item (line) : The item to enqueue (at pos 0, unless lifo = true)
max (int) : The max size of the queue
condition (bool) : An optional flag that allows disabling the adding, which in turn will prevent for in loops from ever running and save performance where not needed
lifo (bool) : An optional flag that allows to change the behavior from First In Last Out (default and consistent with pine scripts history operator with most recent elements at index 0) to a more common and resource efficient approach in programming languages: Last In First Out
Returns: The queue passed as param id
method enqueue(id, item, max, condition, lifo)
Namespace types: box
Parameters:
id (box ) : The array that is used as queue
item (box) : The item to enqueue (at pos 0, unless lifo = true)
max (int) : The max size of the queue
condition (bool) : An optional flag that allows disabling the adding, which in turn will prevent for in loops from ever running and save performance where not needed
lifo (bool) : An optional flag that allows to change the behavior from First In Last Out (default and consistent with pine scripts history operator with most recent elements at index 0) to a more common and resource efficient approach in programming languages: Last In First Out
Returns: The queue passed as param id

Reversal Signals [LuxAlgo]The Reversal Signals indicator is a technical analysis tool that aims to identify when a trend is fading and potentially starting to reverse.
As a counter-trend tool, the Reversal Signals indicator aims to solve the problem of several technical analysis indicators that perform well during trending markets but struggle in ranging markets. By understanding the key concepts and applications of the tool, traders can enhance their market timing and improve their trading strategies.
Note: It's important to explore the settings of the indicator to customize to your own usage & display as there are various options available as covered below.
🔶 USAGE
The Reversal Signals indicator is comprised of two main phases: Momentum Phase and Trend Exhaustion Phase . These phases help identify potential trend reversals in bullish, bearish, and ranging markets.
🔹The Momentum Phase
The momentum phase consists of a 9-candle count and in rare cases 8-candle count. In a bullish trend, a starting number ‘1’ is plotted if a candle closes higher than the close of a candle four periods ago. In a bearish trend, a starting number ‘1’ is plotted if a candle closes lower than the close of a candle four periods ago.
The following numbers are plotted when each successive candle satisfies the four-period rule. The potential reversal point comes when the Reversal Signals plot a label on top of a candle in a bullish trend or at the bottom of a candle in a bearish trend. The momentum phase is immediately canceled if, at any point, a candle fails to satisfy the four-period rule.
Based on the extremes of the momentum phase, the Reversal Signals generate support & resistance levels as well as risk/stop levels.
🔹 The Trend Exhaustion Phase
The trend exhaustion phase starts after completing the momentum phase and consists of a 13-candle count. In a bullish trend exhaustion phase, each candle’s close is compared to the close of two candles earlier, and the close must be greater than the close two periods earlier. In a bearish trend exhaustion phase, each candle’s close is compared to the close of two candles earlier, and the close must be lower than the close two periods earlier.
The trend exhaustion phase does not require a consecutive sequence of candles; if the order of candles is interrupted, the trend exhaustion phase is not canceled. The trend exhaustion phase generates stronger trading signals than the momentum phase, with the potential for longer-lasting price reversals.
🔹 Trading Signals
The Reversal Signals script presents an overall setup and some phase-specific trade setup options, where probable trades might be considered. All phase-specific trade setups, presented as options, are triggered once the selected phase is completed and followed by a price flip in the direction of the trade setup.
Please note that those setups are presented for educational purposes only and do not constitutes professional and/or financial advice
- Momentum: Enter a trade at momentum phase completion, and search for buy (sell) when the bullish (bearish) momentum phase pattern is complete. Ideally, the momentum phase completion should close near its support/resistance line but shall not be above them, which indicates continuation of the trend
- Exhaustion: Enter a trade on trend exhaustion phase completion, and search for buy (sell) when the bullish (bearish) trend exhaustion phase is complete
- Qualified: Buy (sell) when a bullish (bearish) trend exhaustion phase combined with another bullish (bearish) momentum phase sequence is complete
Long trade setups are presented with "L" label and short trade setups with "S" label, where the content of the label displays details related to the probable trade opportunity
Once a phase-specific trade setup is triggered then the Reversal Signals script keeps checking the status of the price action relative to the phase-specific trade setups and in case something goes wrong presents a caution label. Pay attention to the content of the caution labels as well as where they appear. A trade signal, followed immediately by a warning indication can be assumed as a continuation of the underlying trend and can be traded in the opposite direction of the suggested signal
It is strongly advised to confirm trading setups in conjunction with other forms of technical and fundamental analysis, including technical indicators, chart/candlestick pattern analysis, etc.
🔶 DETAILS
The Reversal Signals script performs the detection of the phases by counting the candlestick meeting the specific conditions, which includes:
- Detection of the 8th and 9th candle perfection during the momentum phase
- In some cases, the 8th count will be assumed as momentum phase completion
- Trend exhaustion phase counting stops in case any type of momentum phase completion is detected during the counting process
- Postponing the last count of the trend exhaustion phase, the 13th candle must be below/above the 8th candle and if not the candles will be indicated with '+' sign under them and the script continues to search for a 13th candle at the next ones until the conditions are met
🔶 ALERTS
When an alert is configured, the user will have the ability to be notified in case;
Momentum / Trend Exhaustion phase completion
Support & Resistance level cross detection
Stop / Risk level cross detection
Long / Short Trade Setups are triggered
Please note, alerts are available with 'any alert() function call' and the alerts will be received only for the features that are enabled during alert configuration
🔶 SETTINGS
🔹 Momentum Phase
Display Phases: displays the momentum phases, where the Completed option allows the display of only completed momentum phases. The detailed option allows the display of the entire process of the momentum phase processes
Support & Resistance Levels: Toggles the visibility of the Support & Resistance Levels and Line Styling options
Momentum Phase Risk Levels: Toggles the visibility of the momentum phase Stop/Risk Levels and Line Styling options
For color options please refer to the options available under the style tab
🔹 Trend Exhaustion Phase
Display Phases: displays the trend exhaustion phases, where the Completed option allows the display of only completed trend exhaustion phases. The detailed option allows the display of the entire process of the trend exhaustion phase processes
Trend Exhaustion Phase Risk Levels: Toggles the visibility of the trend exhaustion phase Stop/Risk Levels
Trend Exhaustion Phase Target Levels: Toggles the visibility of the trend exhaustion phase Target Levels
For color options please refer to the options available under the style tab
🔹 Trade Setups
Overall Trend Direction & Trade Setup: displays the overall trend and probable trade setup levels, the users should search for a price flip and confirm with other means of technical and fundamental analysis for the trade setups once the label is plotted
Phase-Specific Trade Setup Options
Momentum: Searches for a trade setup after momentum phase completion
Exhaustion: Searches for a trade setup after trend exhaustion phase completion, stronger trend reversal possibility compared to momentum phase setup
Qualified: Searches for a trade setup after the trend exhaustion phase followed by a momentum phase completion
None: No trade setups are presented
Price Flips against the Phase Specific Trade Setups: enables checking the price action relative to the phase-specific trade setups
🔶 RELATED SCRIPTS
Here are the scripts that may add additional insight during potential trading decisions.
Buyside-Sellside-Liquidity
Support-Resistance-Classification
