Turtle God Indicator (Đức Anh Trader)Description:
The Turtle God Indicator is a minimalist tool that provides quick visual feedback on the latest candle's momentum while remaining compliant with TradingView's visual guidelines.
🔹 The turtle appears only on the latest candle, keeping the chart clean and uncluttered.
🔹 Includes a 14-period Simple Moving Average (SMA) to help track trend direction.
🔹 Ideal for traders who want fun, subtle alerts without distracting overlays or indicators.
Inspired by Đức Anh Trader, this playful yet practical indicator is perfect for identifying momentum with a smile. 🐢
Trader

TQ's Support & Resistance(My goal creating this indicator): Provide a way to categorize and label key structures on multiple different levels so I can create a plan based on those observable facts.
The Underlying Concept / What is Momentum?
Momentum indicates transaction pressure. If the algorithm detects price is going up, that would be considered positive momentum. If the algorithm detects price is going down negative momentum would be detected.
The Momentum shown is derived from a price action pattern. Unlike my previous Support & Resistance indicator that used Super Trend, this indicator uses a unique pattern I created. On the first bar bearish momentum is detected a resistance Level is made at the highest point of the previous bullish condition. On the first bar bullish momentum is detected a support Level is made at the lowest point of the previous bearish condition. This happens on 5 different Momentum Levels, (short-term to long-term). I currently use this pattern to trade so the source code is protected.
What is Severity?
Severity is How we differentiate the importance of different Highs and Lows. If Momentum is detected on a higher level the Supply or Demand Level is updated. The Color and Size representing that Level will be shown. Demand and Supply Levels made by higher levels are more SEVERE than a demand level made by a lower level.
Technical Inputs
- to ensure the correct calculation of Support and Resistance levels change BAR_INDEX. BAR_INDEX creates a buffer at the start of the chart. For example: If you set BAR_INDEX to 300. The script will wait for 300 bars to elapse on the current chart before running. This allows the script more time to gather data. Which is needed in order for our dynamic lookback length to never return an error (Dynamic lookback length can't be negative or zero). The lower the timeframe the greater the number of bars need. For Example, if I open up a 1min chart I would enter 5000 as my BAR_INDEX since that will provide enough data to ensure the correct calculation of Support and Resistance levels. If I was on a daily chart, I would enter a lower number such as 800. Don't be afraid to play around with this.
- Toggle options (Close) or (High & Low) creates Support and Resistance Levels using the Lowest close and Highest close or using the Lowest low and Highest high.
Level Inputs
- The indicator has 5 Different Levels indicating SEVEREITY of a Supply and Demand Levels. The higher the Level the more SEVERE the Level.
Display Inputs
- You have the option to customize the Length, Width, Line Style, and Colors of all 5 different
- This indicator includes a Trend Chart. To Easily verify the current trend of any displayed by this indicator toggle on Chart On/Off. You also get the option to change the Chart Position and the size of the Trend Chart
How Trend Is being Determined?
(Close > Current Supply Level) if this statement is true technically price made a HH, so the trend is bullish.
(Close < Current Demand Level) if this statement is true technically price made a LL, so the trend is bearish.
- Fully customize how you display Market Structure on different levels. Line Length, Line Width, Line Style, and Line color can all be customized.
How it can be used?
(Examples of Different ways you can use this indicator): Easily categorize the severity of each and every Supply or Demand Level in the market (The higher Level the stronger the level)
: Quickly Determine the trend of any Level.
: Get a consistent view of a market and how different Levels are behaving but just use one chart.
: Take the discretion from hand drawing support and resistance lines out of your trading.
: Find and categorize strong levels for potential breakouts.
: Trend Analysis, use Levels to create a narrative based on observable facts from these Levels.
: Different Targets to take money off the table.
: Use Severity to differentiate between different trend line setups.
: Find Great places to move your stop loss too.

BeSight Mega SpotBeSight Mega Spot – Zone Based Price Grid Indicator
สคริปต์นี้ถูกออกแบบมาเพื่อช่วยเทรดเดอร์มองเห็นโซนราคาสำคัญที่ราคาอาจเกิดปฏิกิริยา โดยอ้างอิงจากระดับราคาที่ลงท้ายด้วย 0 และ 5 (เช่น 1350, 1355, 1360 เป็นต้น) ซึ่งมักเป็นระดับที่มีการตั้งคำสั่งซื้อขายจำนวนมากในตลาด
BeSight Mega Spot – Zone-Based Price Grid Indicator
This indicator is designed to help traders visualize key price zones where the market often reacts, based on price levels ending with 0 or 5 (e.g., 1350, 1355, 1360). These levels are commonly used for pending orders, liquidity, or price clustering zones.
It displays horizontal grid lines at fixed step intervals (default: every 5 points), covering the entire visible price range of the chart. Each price level is labeled for better clarity and planning.
🟦 Blue lines: Price levels ending in 0
⬜ Gray lines: Price levels ending in 5
This tool is useful for identifying potential institutional behavior zones, price consolidation, accumulation/distribution areas, or psychological support/resistance levels.
🧠 Notes:
- This indicator is not a buy/sell signal tool or predictive system.
- It works best when used in conjunction with other technical tools such as Supply/Demand zones or Smart Money Concepts (SMC) analysis.
- Compatible with all instruments: stocks, futures, forex, crypto, etc.
✅ How to use:
1. Add the indicator to your chart
2. Observe how price interacts with the 0/5 grid zones
3. Use the lines to assist with breakout, retest, or reversal planning
4. Combine with price action or other indicators for higher precision
✨ Developed by BeSight – A Community Of Traders
---------------------------------------------------------------------------------------
อินดิเคเตอร์นี้จะแสดงเส้นแนวนอนแบบตาราง (Grid) ที่แบ่งช่วงราคาออกเป็นระยะ ๆ ตามค่าที่ผู้ใช้กำหนด เช่น ทุก ๆ 5 จุด และครอบคลุมช่วงราคาทั้งหมดของกราฟ โดยแสดงเป็นเส้นแบบ dotted พร้อมป้ายราคาเพื่อให้มองเห็นได้ชัดเจน
🟦 เส้นสีน้ำเงิน: แสดงระดับราคาที่ลงท้ายด้วย 0
⬜ เส้นสีเทา: แสดงระดับราคาที่ลงท้ายด้วย 5
เหมาะสำหรับผู้ที่ต้องการดูโซนราคา "หยุดพัก / เก็บของ / เปิดโพซิชัน" ซึ่งอาจสะท้อนพฤติกรรมของผู้เล่นรายใหญ่หรือสถาบันในตลาด
🧠 ข้อควรรู้:
- อินดิเคเตอร์นี้ไม่ได้บอกจุดเข้าเทรดหรือการคาดการณ์ แต่ช่วยในการวางแผนแนวรับ-แนวต้านร่วมกับเครื่องมือวิเคราะห์อื่น ๆ
- รองรับทุกสินทรัพย์ที่มีหน่วยราคาคงที่ (หุ้น, ฟิวเจอร์ส, ฟอเร็กซ์, คริปโต ฯลฯ)
✅ วิธีใช้งาน:
1. เพิ่มอินดิเคเตอร์นี้ลงบนกราฟ
2. ใช้เส้น Grid เป็นแนวประกอบในการดูพฤติกรรมราคา เช่น การหยุดลง, การเบรกแนว, การกลับตัว
3. ผสมผสานกับโซน Demand/Supply หรือโซน SMC เพื่อความแม่นยำ
✨ พัฒนาโดย BeSight – คอมมูนิตี้ของเทรดเดอร์ตัวจริง

Horizontal Lines 0.5, BY ROSHAN SINGHThis indicator identify support and resistance to trade in 1min time frame, based of fib 0.5 level, on 15 min time frame find major high and low means major swing, low will be our start level and high will be our end level input in setting, substract high and end level and now divide answer with 2 till the daily volatility of a index or stock, if saying about nifty suppose nifty daily travel minimum for 65 pts then interval will be 65 input in settings, now all horizontals lines means support and level will be plotted on chart, buy on support, sell on resistance

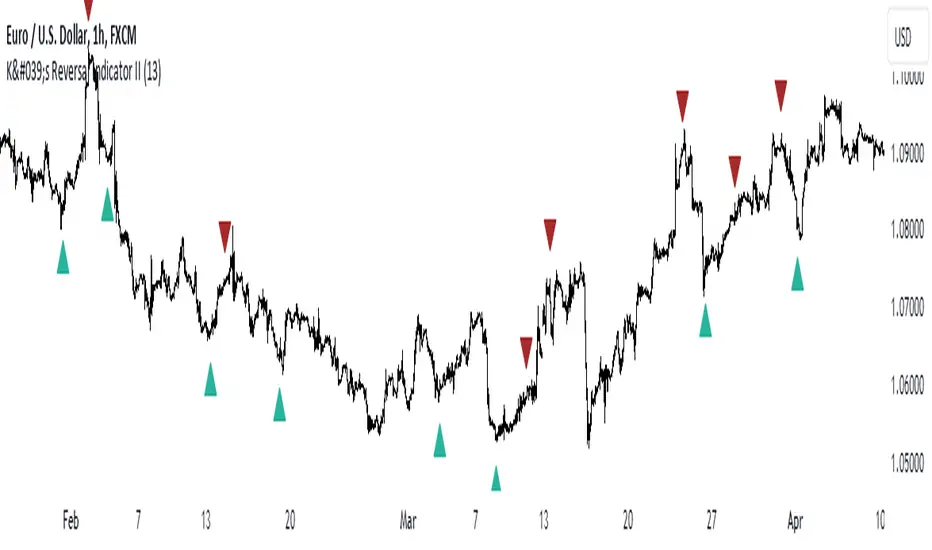
K's Reversal Indicator IIK’s Reversal Indicator II uses a moving average timing technique to deliver its signals. The method of calculation is as follows:
* Calculate a moving average (by default, a 13-period moving average).
* Calculate the number of times where the market is above its moving average. Whenever that number hits 21, a bearish signal is generated, and whenever that number if zero, a bullish signal is generated.
The indicator signals short-term to mid-term reversals as a mean-reversion move.
Hobbiecode - Five Day Low RSI StrategyThis is a simple strategy that is working well on SPY but also well performing on Mini Futures SP500. The strategy is composed by the followin rules:
1. If today’s close is below yesterday’s five-day low, go long at the close.
2. Sell at the close when the two-day RSI closes above 50.
3. There is a time stop of five days if the sell criterium is not triggered.
If you backtest it on Mini Futures SP500 you will be able to track data from 1993. It is important to select D1 as timeframe.
Please share any comment or idea below.
Have a good trading,
Ramón.

Hobbiecode - SP500 IBS + HigherThis is a simple strategy that is working well on SPY but also well performing on Mini Futures SP500. The strategy is composed by the followin rules:
1. Today is Monday.
2. The close must be lower than the close on Friday.
3. The IBS must be below 0.5.
4. If 1-3 are true, then enter at the close.
5. Sell 5 trading days later (at the close).
If you backtest it on Mini Futures SP500 you will be able to track data from 1993. It is important to select D1 as timeframe.
Please share any comment or idea below.
Have a good trading,
Ramón.

CPR with inside candle, Pivot Points and 4EMA The CPR trading strategy is a technical analysis approach that combines multiple indicators to determine potential price levels and trading opportunities. The strategy uses three main components: Inside Candles, Pivot Points, and the 4EMA.
Inside Candles: The Inside Candle pattern is a candlestick pattern where the current candle has a lower high and a higher low than the previous candle. This pattern can indicate a period of consolidation or indecision in the market and can signal a potential reversal or continuation of the trend.
Pivot Points: Pivot Points are technical indicators that use the previous day's price data to calculate key levels of support and resistance for the current trading day. These levels can act as potential areas of buying or selling pressure and can help traders identify potential entry and exit points.
4EMA: The 4EMA is a short-term Exponential Moving Average that tracks the average price of an asset over the previous four periods. This indicator is used to help identify short-term trends in the market and can signal potential buying or selling opportunities.
To apply the CPR strategy, traders first look for Inside Candles on their chart, indicating a period of consolidation or indecision in the market. Next, they identify the Pivot Points for the current trading day, which can act as potential areas of support or resistance. Finally, traders use the 4EMA to confirm the direction of the trend and potential entry or exit points.
For example, if an Inside Candle forms at a Pivot Point level and the 4EMA is indicating an uptrend, this could be a potential buying opportunity. Conversely, if an Inside Candle forms at a Pivot Point level and the 4EMA is indicating a downtrend, this could be a potential selling opportunity.

Setup Max e Min Larry WilliansLarry Williams used this system to win the trading championship
Hello friends, I bring a script with a trading strategy to be used in futures such as Index, Forex and Commodities. Developed by famous trader Larry Williams.
In them we use two 3-period Simple Moving Averages (Arithmetic) (one with the high price, the other with the low price), and a 21-period Moving Average (Arithmetic) to determine the trend. This will form an average channel with the prices of the maximums and minimums of the last three candles.
Best time charts use the strategy: from 5 minutes to 60 minutes.
This strategy is quite simple. The 21 Moving Average will color according to the trend (Green for bullish, Red for bearish and Gray for transitions). The Script will signal the entry according to the trend by the colors of the candles and also by the signal:
When green, the buy will be on the crossing of the lower Moving Average crossing the candlestick, and the exit will be on the crossing of the candlestick on the next Upper Moving Average.
When red, the sell will be at the crossing of the Upper Moving Average crossing the candlestick, and the exit will be at the crossing of the candlestick on the next Lower Moving Average.
When the Script signals the candle with a purple X, it means that the trend is changing and the entire open operation must be closed.
This system has no Stop, so be careful when using it.
Na linguagem do autor:
Larry Williams usou esse sistema ganhar campeonato de trade
Olá amigos, trago um script com uma estratégia de trade pra ser usada em futuros como Índice, Forex e Commodities. Desenvolvido pelo famoso trader Larry Willians.
Neles usamos duas Médias Móveis Simples (Aritmética) de 3 períodos (uma com o preço da máxima, outra com o preço da mínima), e uma Média Móvel (Aritmética) de 21 períodos para determinar a tendência. Nisso vai formar uma canal de médias com os preços das máximas e mínimas dos últimos três candles.
Melhores tempos gráficos usar a estratégia: de 5 minutos até 60 minutos.
Essa estratégia é bem simples. A Média Móvel de 21 irá colorir de acordo com a tendência (Green pra alta, Red para baixa e Gray para transições). O Script irá sinalizar a entrada de acordo com a tendência pela cores dos candles e também pela sinalização:
Quando green, a compra será no cruzamento da Média Móvel inferior cruzando o candle, e a saida será no cruzamento do candle na Média Móvel Superior seguinte.
Quando red, a venda será no cruzamento da Média Móvel Superior cruzando o candle, e a saida será no cruzamento do candle na Média Móvel Inferior seguinte.
Quando o Script sinaliza o candle com X purple, significa que a tendência está em mudança e deve ser fechada toda a operação em aberto.
Este sistema não possui Stop, portando cuidado quanto a seu uso.

Auto Order Block by D. BrigagliaThis indicator finds trend following engulfings, and draws order blocks based on the 1st candle's range (the first candle of the engulfing pattern).
It does filter the trend with simple moving averages of 21 and 55 periods, but it doesn't filter for retracements in the trend (you should consider only the order blocks that are coming from engulfings after a retracement)

Trader Pressure Index (TPX)This is my take on the script by RedK
I kept the algorithm exactly the same, but changed the layout and the default look back period. Most important is that the resulting line, the TPX, is now a histogram with green and red staves.
To put the histogram on a logical place in the graph, I changed the way the control/dominance level is implemented, it now lowers or highers the whole graph, this way the zero level becomes the ‘no interest’ level.
I added two horizontal lines at a distance of 40 because I feel that this is sort of an oversold / overbought indication. In practice not very convincing, but provides a visual comparison.
In this layout I explain that grass is growing on bull hills peaking up behind the foreground and blood is dripping from the bear hills.
Enjoy.

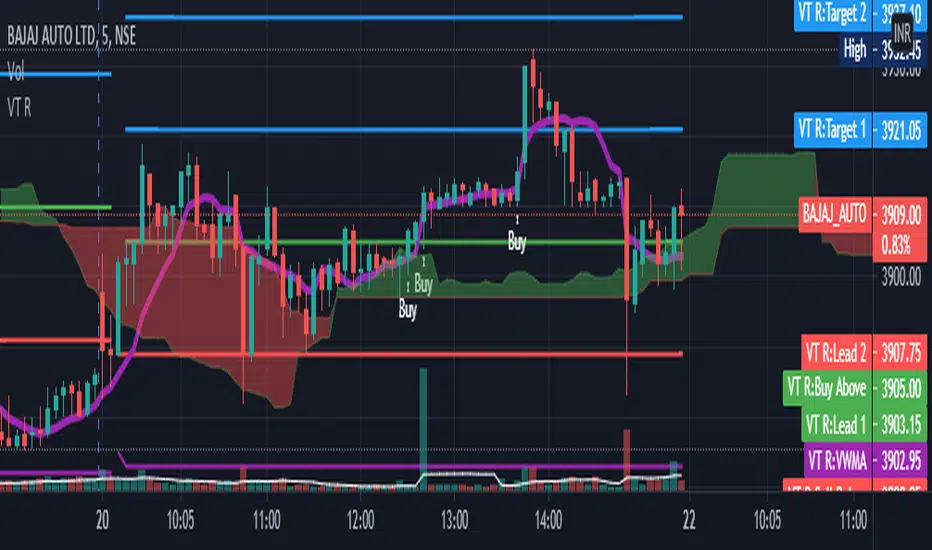
VT R Cloudsettings for the VT R Indicator
VT R TIme (Minues) = 10
Session Time = 09:25 - 09:35
Show VT R Ticked
Show VWMA Ticked
VWMA Period = 10
Long Trade Rules
1. Close ABove buy above
2. trade above ma
3. volume > ma (volume Settings Given Below)
4. sl below sell below
Short Trade Rules
1. close below sell below
2. trade below ma
3. volume > ma (volume Settings Given Below)
4. sl above buy above
Volume Indicator has to be added manually i suggest to use the default Volume Indicator
Settings for the Volume Indicator
Lookback = 10
ShowMA Ticked
LengthMA = 10
FibBand, Perfect Trendline Trader and Target SystemSo, Dear Friends, I am open-sourcing one of my scripts which I created as a thesis project,
The Auto Trader System is a Scalping Tool , to be used mostly in intraday Setups!!
and is designed using,
1. Fibonacci Bands
Fibo Bands are Calculated by defining dynamic Fibonacci Pivots Lines over a history of Lookup values (Default is 89 periods lookback),
The bands help in identifying the Target Points for the setup
2. Perfect TrendLine Setup
The script uses PTS, as a filter to define the optimum entry and exit points
Which timeframe it works for ?
Works for Any Time Frame, but Intraday setups are good!
Who is this System for ?
Beginner and Intermediate Traders
Provision For Alerts
The Script has provision for both long and short alerts!!
Enjoy!
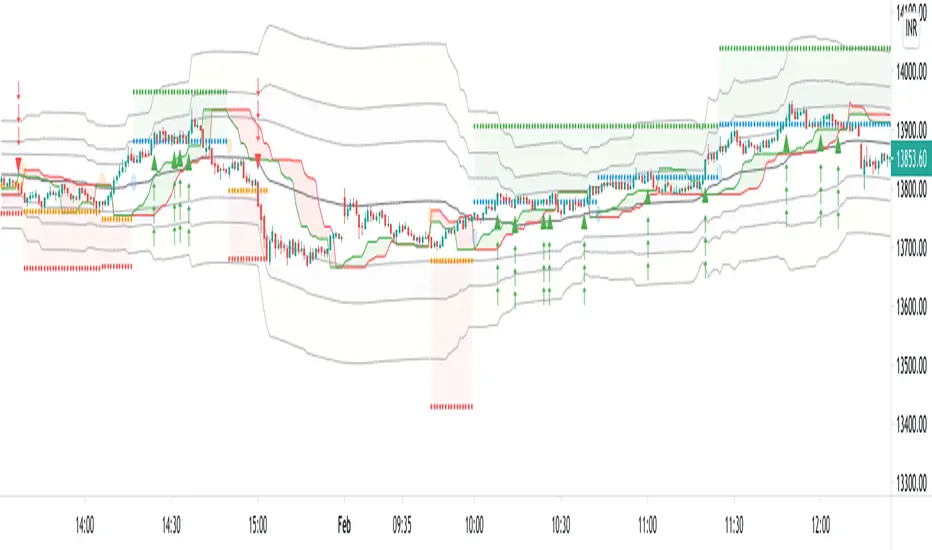
Dynamic Range here comes open source version of notorious JFT Indicator ( the indicator access you can get in some bucks ) on various telegram channels however they will not give code.
Now how it works
1. 2 ranges derived from indicator are supposed to be a consolidation zone and any close above or below is supposed to give a good move.
2. I personally consider it as may be addition to price analysis. ( i don't believe much in indicators,even simple MA gives fruitful results when there is good move in market )
3. Range can be drawn on chart with various resolution ( Daily/Monthly/Weekly )
PS: I coded myself based on data analysis shown by access only indicator. In case you use it for your publication don't forget to give credits.
Thanks,
daytraderph

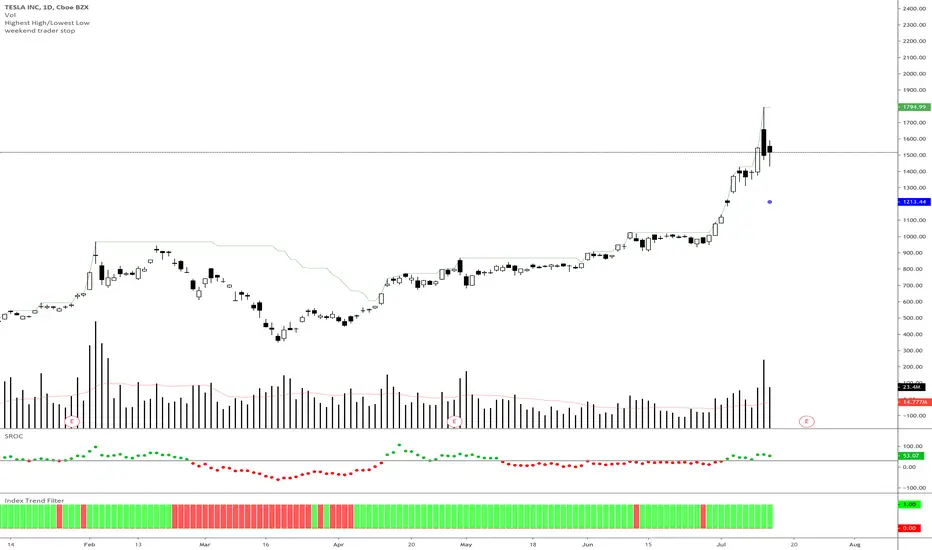
Weekend Trader Smoothed Rate of Change
Rate of change indicator based on Nick Radge's Weekend Trend Trader Strategy, with an added extra of EMA smoothing if you want it.
This indicator simply turns green when the rate of change is above a certain level (value is set in threshold)
Threshold is defaulted to 30 as outlined in the strategy rules
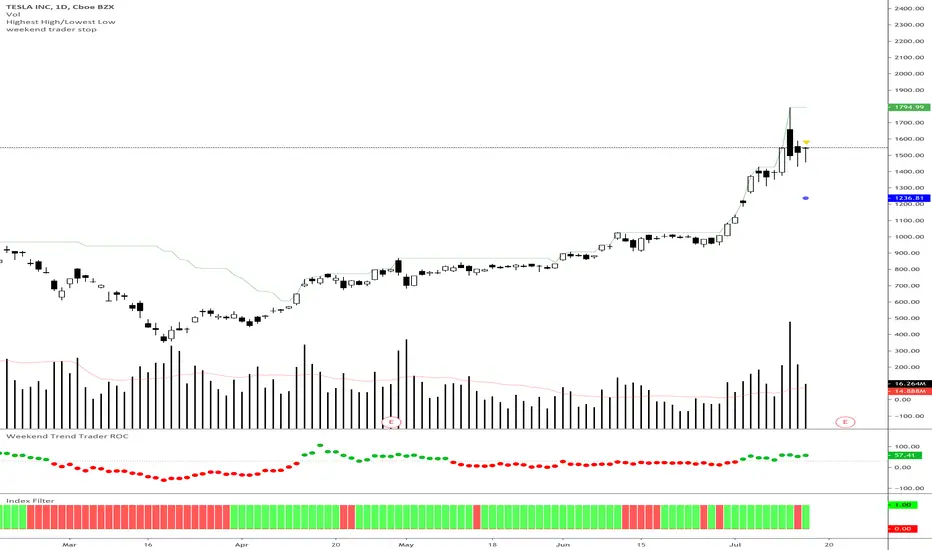
Index Trend Filter - Weekend Trend TraderThis little script simply gives you a quick visual cue of where price is compared to a particular EMA of another security or underlying index.
It is based on Nick Radge's broader market filter weekend trend trader system, but can be applied to other timeframes if you want to confirm if the index is in an up trend or down trend.
• Green means the underlying index price is above the EMA
• Red means the underlying index price is below the EMA
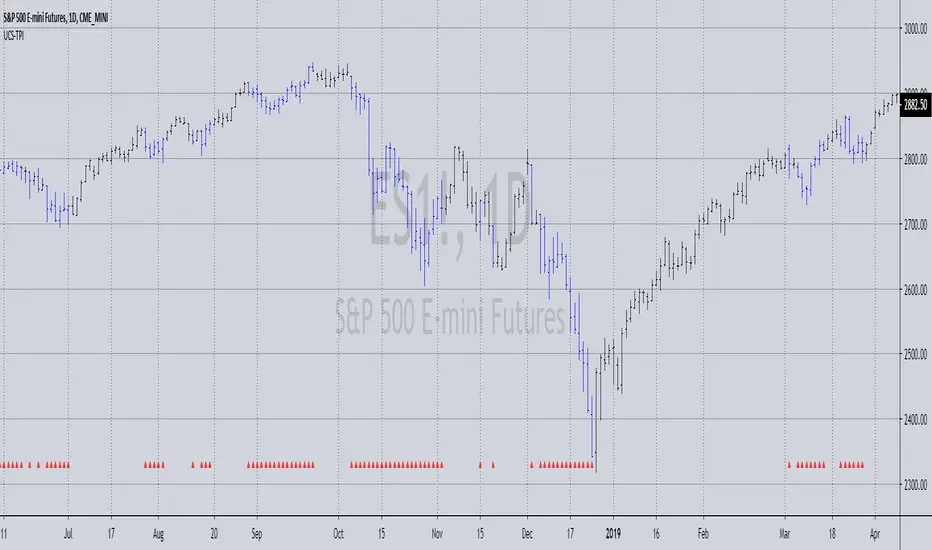
UCS_Trader Pressure Indicator -V1Welcoming everyone to a simple Indicator. I have used the volume of a stock to establish how commited the market for that particular ticker is when it comes to a direction.
The idea behind the indicator is how much of commitment there is towards a move.
*** This indicator is non directional*** ie., It just measures the commitment behind a move.
Why is it important.
Let's say we have a uptrending stock with low commitment (pressure), the bounce on any pullback will not be able carry that any further. So the pressure on the Pullback could drop the stock below and add additional risk. Only for us to wish and think, we checked that previously.
Essentially, If a Trend is being established with a strong pressure (VOLUME BASED). It is more likely to continue.
How you would use this is upto you. But general ideas in Some of these snapshots.
Concluding -
The trend in combination with TPI - Stronger Trend.
In such stronger trends - A pullback (oppsing the trend) have higher probability to bounce.
NOTE - Experiement with the indicator and Trade at your own risk This is a tool, not a system.
Feedbacks are welcome and will be considered for improvement.
Best Wishes
Highs and Lows (Previous Days Projected + Current Week & Month)Credit to Lachlan Smith created original on 31/03/15 - Edited by Elisa 30/3/19
Historical highs and lows
Includes three previous days projected onto today, plus current week and month.
Settings allow for data to be hidden after weekends for use in traditional markets. (i.e. prior 2 days not useful on a Monday)

Derivative OscillatorCredit to Lazy Bear for the original script and Constance Brown for the indicator.
Added horizontals to better compare heights of peaks and minor format changes.

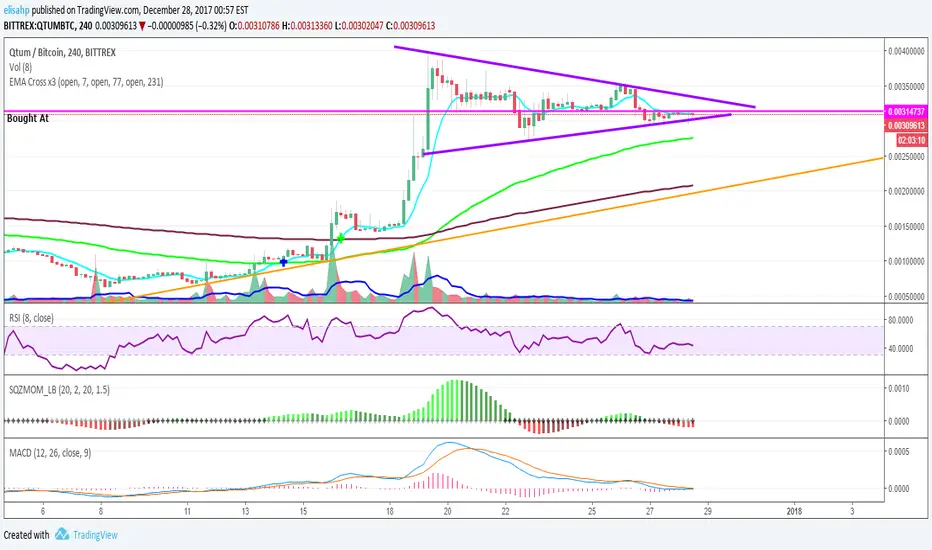
EMA Cross x3 (7, 77, 231)Exponential Moving Average at periods, 7, 77, 231. You will see a blue cross when the short EMA crosses the medium EMA, and a green cross when it crosses the long EMA.
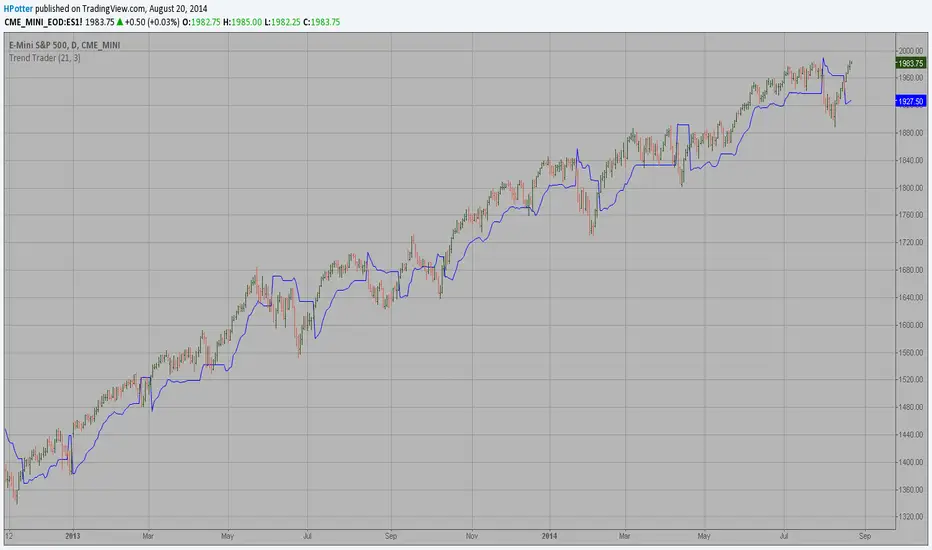
Trend Trader Strategy This is plots the indicator developed by Andrew Abraham
in the Trading the Trend article of TASC September 1998

Trend Trader This is plots the indicator developed by Andrew Abraham
in the Trading the Trend article of TASC September 1998