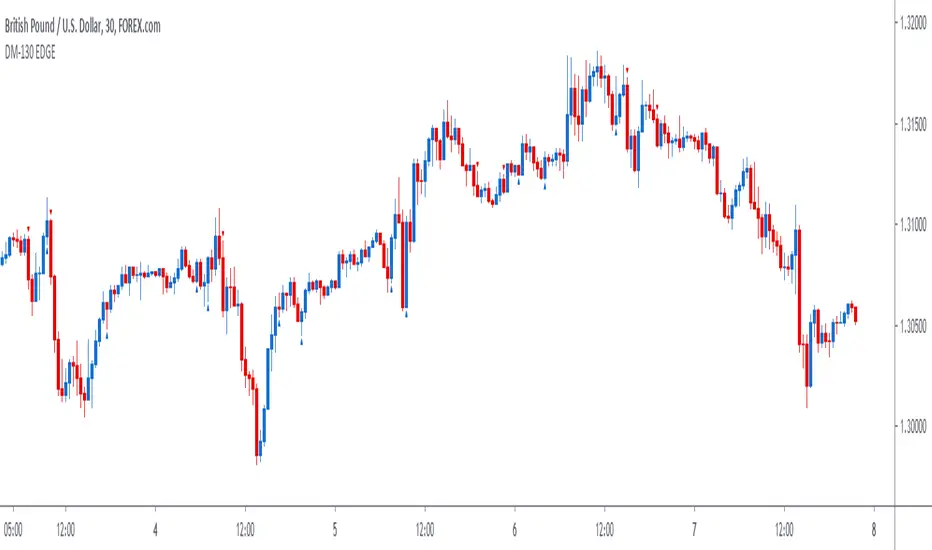
DM-130 EDGE SignalThe DM-130 EDGE is a price action trading signal indicator. There is no need for downloading nor installing. It is an effective signal indicator that has proven to be successful in trading. We will help you set it up within minutes so that you can start trading immediately. It works in trading most markets!
How To Use The DM-130 EDGE:
For a BUY, the signal will display a blue arrow below the candle stick facing upwards when there is a buying opportunity, a pullback or a bullish move in the market.
For a SELL, the signal will display a red arrow above the candle stick facing downwards when there is a selling opportunity, a pullback or a bearish move in the market.
Tradingview Account Level: All Users
The indicator appears once or twice during the UK trading sessions and works best in at confluence points:
1. A Trend Line
2. A Support or Resistant Level
3. Supply or Demand Zone
4. Off Pivots
5. Off a Fibonacci Level
6. In Trend Direction
Best Pair: GBP/USD
Best Trading Times: UK Sessions
How To Set Alerts:
Click on the Alerts button on the charts
Under 'Condition', change from the currency pair displayed to 'DM-130 EDGE Signal'
Then under 'Option' click on 'Once Per Bar'.
Make sure that the you tick the boxes that appeal to you under the 'Alert Actions' part (usually 'Notify on App' and 'Show Popup') and then click the 'Create' button at the bottom.
If you tick the 'Notify on App' box under 'Alerts Actions' the alerts would appear on your smart device if you have the Tradingview App set on the device.
Amongst many great benefits you will 1. Have the confidence to enter trades 2. Have the ability to enter trades after a pullback (something only experienced traders can spot that) and even more importantly 3. You can trade profitably with consistency even if you get stopped out a few times because the wins are usually bigger!
This strategy signal will analyse price action automatically when there is a high probability of a profitable trade to enter.
It does work on most markets. We recommend using the 30m charts as it works best with this indicator. This signal is ideal for intraday/day trading.
This signal allows you to enter trades with confidence.
Use the link below to obtain access to this indicator or you can send us a private message on Tradingview.
Tradingsignals
The SetUpps Strategy EDGE SignalThe SetUpps Trading Strategy HM-415 EDGE, DM-130 EDGE and MD-11 are price action trading signal indicators. There is no need for downloading nor installing. It is an effective signal indicator that has proven to be successful in trading. We will help you set it up within minutes so that you can start trading immediately. It works in trading most markets!
How To Use SetUpps Strategy Signals:
For a BUY, the SetUpps Signal will display a blue arrow below the candle stick facing upwards when there is a buying opportunity, a pullback or a bullish move in the market.
For a SELL, the SetUpps Signal will display a red arrow above the candle stick facing downwards when the is a selling opportunity, a pullback or a bearish move in the market.
The indicator works best in at confluence points:
1. A Trend Line
2. A Support or Resistant Level
3. Supply or Demand Zone
4. Off Pivots
5. Off a Fibonacci Level
How To Set Alerts:
Click on the Alerts button on the charts
Under 'Condition', change from the currency pair displayed to 'The SetUpps Strategy EDGE Signal'
Then under 'Option' click on 'Once Per Bar'.
Make sure that the you tick the boxes that appeal to you under the 'Alert Actions' part (usually 'Notify on App' and 'Show Popup') and then click the 'Create' button at the bottom.
If you tick the 'Notify on App' box under 'Alerts Actions' the alerts would appear on your smart device if you have the Tradingview App set on the device.
Amongst many great benefits you will 1. Have the confidence to enter trades 2. Have the ability to enter trades after a pullback (something only experienced traders can spot that) and even more importantly 3. You can trade profitably with consistency even if you get stopped out a few times because the wins are usually bigger!
The SetUpps Trading Strategy signals will analyse price action automatically when there is a high probability of a profitable trade to enter.
It does work on most markets on all time charts but we will give you our recommended time frames that works best with this indicator.
The SetUpps Strategy signal is ideal for scalping, intraday and for swing trading.
This signal allows you to enter trades with confidence.
Disclaimer:
Previous performances are not an indication of any future performances. We are not investment adviser nor do we advice you on trading. All our opinions, information, analysis, prices and/or market commentary are not advice about investments. Any SetUpps™ Trading staff or partners or representatives can not warrant the completeness, accuracy or timeliness of any information we have supplied and we shall not be liable for any losses or damages, consequential or otherwise, incurred by the use of our products which may be the result of relying on the SetUpps™ Trading strategy. © 2020 SetUpps™ Trading.
The SetUpps™ Trading indicator is built for use on Tradingview. SetUpps™ Trading is not part of Tradingview.

Crypto Trend Following StudyThis is the study script indicator of Crypto Trend Following Strategy which can be used to automate your trading by alerts. With study script indicator, strategy can be easily automated.
To get access to the study script indicator please contact me directly by personal message.
To back test the strategy, see Crypto Trend Following Strategy indicator.
Script is using several moving averages to keep you on the right side of the trend. Signals are also filtered based on other indicators to prevent buying already overbought or selling already oversold coins and avoid ranging markets.
MAIN GOAL
Main goal of the strategy is long-term stable profit. No strategy has 100% accuracy therefore there always will be some false signals. But patience pays, with Trend Following Strategy, you will get couple of small loses while waiting to get big wins when coin is trending strongly. As you never know the right time you must sustain and be in all trades to make sure that you will not miss the big move.
BACKTEST
This script is for free to play with so you can back test and see for yourself how the strategy performs on any of your favourite coins.
Strategy is optimized and back tested for USDT and BTC pairs on 6h timeframe but it can be used on any pair and any timeframe.
RISK & REWARD
Strategy does not use safety orders as DCAs usually leads to bag holding sooner or later. It does not use take profit either as strategy will tell you when to buy and when to sell based on the actual market condition.
You should always use stop loss to protect your account from drawdown or even being liquidated.
You can change stop loss or take profit as you like or even back test the strategy with your preferred settings to find what suits you best.
STUDY SETTINGS
Important: Make sure that you use the same settings for both Strategy and Study indicators.
If you need any help with settings do not hesitate to ask. I would also appreciate any feedback and ideas how to improve the script.
==== Indicators settings ====
RSI Long < and StochRSI Long <
• used to filter out buy signals of already overbought coins - ( stoch ) RSI must be under set value to fire a BUY signal
RSI Short > and StochRSI Short >
• used to filter out sell signals of already oversold coins - ( stoch ) RSI must be over set value to fire a SELL signal
ADX >
• used to filter out buy or sell signals in ranging markets - ADX must be over set value to fire a BUY or SELL signal
MA Fast and Slow Length
• Two moving averages to indicate an actual short-term trend
Baseline Length & Type
• Baseline is a moving average which confirms the longer-term trend. You can set length and type of the moving average
Show every signal
• turn on to see signal on each candle whether strategy recommends opening long or short trade (green triangle – buy, red triangle – sell, no triangle – wait)

Crypto Trend Following StrategyThis is the strategy script indicator of Crypto Trend Following Strategy which can be used for back testing. With study script indicator, strategy can be easily automated.
To set alerts, see Crypto Trend Following Study indicator.
Script is using several moving averages to keep you on the right side of the trend. Signals are also filtered based on other indicators to prevent buying already overbought or selling already oversold coins and avoid ranging markets.
MAIN GOAL
Main goal of the strategy is long-term stable profit. No strategy has 100% accuracy therefore there always will be some false signals. But patience pays, with Trend Following Strategy, you will get couple of small loses while waiting to get big wins when coin is trending strongly. As you never know the right time you must sustain and be in all trades to make sure that you will not miss the big move.
BACKTEST
This script is for free to play with so you can back test and see for yourself how the strategy performs on any of your favourite coins.
Strategy is optimized and back tested for USDT and BTC pairs on 6h timeframe but it can be used on any pair and any timeframe.
RISK & REWARD
Strategy does not use safety orders as DCAs usually leads to bag holding sooner or later. It does not use take profit either as strategy will tell you when to buy and when to sell based on the actual market condition.
You should always use stop loss to protect your account from drawdown or even being liquidated.
You can change stop loss or take profit as you like or even back test the strategy with your preferred settings to find what suits you best.
STRATEGY SETTINGS
You can use the strategy script for fine tuning and find best settings for yourself.
If you need any help with settings do not hesitate to ask. I would also appreciate any feedback and ideas how to improve the script.
==== Indicators settings ====
RSI Long < and StochRSI Long <
• used to filter out buy signals of already overbought coins - ( stoch ) RSI must be under set value to fire a BUY signal
RSI Short > and StochRSI Short >
• used to filter out sell signals of already oversold coins - ( stoch ) RSI must be over set value to fire a SELL signal
ADX >
• used to filter out buy or sell signals in ranging markets - ADX must be over set value to fire a BUY or SELL signal
MA Fast and Slow Length
• Two moving averages to indicate an actual short-term trend
Baseline Length & Type
• Baseline is a moving average which confirms the longer-term trend. You can set length and type of the moving average
==== Test period settings ====
• You can set the back tested window
==== Strategy settings =====
• Target Take profit and Stop loss in %
• Only LONG trades – tick if you do not want to calculate SHORT trades in the back test
• Plot key levels on chart – if you use stop loss and/or take profit, you can turn on levels of price to reach (yellow – bought price, red – stop loss – green - take profit)
Back test calculates with commission and fixed order size. You can change these settings on Properties Tab

The MATRIX: Ultimate Crypto Position FinderThe Position Finder is a visual representation and additional feature of the "MATRIX Ultimate Crypto Position Strategy" and it should therefore be used alongside this script.
***You can find the main trading strategy script on our profile page***
-------------------------------------------------------------------------------
-The Position Finder is a tool that allows the user to see multiple triggers at the same time on a single chart of the "MATRIX Ultimate Crypto Position Strategy".
The Position Finder consists of 3 parts, namely an entry, a re-entry and an exit part (from top to bottom). Each of these three fields is made up of several green, black or red horizontal lines in which each line corresponds to a specific trigger.
-An entry or re-entry signal is valid once all individual triggers turn dark GREEN at the same time (for the top and middle matrix fields respectively). When this happens a bright GREEN vertical line is formed. The main trading strategy script will also print "Long Entry" label. While BLACK color indicates that a certain trigger is not valid. Yes, we know. It sounds very complicated, but once you understood it, we promise it will be the most simple and dare we say, an interesting tool to use.
-An exit signal is made once a single trigger turns RED. The main trading strategy script will also print a RED colored "Long Exit" label. While BLACK color indicates that the exit signal is not triggered.
-------------------------------------------------------------------------------
For those who are interested in the rationale of why a certain entry or exit signal was made a list with triggers can be found below. It contains the complete set of triggers for the entry, re-entry and exit signals from top to bottom.
Entry Trigger List:
1: Evaluation of short term trend: Ichimoku kinko hyo indicator, conversion line related to base line.
2: Evaluation of longer term trend: Ichimoku kinko hyo indicator, price related to the ichimoku cloud.
3: Confirmation of the longer term upward trend: Ichimoku kinko hyo indicator, lagging span related to ichimoku cloud.
4: Confirmation of short term upward trend: Ichimoku kinko hyo indicator, price related to conversion line and base line.
5: Evaluation of longer term trend projection: Ichimoku kinko hyo indicator, projected ichimoku cloud shape.
6: Confirmation of short term trend: Ichimoku kinko hyo indicator, lagging span related to the price.
7: Confirmation of short term trend: Ichimoku kinko hyo indicator, lagging span related to the price (alternative method).
8: Confirmation of the longer term trend: Ichimoku kinko hyo indicator, lagging span related to ichimoku cloud (alternative method).
9: Confirmation of the longer term trend: Moving averages.
10: Confirmation of sufficient momentum: Macd indicator.
11: Evaluation of overbought or oversold conditions in the price: RSI indicator.
12: Evaluation of price equilibrium: Ichimoku kinko hyo indicator, price related to ichimoku cloud , conversion line, base line.
13: Confirmation of general trend: Vortex indicator.
14: Evaluation of price equilibrium: Ichimoku kinko hyo indicator, price related to ichimoku cloud , conversion line, base line (alternative method).
15: Evaluation of volatility: Choppiness index indicator.
16: Evaluation of volume: Volume indicator.
Re-Entry Trigger List:
1: Confirmation of short term upward trend: Ichimoku kinko hyo indicator, price related to conversion line and base line.
2: Evaluation of short term trend: Ichimoku kinko hyo indicator, conversion line related to base line.
3: Confirmation of the longer term upward trend: Ichimoku kinko hyo indicator, conversion line and base line related to the ichimoku cloud .
4: Confirmation of sufficient momentum: Macd indicator.
5: Confirmation of sufficient momentum: Macd indicator (alternative method).
6: Evaluation of overbought or oversold conditions in the price: RSI indicator.
7: Confirmation of sufficient momentum: Macd indicator (alternative method).
8: Confirmation of general trend: Vortex indicator.
9: Confirmation of the longer term upward trend: Ichimoku kinko hyo indicator, price related to the ichimoku cloud .
10: Evaluation of bullish/bearish territory.
Exit Trigger List:
1: Confirmation of short term trend reversal: Ichimoku kinko hyo indicator, conversion line related to base line.
2: Confirmation of neutral territory: Ichimoku kinko hyo indicator, price related to the ichimoku cloud .
3: Confirmation of bearish territory: Ichimoku kinko hyo indicator, price related to the ichimoku cloud .
4: Evaluation of extremely overbought conditions in the price: RSI indicator.
5: Confirmation of bearish divergence signals.
-------------------------------------------------------------------------------
Reminder: Use this trading strategy at your own risk and trade responsibly. We are not responsible for any financial loss using this strategy.
***The script is invite-only, message us to get script access***

The MATRIX: Ultimate Crypto Position StrategyHi all,
We are cryptocurrency miners and 'hodlers’ since 2013, with unwavering confidence in the technology behind it. We’d always thought that it would be a life-changing êvent. And we were right. We went from “broke” to making shit loads of money and all the way back to bitter nothing. If you are lucky, you probably haven’t experienced what if feels to be high on cash and then fall very deep low, but let me reassure you, it is a nasty feeling.
Then we wondered, what the hell did we do wrong? Or better say, what didn’t we do right! The answer was dead simple: We had no experience in trading, we were overwhelmed by emotions and we didn't use any trading strategy. Hence, we were doomed to fail from the beginning.
In order to build an all-in-one profitable trading strategy, we had to start from zero. The one thing we learned is that your goal for financial gain cannot be achieved without discipline and consistency. Our prime focus was to absorb as much info as possible regarding trading and coding by doing an extensive self-study, which consequentially took us to the next level.
One of the secrets to being successful from a trading perspective is to have an indefatigable and undying thirst for information and knowledge. As Bruce Lee once said: “Learning is never cumulative; it is a movement of knowing which has no beginning nor end”. So, we adapted what was useful, rejected what was useless, and added our own preferences based on our mindset. We were totally committed to be the best. Our goal was never to lose money again! Of course, this is an illusion, as no single strategy is correct all of the time.
Therefore, the final trading strategy was based on the following key elements:
• The avoidance of risk is more important than absolute profit. Do not anticipate and do not move without market confirmation. Being a little late in your trade is your indication if you are right or wrong.
• Offering simplicity and practicality, for those that do not have the time to trade 24/7.
• Believe in analysis and not in forecasting. Trading is a skill for those who are smart and gambling for those who are not.
In conclusion, we are absolutely thrilled to finally release this trading strategy after one year of extensive back testing and optimization. The script was supposed to be for personal use only, but because Tradingview has helped us a lot in this process, we want to share it with all of you and give something back to this amazing community. If you learned something new today and found value, please give us a like to show your support! We’d really appreciate it.
***The script is invite-only, message us to get script access***
-------------------------------------------------------------------------------------------------
The MATRIX: Ultimate Crypto Position Strategy should be used as follows:
• The trading strategy was designed and optimized for trading cryptocurrencies only ; furthermore it works best on established high market cap cryptocurrencies that have a clear trend such as:
BTCUSD
ETHUSD
LTCUSD
XRMUSD
EOSUSD
ADAUSD
DASHUSD
ETCUSD
• The trading strategy is based on swing/position methodology. The script must therefore be used on daily timeframe candles only (1D) .
• Use USD trading pairs only (e.g. use ETHUSD instead of the ETHBTC) since the individual trend is captured more effectively and therefore gives better results.
-------------------------------------------------------------------------------------------------
The MATRIX:Ultimate Crypto Position Strategy is based on the following indicators:
• Ichimoku Cloud ; acts as the leading indicator.
• Volume ; without strong volume , a market move is not valid.
• MACD and Vortex ; both being used as confirmation indicators.
• Choppiness index ; avoids trading in choppy markets.
• Bullish/ Bearish Regular Divergences in combination with RSI to spot tops and bottoms.
• Simple and Exponential Moving Averages ; prêvents trading against the trend.
The trading strategy is easy to use, trend based and without repainting, meaning once a signal has been made it is permanent and that no future data is used in the decision making. It detects the trend and filters out market noise based on more than 10 technical indicators. ONLY when all indicators align with each other the algorithm prints a BUY or SELL signal. The trading strategy provides high probability trading signals and minimizes risk! This script aims to capture the profit from longer term trending moves and by doing so filters out non-substantial trends and avoids the associated risks with these trades.
-------------------------------------------------------------------------------------------------
The MATRIX: Ultimate Crypto Position Strategy has the following features:
• Automatically generated Buy / Sell alerts in the form of a label.
• NO Repaint once candle is closed.
• SAFEGUARD ; custom built-in security prevẹnts trading when the price is out of equilibrium.
• Customizable Display for the Ichimoku cloud indicator display.
-------------------------------------------------------------------------------------------------
Below are the backtest results. Keep in mind that this strategy is quite conservative resulting in few long positions. These results are therefore no guarantee for the future.
Back test results: (only Long trades, signal to signal, order size: 100% of equity, commision fee 0.1%, period: start of chart)
Exchange-----Asset---------Timeframe---Percent Profitable----Profit Factor-----Total Trades----Max Drawdown---Average bars in trade-----Net Profit
Coinbase-----BTC/USD---------1D----------------100----------------N/A------------------10---------------0.00---------------------54-------------------6183.6
Coinbase-----ETH/USD---------1D----------------100----------------N/A------------------7----------------0.00---------------------46-------------------11673.0
Coinbase-----LTC/USD---------1D-----------------100---------------N/A-------------------7----------------0.00---------------------46------------------4727.0
Bínance------EOS/USD---------1D-----------------100---------------N/A-------------------3----------------0.00---------------------34------------------42.8
Bínance------ADA/USD---------1D-----------------100---------------N/A-------------------2----------------0.00---------------------40------------------118.4
Coinbase-----XTZ/USD---------1D-----------------100---------------N/A-------------------1----------------0.00---------------------36------------------34.4
Bínance------BNB/USD---------1D-----------------66.7--------------10.8-------------------6---------------24.22--------------------38------------------1488.8
Bínance------ETC/USD---------1D-----------------100---------------N/A-------------------2----------------0.00---------------------33------------------94.9
Bínance------XMR/USD---------1D-----------------100---------------N/A-------------------3----------------0.00---------------------43------------------74.2
Bínance------ICX/USD----------1D-----------------100---------------N/A-------------------2----------------0.00---------------------29------------------215.3
-------------------------------------------------------------------------------------------------
Reminder: Use this trading strategy at your own risk and trade responsibly. We are not responsible for any financial loss using this strategy.
***The script is invite-only, message us to get script access***

THE HITMAN - Advanced Market Momentum FinderThe Hitman indicator is a tool to detect momentum swings in the market. Its intention is to identify good entry and exit points and alert you to have a closer look at the charts. It can be used on any chart, timeframe or market.
This script is meant to build your alerts on. For backtesting different settings we recommend you to use the "THE HITMAN Strategy Tester".
In detail we measure the strength of a trend by different values like volatility , price averages and trend momentum and calculates for every candle, if a change in trend appears or not. The calculation can be influenced by changing three Inputs values.
We do this for getting the best possible results from the Hitman The purpose of this strategy script is to help you identify proper settings for the asset and timeframe you want to trade. There is no general setting that fits it all. You have to find the settings that fits best to your life, your trading style, the assets you trade and the timeframe you trade on. For the strategy on BTCUSD chart shown below, we used the following inputs (25, 2, 20).
Be aware, that all results will be based on data from the past. There is no guarantee that the results you get by back testing, will also be achieved in the future.
An overview of how to use the 3 different options in the settings:
- Signal Strength: The higher this number, the stronger each signal gets. Naturally this means, you will get less signals with a high number. A strong signal is not a guarantee for a big move in the market neither it there any guarantee that the market moves in the projected direction. As the volatility is considered in calculating the strength of the signal, the numerical value may be the same buts its meaning for the calculation could be totally different. This means, on an asset with high volatility the signal strength has to be higher than on an asset with lower volatility .
- Sensitivity: Is calculated into the signal strength. It has the highest impact on the numbers of signal shown but also when a change in the trend is signaled on the chart. The lower the number to more and earlier you get the signals. Enter a decimal to finetune it even further. But be aware that a too low number will create a lot of signals which could make it hard to identify true changes in trend.
- Considered Volatility Range: Here you can set up the considered volatility range. It's impact highly depends on the asset you use it. The number does represent the amount of candles that have to be considered to calculate the strength of the signal.
How to use it?
We recommend to use the signal only in direction of the trend. It can be used to scalp against the trend but for Risk Management reasons we advise not to do so. In sideways movement we recommend to look out for channels or levels of resistance and support and use the signal of the script as confirmation.

CYBER ENSEMBLE {PREVIEW}This is the PREVIEW version of CYBER ENSEMBLE
The subscription based PREMIUM version is found here:
Please PM me for access information.
Signals for the last 5 days are disabled.
Signal Alerts are disabled.
===============
CYBER ENSEMBLE is a sophisticated signalling script base on the interplay of an ensemble of optimized indicators and market state filters.
(>1000 lines of code)
Users are advised to manually back-test and optimize the settings for a particular chart and time frame, before proceeding with its use.
The algorithms will be periodically updated to further optimize and improve their performances, and new algorithms may be tested and added in the future.
Note: In no way is this intended as a financial/investment/trading advice. You are responsible for your own investment/trade decisions.

CYBER ENSEMBLE {PREMIUM}CYBER ENSEMBLE is a sophisticated signalling script base on the interplay of an ensemble of optimized indicators and market state filters.
(>1000 lines of code)
Users are advised to manually back-test and optimize the settings for a particular chart and time frame, before proceeding with its use.
The algorithms will be periodically updated to further optimize and improve their performances, and new algorithms may be tested and added in the future.
Note: In no way is this intended as a financial/investment/trading advice. You are responsible for your own investment/trade decisions.
Please PM me for access information.

Algorithm Builder CRYPTO (m5)Hello traders 👋
I. 💎 SCRIPTS ACCESS AND TRIALS 💎
1. Every 3 weeks trial request access has to be done through my website .
2. My website URL is in this script signature at the very bottom (you'll have to scroll down a bit and going past the long description) and in my profile status available here : Daveatt
3. Many video tutorials explaining clearly how all our indicators work are available on your website > guides section.
4. You may also contact me directly for more information regarding the trading method included in the indicator or how to access it
2.1 Forewords
This indicator is for the Intraday CRYPTO traders looking for fixed entries based on a trading method designed by 2 experienced traders.
It's a variation of our Algorithm Builder with a custom method for 5-minutes chart trading - can be coupled with the UNIVERSAL Algo Builder also,
We designed this framework for CRYPTO/USD and CRYPTO/CRYPTO pairing (ex: LTC/BTC, XRP/ETH, ...).
Made for crypto with enough trading volume (big and mid-caps)
ETH/BTC
XRP/ETH
EOS/USD
The tool works in m5 timeframe but won't work with any other timeframe . Even if applied on a 5-minutes chart; we included higher timeframe indicators to enter more securely.
It includes :
- our proprietary method with fixed entries
- a hard exit system (built-in stop-loss)
- 🔔 Compatible with dynamic alerts 🔔
Dynamic alerts are bringing automated trading to a whole new level. The third-party solutions capturing TradingView alerts are able to use them.
- (optional) we let the users decide to use or not our built-in Trade Manager.
Regardless of the Trade Manager is used or not, one must mandatory exit, once a vertical hard exit bar appears.
- the Algorithmic Supports and Resistances used as safeguards and take profit zones.
Final words
We made it as simple as we could (to be honest it's a very simple system for the end-user) - even with several hundreds of calculations in the indicator.
Please hit me up for any question/feedback/comment
Become the BEST trader that you deserve to be
Dave

10X Trading System10X Trading System (Non Repaint)
TradingView Account Needed: Free
Not satisfied with your trading results so far? This may help:
The 10X Trading System helps you identify tops, bottoms and market direction — quickly and accurately.
The strategy behind its accuracy is the fact that it combines price action and multiple market timing algorithms to determine these significant turning points in the markets.
That way, you can be sure you have the best chance to get the best entry and exit points with perfect timing, and hopefully extract more profits from the markets than anybody else.
Once the 10X Trading system has spotted a possible top or bottom, it clearly displays these Buy or Sell alerts on your charts… showing you exactly where this may occur.
You can activate alerts to never miss a signal.
How to use the signals and alerts:
10X Trading System automatically analyze price action and multiple market timing algorithms to give you a signal when there's a good trade.
Works on all markets on all time frames so it's suitable for binary, scalping, day and swing trading.
10X Trading System allow you to get the best entry and exit points with perfect timing.
If you want more details, the link is in the signature.
Disclaimer:
Past performance is not indicative of future performance. No representation is being made that any results discussed within the service and its related media content will be achieved. All opinions, news, research, analyses, prices or other information is provided as general market commentary and not as investment advice. TradingWalk, their members, shareholders, employees, agents, representatives and resellers do not warrant the completeness, accuracy or timeliness of the information supplied, and they shall not be liable for any loss or damages, consequential or otherwise, which may arise from the use or reliance of the TradingWalk service and its content. © 2019 TradingWalk.
TradingWalk indicators are built for TradingView. TradingWalk is on no way a part of TradingView.

TrenderTrender is an indicator that compiles trend-following ideas in a complete friendly-custom indicator. Based on classic arithmetic moving averages, exponential moving averages, volume and a little bit of Fibonacci. Indicator built and usable in TradingView, focused only for easy visualization of the trend.
Cyber Ensemble StrategyStrategy base on CYBER ENSEMBLE , with stop-loss algorithm integrated.
~ * ~ * ~ * ~ * ~ * ~ * ~ * ~ * ~ * ~ * ~ * ~ * ~ * ~ * ~ * ~ * ~ * ~ * ~ * ~ * ~
Note:
In no way is this intended as a financial/investment/trading advice. You are responsible for your own investment decisions and trades.
Please exercise your own judgement for your own trades base on your own risk-aversion level and goals as an investor or a trader. The use of OTHER indicators and analysis in conjunction (tailored to your own style of investing/trading) will help improve confidence of your analysis, for you to determine your own trade decisions.
~ * ~ * ~ * ~ * ~ * ~ * ~ * ~ * ~ * ~ * ~ * ~ * ~ * ~ * ~ * ~ * ~ * ~ * ~ * ~ * ~
Please check out my other indicators sets and series, e.g.
LIVIDITIUM (dynamic levels),
AEONDRIFT (multi-levels standard deviation bands),
FUSIONGAPS (MA based oscillators),
MAJESTIC (Momentum/Acceleration/Jerk Oscillators),
PRISM (pSAR based oscillator, with RSI/StochRSI as well as Momentum/Acceleration/Jerk indicators),
PDF (parabolic SAR /w HighLow Trends Indicator/Bar-color-marking + Dynamic Fib Retrace and Extension Level)
and more to come.
Constructive feedback and suggestions are welcome.
To continue to keep this strategy free to use, especially if it has benefited your trades, please consider tipping a little of any gains you've made to my HRT fund. =D
cybernetwork @ EOS
37DzRVwodp5UZBYjCKvVoZ5bDdDqhr7798 @ BTC
MPr8Zhmpsx2uh3F5R4WD98MRJJpwuLBhA3 @ LTC
1Je6c1vvSCW7V2vA6RYDt6CEvqGYgT44F4 @ BCH
AS259bXGthuj4VZ1QPzD39W3ut4fQV5giC @ NEO
rDonew8fRDkZFv7dZYe5w3L1vJSE51zFAx @ Ripple XRP
0xc0161d27201914FC0bAe5e350a193c8658fc4742 @ ETH
GAX6UDAJ52OGZW4FVVG3WLGIOJLGG2C7CTO5ZDUK2P6M6QMYBJMSJTDL @ Stellar XLM
xrb_16s8cj8eoangfa96shsnkir3wctdzy76ajui4zexek6xmqssweu85rdjxrt4 @ Nano
~ JuniAiko
(=^~^=)v~
CYBER ENSEMBLE

B3 FisherTransform TraderB3 Fisher Transform Trader ~ As you may have found, Fisher Transform (FT) is not an easy beast to tame. However, I have never seen an indicator so consistently early to a move, so, I had to pry into it some more. I tend to stick with indicators that work on many symbols and time-frames, but FT isn't one of them. For starters, I only had a small amount of success in back-tests and only with stocks not futures. I did find however that when set to 9-10 and tightly trailed with a signal average and then put to a intermediate chart like 2h to day bars, it seems to have a nice sweet space in back-tests. I found this to work in multiple platforms, and after plenty of testing, I came up with a few personal tweaks to the indicator. Then walking forward the tests have played out like the back-testing, which is key!
Each symbol you trade will have a sweet spot bar interval in that intermediate area, so long as you keep the input setting to 9-10 for the FT and 2-3 for the signal average length. You are welcome to test well beyond these parameters . :)
Here is a quick view of the success the system has had trading AAPL in binary long or short at all times fashion over the last 10 years.
virtuosotrader.files.wordpress.com
~B3

EMA SMA ALERTS V1 2H// Strategy based on Simple Moving Average (SMA) and Exponential Moving Average (EMA)
// Greatest profit index on 2H time frame
// Created and based on Binance chart
// Working with comission
// No repaint
// Alerts +

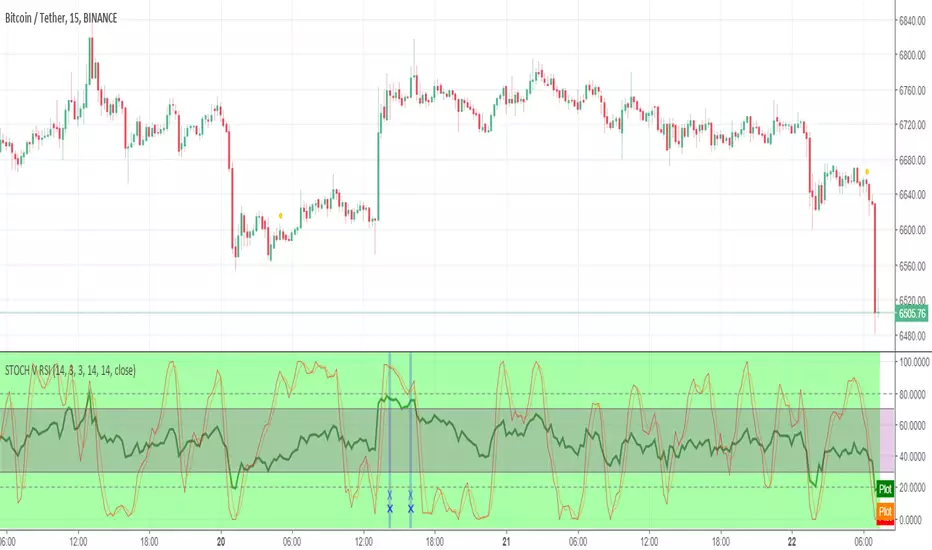
🥢 Crypto-Sticks: Rate of Change v1.0 by Cryptorthyhms🥢 Crypto-Sticks™ Rate of Change
A new series of indicators brought to you by Cryptorthyhms...giving you an alternate look at your trusted favorites!
🚀 Indicator Specific Info
⛔Please remember that you will have to adjust the ROC overbought and oversold levels to suit the volatility of the instrument you are working with. In the future I will implement a feature that does this automatically, but for now its manual.
The OB/OS zones are given in two levels, because often you can find a line of best fit that will hit "small movements" and one that will hit "big movements." In this case I chose 2 and -2 for the small zones. For the bigger zones i chose 5 and -5.
Heiken Ashi candles adds some more clear trend changing points which can be executed at the second candle going in either direction. Other coins/charts will require their own strategy - you could potentially have to tweak that parameter. In this example you would enter on 2nd green, exit on 2nd red.
Volume weighting the HA candles adds a different dimension to the indicator which I have to explore more fully.
Since WTI doesnt have volume, this feature is irrelevant for this chart.
💭Please leave me any ideas or feedback you have!
🚫If you use volume weighting you should be on heiken candles.
🚀 Crypto-Sticks General Info
🚧This series isnt polished 100%, and I have some more options I will add in the future. But for now, I want to just release them, as I am not sure when I will have the time to put more work into them (many other big projects I am working on).
📊Its basically reinterpretations of all your favorite indicators. I calculate the values a little bit differently than normal, but the end result is creating a candlestick chart (for the indicator!). Then I added the option to plot them as Heiken Ashi candles to smooth out noise and make signaling easier. Here's how it looks as Heiken Ashi:
🔊Lastly I implemented a Volume Weighting system for them all which simply integrates volume into the formulas for these indicators. For the most part this feature is experimental and doesn't provide huge utility (yet - I have other ways I want to try it as well - just no time). Though on some of the indicators it already shows great promise.
👍Enjoying this indicator or find it useful? Please give me a like and follow! There are many more indicators to be released in this series, not to mention I post crypto analysis and other free indicators regularly.
💬Questions? Comments? Want to get access to an entire suite of proven trading indicators? Come visit us on telegram and chat, or just soak up some knowledge. We make timely posts about the market, news, and strategy everyday. Our community isnt open only to subscribers - everyone is welcome to join.

Jeff IndexI do not recommend using this in downtrend, public version will be available soon
Aslo, It is built for Buy'n'Hold

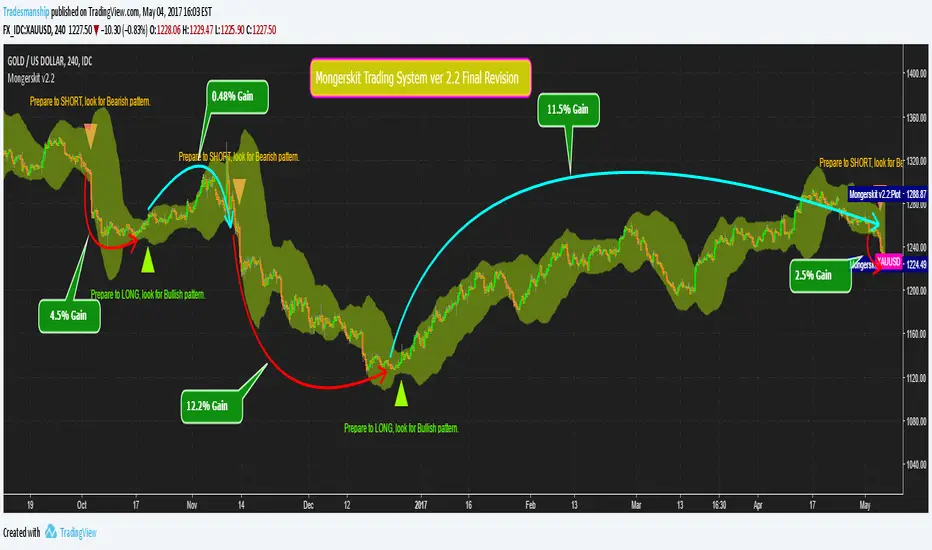
Mongerskit Trading System v2.2 Final revisionThis is the latest version without any reported bugs, we have also increased the accuracy by at least 10% compared to ver 1.0 and older versions. numerous tweaks have been done on this and we are going to keep this stable version, till we work on future updates for later.
(USABILITY)
- Use this system in conjunction to your technical analysis to achieve optimal performance.
- Best time frame is 4 hours and 12 hours.
- DO NOT use the system with pairs that are consolidating.
(CHANGES)
-v2.2
- final tweaks are done to this revision
- few appearance changes
- minor reported bug fixes
-v2.1
-changed the sensitivity a little more.
-fixed all the reported bugs and issues
-fixed a problem with chart scaling down when using the indicator
-fixed some typo with signal text
-v2.0
- changed the sensitivity and few settings, signals are much more accurate.
- made a few appearance changes.
- Signals may appear less then before but they are much more accurate, use 4 hour and 12 hours together to determine best entry.
- this is the Dark theme, I will release the Light theme too for the ones using lighter background colors.
v1.1
-fixed the amount of times the signals are shown
-fixed some color issues
v1.0
This is the first edition of Mongerskit trading system. this is not a very accurate version, this version completely free to use, you can find it in the public library under "Mongerskit" name.
you can request for invitation in the comment section, but you have to leave a review after testing the system out.
the invitation is for a short while just for you to test out the indicator, if you enjoyed the indicator, PM ME.
all members that requested permission in previous versions, should already have access to the new version.
Mongerskit.com