Combo Strategy 123 Reversal & Average True Range Trailing Stops This is combo strategies for get
a cumulative signal. Result signal will return 1 if two strategies
is long, -1 if all strategies is short and 0 if signals of strategies is not equal.
First strategy
This System was created from the Book "How I Tripled My Money In The
Futures Market" by Ulf Jensen, Page 183. This is reverse type of strategies.
The strategy buys at market, if close price is higher than the previous close
during 2 days and the meaning of 9-days Stochastic Slow Oscillator is lower than 50.
The strategy sells at market, if close price is lower than the previous close price
during 2 days and the meaning of 9-days Stochastic Fast Oscillator is higher than 50.
Secon strategy
Average True Range Trailing Stops Strategy, by Sylvain Vervoort
The related article is copyrighted material from Stocks & Commodities Jun 2009
WARNING:
- For purpose educate only
- This script to change bars colors.
Trailingstop


TSLS "Trailing Stop Loss Size"This simple script indicates the exact and secure lot size in Pips to use. The indicator is based on the current average true range and volatility. The line also changes color based on the current volatility, so if you see the yellow color then think twice ;)

Modified Gann HiLo ActivatorIntroduction
The gann hilo activator is a trend indicator developed by Robert Krausz published into W. D. Gann Treasure Discovered: Simple Trading Plans for Stocks & Commodities . This indicator crate a trailing stop aiming to show the direction of the trend.
This indicator is fairly easy to compute and dont require lot of skills to understand. First we calculate the simple moving average of both price high and price low, when the close price is higher than the moving average of the price high the indicator return the moving average of the price low, else the indicator return the moving average of the price high if the close price is lower than the moving average of the price low.
My indicator add a different calculation method in order to avoid whipsaw trades as well as adding significance to the moving average length. A Median method has been added to provide more robustness.
The Indicator
The indicator is a simple trailing stop aiming to show the direction of the trend. The indicator use a different source instead of the price high/low for its calculation. The first method is the "SMA" method which like the classic hilo indicator use a simple moving average for the calculation of the indicator.
Sma Method with length = 25
The "Median" use a moving median instead of a simple moving average, this provide more robustness.
Median Method with length = 25
The shape is less curved and the indicator can sometimes avoid whipsaw with high's length periods.
Mult Parameter
The mult parameter is a parameter set to be lower or equal to 1 and greater or equal to 0. High values allow the indicator to be far from the price thus avoiding whipsaw trades, lower ones lower the distance from the price. A mult parameter of 0.1 approximate the original hilo indicator.
In blue the indicator with mult = 0.1 and in radical red the original hilo activator.
Conclusion
The modifications allow more control over the indicator as well as adding more robustness while the original one is destined to fail when market price is more complex.
Thanks for reading :)
For any questions/suggestions feel free to pm me

Flagging BandsIntroduction
A pun between the word flag and the adjective flagging (less dynamic) , this indicator have two bands who react faster when in contact to the price. Imagine you are under sheets, if you abruptly rise, the sheets will instantaneously go up, then if you abruptly get down, the sheets will fall slowly until being in contact with a surface, this is because of a type of friction called drag or air resistance , this force is described in fluid dynamics and i inspired myself from that for the creation of the indicator.
The indicator
The indicator is made of two bands, one upper band and one lower band, then a weighted average of each bands, this average is weighted depending on which band the price is closer. The length control the period of the indicator, in general higher lengths will create wider bands, you must consider that this parameter behave differently than other ones and may create slower results in comparison with other bands indicators while having the same length period.
The indicator can use a simple breakout methodology (see trailing stop part) but can sometime provide support and resistance points, in fact i believe that when the average variability/volatility of band A is higher than the average variability/volatility of band B and that the price cross band B then price will reverse its direction, this claim is not justified, research is needed.
Trailing Stop Mod
It is possible to make the indicator act as a trailing stop, in order to do so just tick the trailing stop mod box.
The average/bands will automatically disappear being replaced by the trailing stop.
Conclusion
I was just playing around when making the skeleton of the indicator, i hope the code is easy to understand, if you need some kind of explanation just pm me, i'm always open to help people/receive suggestions.
Best Regards

Move Up StopsThis script creates a stop loss level and then moves it up in 5% increments as prices increase.
Basically, it checks to see if the lowest low of the last 7 days is above a certain level. If yes, it sets the stop at that level. It then checks for the next highest level and keeps going until the price is not above a level. Those variables are then set to the level below them.
Trailing stops are notorious for skewing backtest results. This script avoids that problem. Also, some exchanges do not offer trailing stops, so this script gives you a signal to let you know its time to manually move your stops up.
I will be using this for swing trades involving both crypto and stocks.

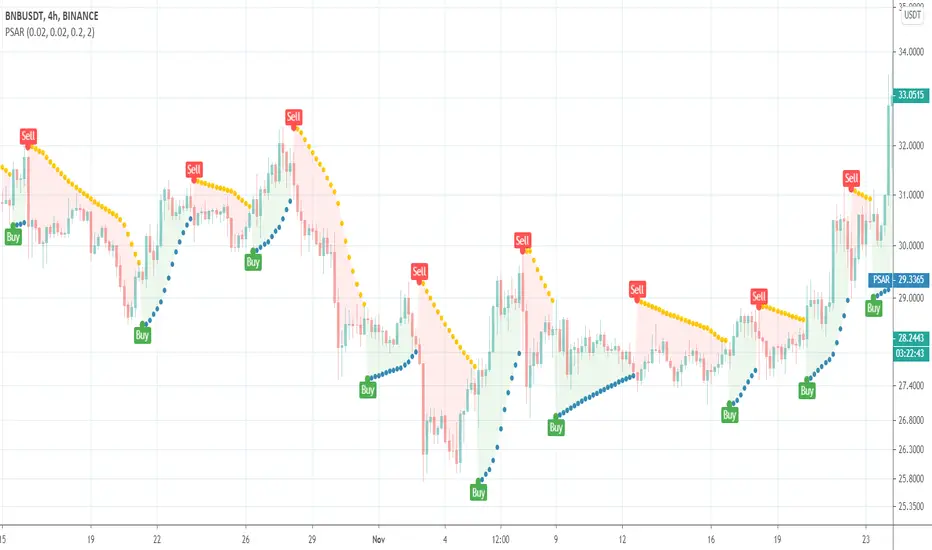
Parabolic SARThis is a redesign of the built-in Parabolic SAR indicator. I added a proper input system, an option to highlight initial points for both lines and an option to choose points width. So, customize it as you want.
Parabolic SAR was originally developed by J. Welles Wilder and described in his book "New Concepts in Technical Trading Systems" (1978). It is a trend-following indicator that can be used as a trailing stop loss.
To know which settings for PSAR are the most profitable on your instrument and timeframe you can use this tool
Profitable Parabolic SAR
MTA-Traling StopIntroduction
Based on my previous indicator , this indicator plot a trailing stop using classic conditions.
Using The Indicator
Like any trailing stop when price is higher than the trailing stop this imply a buy signals, when price is lower than the trailing stop this imply a sell signal. It is possible to use decimals instead of integers for length as shown here :
length = 14.7
The indicator tend to react faster to price movements when a trend has been really long, this methodology is similar to the one used by the parabolic sar.
Downsides
Lack of robustness with the length parameter, the behaviour of the trailing stop can be hard to predict. There is a real need for control.
Conclusion
The indicator can be adaptive, even if it already is in a certain way, by changing the alpha variable at the start considering that 0 < alpha < 1. Its not recommended to use it right now except for testing/coding purpose.
It is clear that i'm not enthusiast when it come to this script, there is a real lack of accuracy, i still hope it can be of use.

Profitable SuperTrendHello friends,
This script is a powerful, non-repainting optimizer for the classic SuperTrend indicator — one of the most popular tools for trend-following and volatility-based trading. It automatically finds and applies the most profitable SuperTrend settings for each instrument and timeframe, removing the need for manual parameter tuning or guesswork.
🛠 How It Works
The indicator evaluates over 1,400 combinations of ATR Periods and Multipliers using a decision tree–based optimization algorithm .
Each configuration is backtested across the instrument's full history, and when a more profitable setup is identified, the indicator automatically switches to those values in real time — while preserving the standard SuperTrend logic.
It also supports commission customization for more realistic backtesting and includes an alert system that notifies you whenever a better parameter set is found.
This adaptive approach keeps the SuperTrend continuously tuned to evolving market conditions without repainting or distorting past data.
💡 Integrated Versions Explained
This all-in-one tool merges 3 complementary indicators:
• Profitable SuperTrend — A dedicated optimizer that runs in a separate window below your chart. It doesn’t produce buy/sell signals directly but analyzes your asset and timeframe to find optimal ATR settings. Results are visualized as two lines (purple and orange), with optional labels displaying the best parameter values. You can then manually apply these values to your standard SuperTrend.
• Self-Adjusting SuperTrend — A real-time overlay version that behaves like the standard SuperTrend but dynamically adjusts its parameters on the fly. It requires no manual setup and can be paired with the Profitable SuperTrend for full transparency over which values are currently active.
• Compact Self-Adjusting SuperTrend — A minimalist oscillator version that uses simple binary outputs: -1 for Sell and 1 for Buy. This format is ideal for filtering or integrating the adaptive logic into other trading systems.
Together, they form a complete adaptive suite that combines automation, flexibility, and precision — suitable for both discretionary and systematic traders.
🔥 Key Features
Adaptive optimization powered by a decision tree–based algorithm
Real-time switching to the most profitable SuperTrend parameters
Commission customization for realistic backtesting
Direction filter (Longs | Shorts | Longs & Shorts)
Optional analysis start date for focused historical testing
Smart alert when better settings are detected
Optional buy/sell labels and compact trend output
Clean and organized UI with improved workflow
If you'd like access or have any questions, feel free to reach out to me directly via DM.
👋 Good luck and happy trading!
付費腳本

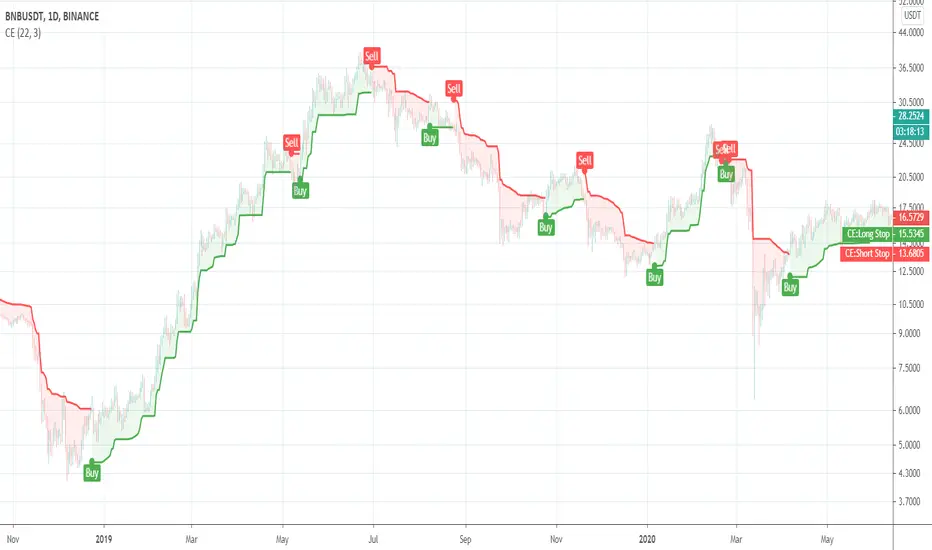
Chandelier ExitThis is a redesign of the Chandelier Exit indicator. It removes stupid transitions between Chandelier Exit' states and highlights initial points for both lines.
This indicator was originally developed by Charles Le Beau and popularized by Dr. Alexander Elder in his book "Come Into My Trading Room: A Complete Guide to Trading" (2002).
In short, this is a trailing stop-loss based on the Average True Range (ATR).
SuperTrendThis is a redesign of the SuperTrend indicator. It removes stupid transitions between SuperTrend states and highlights initial points for both lines.
SuperTrend is a moving stop and reversal line based on the volatility (ATR).

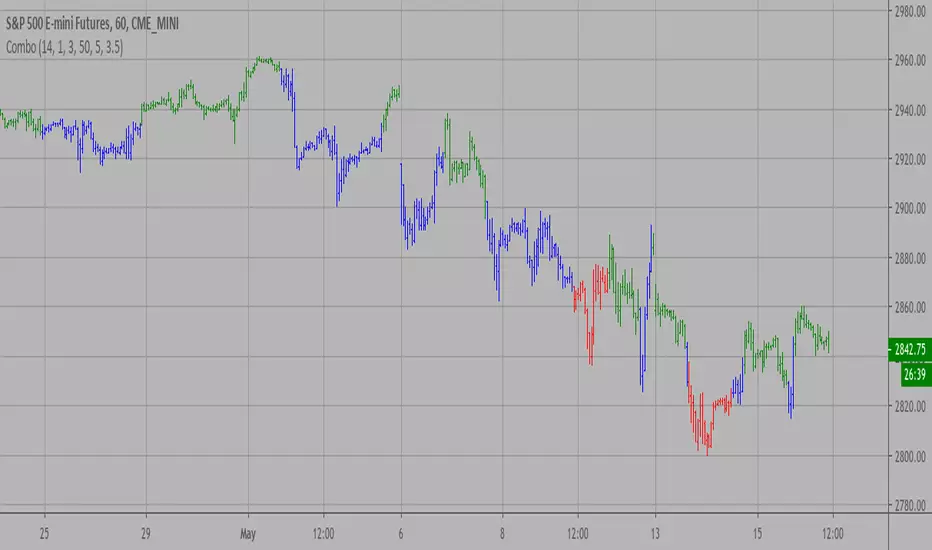
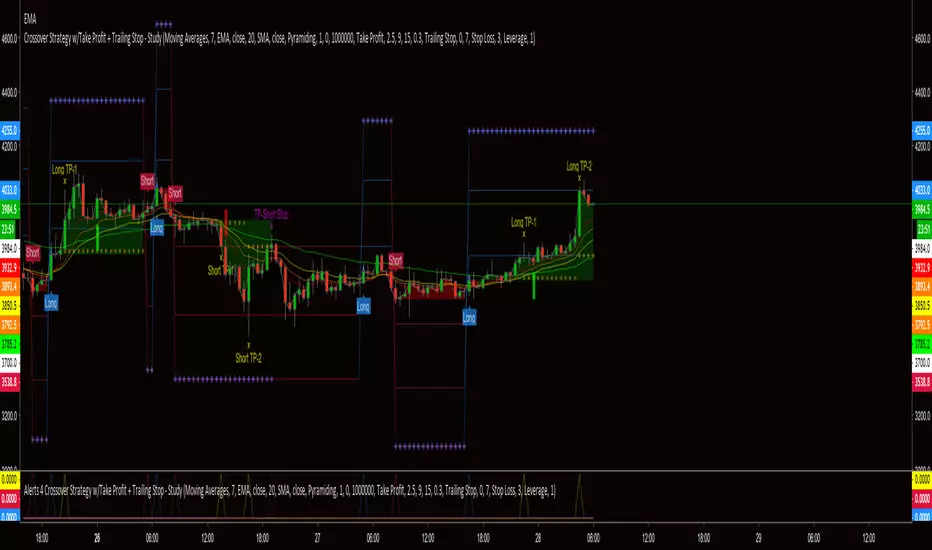
Crossover Strategy w/Take Profit + Trailing Stop - StudyThis script is a result of hours of trail, error and research. If something is not functioning as anticipated, please notify me with a description and possible screen shot of the issue.
The strategy is a basic crossover strategy. When MA1 crosses above MA2, it will trigger a long entry. When MA1 crosses below MA2, it will trigger a short entry.
When using the Take Profit function, the trailing stop will automatically activate at the defined TP3 level.
Also, when TP1 is hit a stop loss is set at 0.3% (this can be adjusted in settings) above/below the current entry. When TP2 is achieved, the stop will move up to the TP1 level.
If the trailing stop locks in LESS profit than the TP2 level, the stop will trigger at the TP2 level. This will continue until the trailing stop has moved to a level more advantageous than TP2.
There is a companion Alerts script for use with AutoView.
***AutoView syntax IS NOT provided***
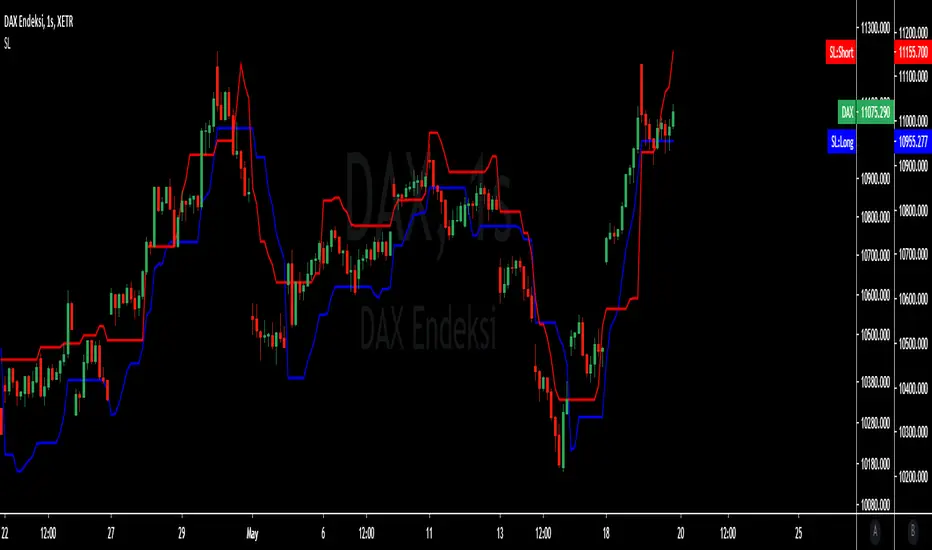
Trailing Stop Loss MTFMultiple Time Frame Version of Trailing Stop Loss Indicator
TRAILING STOP LOSS INDICATOR is a helpful tool for traders to help one of the greatest problems that they face: where to sell?
by using trailing stop loss you can easily decide and see possible downward movements and understand if you are in a safe zone.
Using Trailing Stop Loss is just simple:
Go short/ Sell when price crosses down the indicator,
Stay on long position if prices are above the indicator.
The indicator is calculated from previous Lows and doesn't the value won't change until prices makes higher lows.
TURKISH EXPLANATION:
İz Süren Stop Loss İndikatörü
Adım 1- bu günün düşük fiyatından geriye doğru, daha düşük fiyatlı bir günle karşılaşıncaya kadar yatay bir çizgi çizin
bu sizin birinci countback’ iniz olacak.
Adım 2- bu yeni düşük günün düşük fiyatından geriye doğru tekrar bir başka düşük güne gelene kadar yatay bir çizgi
çekin. Bu sizin ikinci countback’ iniz olacak.
Adım 3- bu ikinci düşük günün düşüğünden ileri bu günkü tarihe kadar yatay bir çizgi çekin bu sizin talimat
verdiğinizde stop-loss noktanız oluyor.
Kural 1- asla aşağıya doğru stop koymayın. Eğer yeni stop-loss noktanız öncekinden daha düşükse onu atıyorsunuz.
Bu kural asla bozulmamalı.
Kural 2- countback çizginiz üzerindeki aynı düşük fiyata denk gelen günleri yok sayın. İkinci contback çizginizi çekmek
için ilkinden daha düşük bir nokta bulmalısınız. Eğer aynı düşük fiyata sahip bir çubuğa denk gelirseniz daha düşüğünü
buluncaya kadar devam edin. Gerçekten hepsi bu kadar. Bu kuralları uygulayarak stop-loss noktamızı her yeni günün
datası eklendikçe uzatabiliriz.
drive.google.com

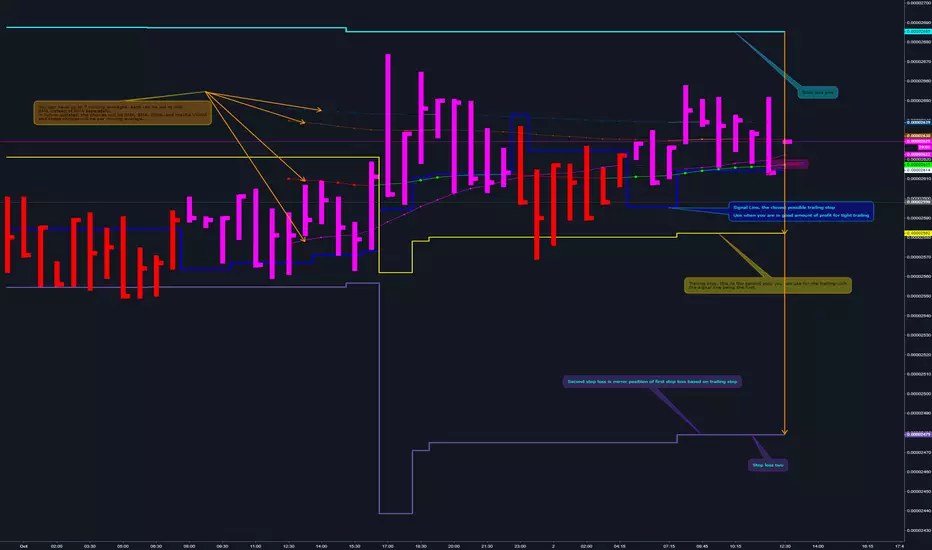
Trader Set - Uni Renko BarsBefore we start, to Trading View Developers :
1- Give us a command to get projection bar's current value, close gives the last bar's closed value not the real time market price
2- Why indicators and Oscillators can't update themselves on the projection values? It doesn't make sense, YOU are drawing the projection but won't let indicators / Oscillators update during that time?
3- Give us a damn section in category list for things like this, there was not category for a custom chart type !
Ufff, now that I took those words out of my system,
Here is the story,
few months ago (read it 10 months) I found about Woodie's indicators in Ninja Trader. At the time I didn't know the exact name for the type of charting he was using, all I knew was one sentence he said, it's based on a median renko chart (well, he told different things in different places, but this one was accurate). So? I started a huge R&D, lots of nights with head aches and not sleeping. Finding the exact formula HE was using was a nightmare. When I was close to the end of road in developing this chart type, I found in futures.io forum that Woodie got the IDEA from another member of futures.io, at least now I new that these charts are called Uni Renko Charts. But the image in the forum was not what you would see in ninja trader, also, they ask for 100$ for elite membership, I was so close in solving the equation myself that it was not worth paying it.
At the end I was successful thanks to another script I found in trading view! The formula for drawing the bar was not what the guy was using, but the heart of this system, the smoother price per bar... It was there.
At the end of the road, that few lines of code was the only thing I could find, the dynamic trend ( Purple Crosses in picture ) for example, was a nightmare to make. What woodie had made no sense to be used as trailing stop, the stop would be hit by market so late that you would loose most of the profit, at the same time, during the retraces is the trend, it would be easily hunted !!! That was the clue for me to look for something by myself.
At the end of the road, after 10 months of R&D, without a solid source of information, I got it working.
To use this, you should set your chart on Renko, Traditional with box size of 3.
Please, don't ask for access, only my students from my classes will have access to this indicator, at least for time being. If at any time in future I wish to sell, you will find the price and how to buy in the comments bellow.

📊 Advanced Charts Suite v2.1 by 🇨🇷🇾🇵🇹🇴🇷🇹🇭🇾🇭🇲🇸📊With the advanced charts suite you get multiple indicators you can overlay on your charts, while only using one indicator slot.
🎁We made this after requests from our members, to assist those who use a free TV account. Its not advised to use them all at once, use them in combinations and see what works for you!
🕥 It can take a minute or more to load... be patient! I wanted to include more indicators, but hit some of the limits imposed by pine script. All options are off by default.
📊 Indicators Included are:
✅Ichimoku Cloud
✅Support Resistance Fractal
✅Trailing Long/Short Stoploss
✅Bull Bear Squares
✅Triple Hull Moving Average
✅Standard Hull Moving Average
✅Fibonacci Daily
✅Advance Decline Lines
👍If you enjoy the Charts Suite, please like the indicator, and follow me on TradingView!
💬Come chat with us in telegram (link in signature) if you have any questions or would like a trial of a premium indicators (linked below).

SuperTrend ATR + RSI with signalThis is an updated version of Crée par J.Dow's very interesting indicator- myself and Squiggles added the alert function in there. The original description and explanation can be seen here.
Some settings work better than others on different timeframes- have a play around, I'd be interested in seeing what optimum settings you might be able to find.

NeoIchi TrailingThis is the separation of moving average parts from NeoIchi indicator with addition of four different ATR setting that can be used for Stop Loss and Trailing Stops. The NeoIchi indicator won't have any moving averages any more, the code is secured but every one have access to use this indicator on their charts.
MOST by Anıl ÖZEKŞİMOST : Moving Stop Loss Indicator
Developed by economist Anıl ÖZEKŞİ for MATRİKS TRADER platform.
This indicator is like a trailing stop indicator but differs in two ways.
First, trailing stops often uses price bars to determine the stop level, but MOST uses an adjustable percent of the Exponential Moving Average of the price which smooths the sudden price moves.
The second thing is that MOST gives BUY and SELL signals instead of giving one way signals for price action.
MOST has an EMA and a trailing percent stop level of EMA that can be adjusted by changing the length of the EMA and %percent of the stop level.
BUY when ExMoV crosses above MOST
LONG CONDITION when ExMov is above MOST
SELL whenExMov crosses below MOST
SHORT CONDITION when ExMov is below MOST
Developed by Anıl ÖZEKŞİ teknikanalizsanati.com

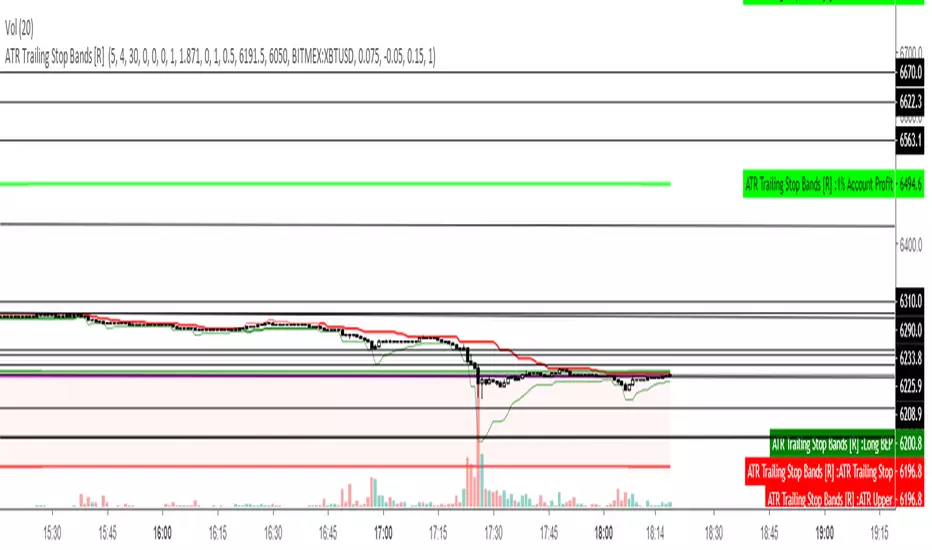
ATR Trailing Stop Bands Strategy [R] Originally based on a script by HPotter for an ATR Trailing Stop, which itself was based on an article by Sylvain Vervoort, but I adapted it to add Bands, to add extra optional Wick Protection, and have now made it a Strategy. It's not great for entries/exits, but as a Trailing Stop that can let winners ride, it's great.

Ergotic MACD Strategy [forked from HPotter]Ergotic MACD Strategy forked from HPotter
In addition to this fine script you will find some additional features:
- Backtester
- Alerts
- Filters: RSI, MFI, Price trend
- Trailing Stop Loss
- Other minor adjustments

ATR Trailing Stop Bands [R] This is based on the Average True Range Trailing Stops Strategy by Sylvain Vervoort, coded on TV HPotter. I have added Bands to see potential short and long stop loss zones before the indicator signals to switch itself, also changed color on the main Trailing Stop based on whether it is short or long, added increased stop loss hunt protection by combining with my Wickiness indicator to add Wick Protection, based on either Average or Maximum Wicks, to prevent your stop getting wicked out. Experiment with different timeframes according to your trading style and how long you like to hold a trade. This indicator does not intend to tell you when to take profit, just how to place your stop to give you the best chance of not getting stopped out too early and to minimise risk by trailing it safely.
May you all never be stop hunted again.