Session Open Range, Breakout & Trap Framework - TrendPredator OBSession Open Range, Breakout & Trap Framework — TrendPredator Open Box
Stacey Burke’s trading approach combines concepts from George Douglas Taylor, Tony Crabel, Steve Mauro, and Robert Schabacker. His framework focuses on reading price behaviour across daily templates and identifying how markets move through recurring cycles of expansion, contraction, and reversal. While effective, much of this analysis requires real-time interpretation of session-based behaviour, which can be demanding for traders working on lower intraday timeframes.
The TrendPredator indicators formalize parts of this methodology by introducing mechanical rules for multi-timeframe bias tracking and session structure analysis. They aim to present the key elements of the system—bias, breakouts, fakeouts, and range behaviour—in a consistent and objective way that reduces discretionary interpretation.
The Open Box indicator focuses specifically on the opening behaviour of major trading sessions. It builds on principles found in classical Open Range Breakout (ORB) techniques described by Tony Crabel, where a defined time window around the session open forms a structural reference range. Price behaviour relative to this range—breaking out, failing back inside, or expanding—can highlight developing session bias, potential trap formation, and directional conviction.
This indicator applies these concepts throughout the major equity sessions. It automatically maps the session’s initial range (“Open Box”) and tracks how price interacts with it as liquidity and volatility increase. It also incorporates related structural references such as:
* the first-hour high and low of the futures session
* the exact session open level
* an anchored VWAP starting at the session open
* automated expansion levels projected from the Open Box
In combination, these components provide a unified view of early session activity, including breakout attempts, fakeouts, VWAP reactions, and liquidity targeting. The Open Box offers a structured lens for observing how price transitions through the major sessions (Asia → London → New York) and how these behaviours relate to higher-timeframe bias defined in the broader TrendPredator framework.
Core Features
Open Box (Session Structure)
The indicator defines an initial session range beginning at the selected session open. This “Open Box” represents a fixed time window—commonly the first 30 minutes, or any user-defined duration—that serves as a structural reference for analysing early session behaviour.
The range highlights whether price remains inside the box, breaks out, or rejects the boundaries, providing a consistent foundation for interpreting early directional tendencies and recognising breakout, continuation, or fakeout characteristics.
How it works:
* At the session open, the indicator calculates the high and low over the specified time window.
* This range is plotted as the initial structure of the session.
* Price behaviour at the boundaries can illustrate emerging bias or potential trap formation.
* An optional secondary range (e.g., 15-minute high/low) can be enabled to capture early volatility with additional precision.
Inputs / Options:
* Session specifications (Tokyo, London, New York)
* Open Box start and end times (e.g., equity open + first 30 minutes, or any custom length)
* Open Box colour and label settings
* Formatting options for Open Box high and low lines
* Optional secondary range per session (e.g., 15-minute high/low)
* Forward extension of Open Box high/low lines
* Number of historic Open Boxes to display
Session VWAPs
The indicator plots VWAPs for each major trading session—Asia, London, and New York—anchored to their respective session opens. These session-specific VWAPs assist in tracking how value develops through the day and how price interacts with session-based volume distributions.
How it works:
* At each session open, a VWAP is anchored to the open price.
* The VWAP updates throughout the session as new volume and price data arrive.
* Deviations above or below the VWAP may indicate balance, imbalance, or directional control.
* Viewed together, session VWAPs help identify transitions in value across sessions.
Inputs / Options:
* Enable or disable VWAP per session
* Adjustable anchor and end times (optionally to end of day)
* Line styling and label settings
* Number of historic VWAPs to draw
First Hour High/Low Extensions
The indicator marks the high and low formed during the first hour of each session. These reference points often function as early control levels and provide context for assessing whether the session is establishing bias, consolidating, or exhibiting reversal behaviour.
How it works:
* After the session starts, the indicator records the highest and lowest prices during the first hour.
* These levels are plotted and extended across the session.
* They provide a visual reference for observing reactions, targets, or rejection zones.
Inputs / Options:
* Enable or disable for each session
* Line style, colour, and label visibility
* Number of historic sessions displayed
EQO Levels (Equity Open)
The indicator plots the opening price of each configured session. These “Equity Open” levels represent short-term reference points that can attract price early in the session.
Once the level is revisited after the Open Box has formed, it is automatically cut to avoid clutter. If not revisited, the line remains as an untested reference, similar to a naked point of control.
How it works:
* At session open, the open price is recorded.
* The level is plotted as a local reference.
* If price interacts with the level after the Open Box completes, the line is cut.
* Untested EQOs extend forward until interacted with.
Inputs / Options:
* Enable/disable per session
* Line style and label settings
* Optional extension into the next day
* Option for cutting vs. hiding on revisit
* Number of historic sessions displayed
OB Range Expansions (Automatic)
Range expansions are calculated from the height of the Open Box. These levels provide structured reference zones for identifying potential continuation or exhaustion areas within a session.
How it works:
* After the Open Box is formed, multiples of the range (e.g., 1×, 2×, 3×) are projected.
* These expansion levels are plotted above and below the range.
* Price reactions near these areas can illustrate continuation, hesitation, or potential reversal.
Inputs / Options:
* Enable or disable per session
* Select number of multiples
* Line style, colour, and label settings
* Extension length into the session
Stacey Burke 12-Candle Window Marker
The indicator can highlight the 12-candle window often referenced in Stacey Burke’s session methodology. This window represents the key active period of each session where breakout attempts, volatility shifts, and reversal signatures often occur.
How it works:
* A configurable window (default 12 candles) is highlighted from each session open.
* This window acts as a guide for observing active session behaviour.
* It remains visible throughout the session for structural context.
Inputs / Options:
* Enable/disable per session
* Configurable window duration (default: 3 hours)
* Colour and transparency controls
Concept and Integration
The Open Box is built around the same multi-timeframe logic that underpins the broader TrendPredator framework.
While higher-timeframe tools track bias and setups across the H8–D–W–M levels, the Open Box focuses on the H1–M30 domain to define session structure and observe how early intraday behaviour aligns with higher-timeframe conditions.
The indicator integrates with the TrendPredator FO (Breakout, Fakeout & Trend Switch Detector), which highlights microstructure signals on lower timeframes (M15/M5). Together they form a layered workflow:
* Higher timeframes: context, bias, and developing setups
* TrendPredator OB: intraday and intra-session structure
* TrendPredator FO: microstructure confirmation (e.g., FOL/FOH, switches)
This alignment provides a structured way to observe how daily directional context interacts with intraday behaviour.
See the public open source indicator TP FO here (click on it for access):
Practical Application
Before Session Open
* Review previous session Open Box, Open level, and VWAPs
* Assess how higher-timeframe bias aligns with potential intraday continuation or reversal
* Note untested EQO levels or VWAPs that may function as liquidity attractors
During Session Open
* Observe behaviour around the first-hour high/low and higher-timeframe reference levels
* Monitor how the M15 and 30-minute ranges close
* Track reactions relative to the session open level and the session VWAP
After the Open Box completes
* Assess price interaction with Open Box boundaries and first-hour levels
* Use microstructure signals (e.g., FOH/FOL, switches) for potential confirmation
* Refer to expansion levels as reference zones for management or target setting
After Session
* Review how price behaved relative to the Open Box, EQO levels, VWAPs, and expansion zones
* Analyse breakout attempts, fakeouts, and whether intraday structure aligned with the broader daily move
Example Workflow and Trade
1. Higher-timeframe analysis signals a Daily Fakeout Low Continuation (bullish context).
2. The New York session forms an Open Box; price breaks above and holds above the first-hour high.
3. A Fakeout Low + Switch Bar appears on M5 (via FO), after retesting the session VWAP triggering the entry.
4. 1x expansion level serves as reference targets for take profit.
Relation to the TrendPredator Ecosystem
The Open Box is part of the TrendPredator Indicator Family, designed to apply multi-timeframe logic consistently across:
* higher-timeframe context and setups
* intraday and session structure (OB)
* microstructure confirmation (FO)
Together, these modules offer a unified structure for analysing how daily and intraday cycles interact.
Disclaimer
This indicator is for educational purposes only and does not guarantee profits.
It does not provide buy or sell signals but highlights structural and behavioural areas for analysis.
Users are solely responsible for their trading decisions and outcomes.
Trapped-traders

Daily Gaps & Trapped PositionsThis script builds substantially upon the default Gaps script provided by Tradingview. Functionality was added to allow users to decide what price from the previous session is used to determine a daily gap, added support for showing gaps across all timeframes up to the daily time frame, and also allow gaps to be shown even with ETH enabled on the chart. This script provides support across normal securities, futures, and also crypto.
Users can decide between the following selections to determine if a daily gap has formed:
- Previous Session Close
- Previous Session High/Low
- Last RTH Candle High/Low
The other larger piece that was added is something called trapped positions or what some folks familiar with Market Profile would call "single prints". They could also be considered FVGs but they are a specific subset of FVGs as these must from above or below the current session's high/low.
Single prints form above or below a current session's high/low and can be considered an area where price has moved too fast in that area and price will most likely return to these areas at a later point in time. In some teachings, these are also looked at as "trapped shorts" (lighter blue box color) or "trapped supply" (yellow orange box color) which creates an area where there will be potential support (trapped shorts) or resistance (trapped supply) when this area is revisited in the future. Adding these to your chart will simply provide additional areas of interest where you may see buying or selling.
Both gaps and trapped positions have the following options:
- Show only active gaps/trapped positions. Selecting this will only show areas where price has not completely traded through the box.
- Close gaps/trapped positions partially. If this is selected, it will reduce the box size as price is traded through the area. If it is not selected, the box will only disappear once price has traded through the entire box completely.
There are some additional settings that allow you to tailor how many boxes show up on the chart. These settings are as follows:
- Max number of boxes. This setting will only plot up to this number of gaps/trapped positions.
- Minimum Deviation. This will prevent gaps/trapped positions from showing if they are too small relative to average across that last 14 periods.
- Limit Max Box Trail Length (bars). If checkbox is selected, the box will stop being extended after X number of bars given in this input.

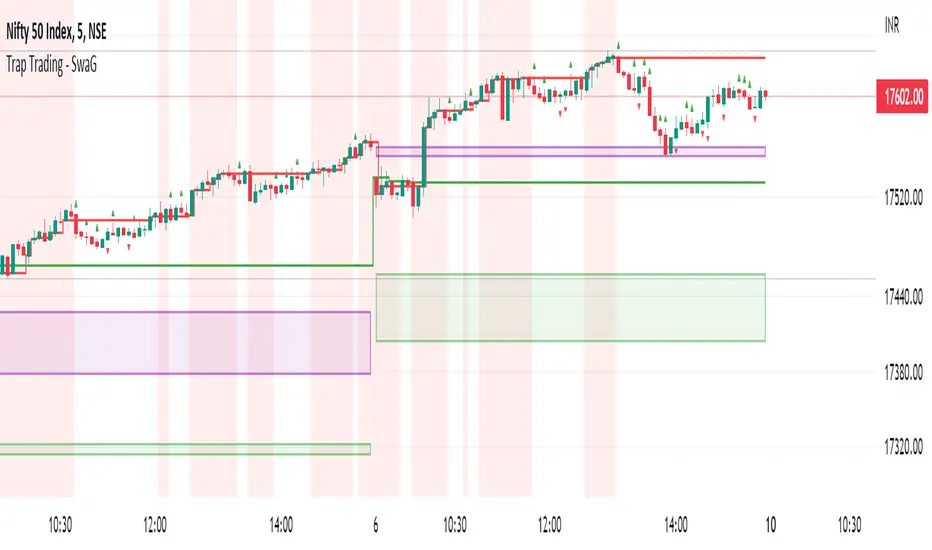
Trap Trading - SwaGThis is an intraday indicator
Set timeframe to 5 min
Take long entry on the high brakes of selling traps
Take short entry on the low brakes of buying traps
ignore traps left to red zones
Use the nearest trap
take profit/loss on a 1:2 risk-to-reward basis.
Trap Trading
Trap trading is a trading strategy that seeks to profit from false breakouts in financial markets. This strategy is based on the idea that when the market breaks through a key level of support or resistance, many traders will take that as a signal to enter or exit trades, causing the price to move further in the breakout direction.
However, in some cases, the market will quickly reverse course and move in the opposite direction, trapping those traders who entered the trade based on the breakout. This can create a trading opportunity for those who are able to identify the false breakout and trade in the opposite direction.
The trap trading strategy typically involves identifying a key level of support or resistance on a price chart and then waiting for the market to break through that level. If the price continues to move in the breakout direction, the trader may enter a trade in that direction with a stop loss set just below the breakout level.
However, if the market quickly reverses and moves back below the breakout level, the trader may enter a trade in the opposite direction with a stop loss set just above the breakout level. The idea is to take advantage of the trapped traders who entered the trade based on the false breakout, and profit from the market's reversal.
As with any trading strategy, there are risks and potential drawbacks to trap trading. False breakouts can be difficult to identify, and there is always the risk that the market will continue to move in the breakout direction, resulting in losses for the trader. Additionally, trap trading requires a solid understanding of technical analysis and market trends, which may take time and experience to develop.
Super OrderBlock / FVG / BoS Tools by makuchaku & eFeThis super indicator is a Swiss army knife for Smart Money traders for OrderBlocks / FVG / BoS
It provides many options for drawing (non-repainting) boxes for OrderBlocks, Fair Value Gaps (FVG) and Break of Structures. The boxes are extended into the future, until the first retest/mitigation.
Some of the additional options (not explained in the diagrams above)
PPDD OB : An order block which is formed after interacting with Liquidity (old low/high, fractal low/high, etc). Since these OB's are in the most premium or most discount, they are Premium Premium Discount Discount OB's (PPDD OB)
HVB Bars : When the volume of any bar is higher than the average volume of last N bars, it could mean something important (in the right context). Hence, the indicator allows for coloring them differently.
This indicator was built as a collaboration between @makuchaku & eFe
Pro tip : This indicator is a simply a tool to visualize trading concepts on the candle stick chart. It is the job of the trader to sequence these effectively into a profitable trade.
If you come across any bug or have a question on how to effectively use the indicator, please don't hesitate to ask questions.
Good luck & good trading!

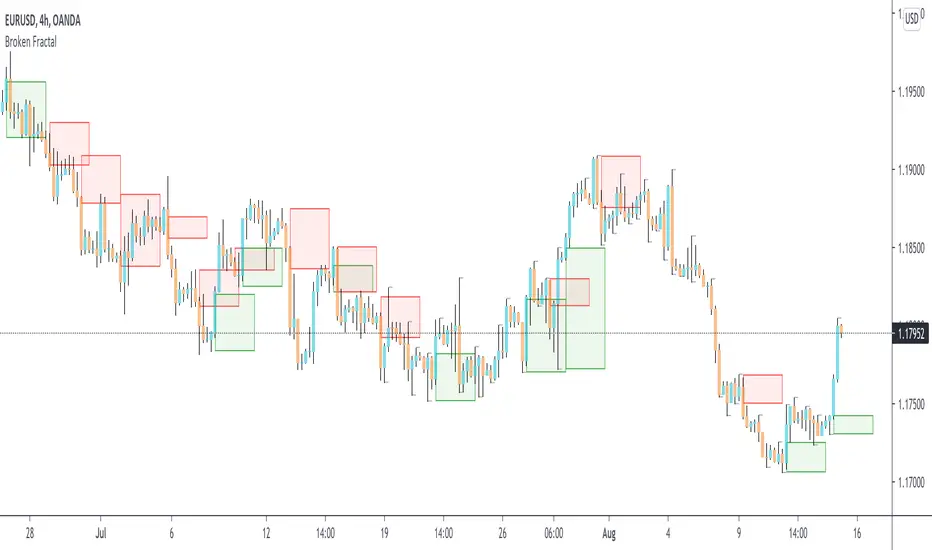
Broken Fractal : Someone's broken dream is your profit!Idea
The idea is simple : when market turns around, it traps a bunch of traders off guard. We trade with them, in the same direction of their exit!
Method
We let the market first create a fractal
We then let the market create an opposite fractal
We then let the market break the first fractal it created, thereby trapping lots of trades in the process
We then patiently wait till the market gives these trapped traders a chance to exit - and we trade in the same direction
How to use?
Green boxes are for long entry, red boxes are for short.
Whenever a box appears, that's the risk criteria - setup limit orders and trade along!
Works on all timeframes
If you like this script, please leave a note on how you are using it.
I personally use it with Higher Timeframe bias.
PS1 : some traders call this Break of market structure, some call it Breaker, I just call it "Broken Fractal"
PS2 : Break of a broken fractal is also very potent. Watch out for those!