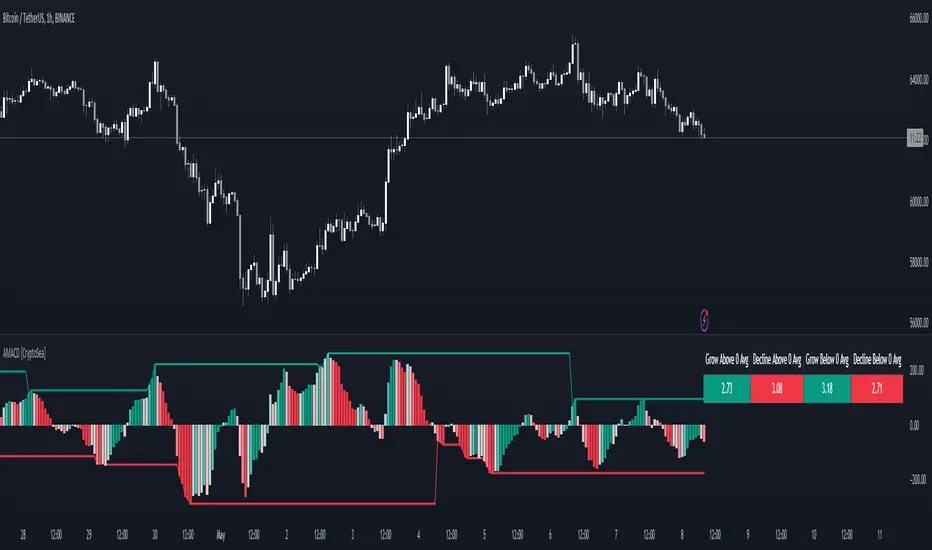
Advanced MACD [CryptoSea]Advanced MACD (AMACD) enhances the traditional MACD indicator, integrating innovative features for traders aiming for deeper insights into market momentum and sentiment. It's crafted for those seeking to explore nuanced behaviors of the MACD histogram, thus offering a refined perspective on market dynamics.
Divergence moves can offer insight into continuation or potential reversals in structure, the example below is a clear continuation signal.
Key Features
Enhanced Histogram Analysis: Precisely tracks movements of the MACD histogram, identifying growth or decline periods, essential for understanding market momentum.
High/Low Markers: Marks the highest and lowest points of the histogram within a user-defined period, signaling potential shifts in the market.
Dynamic Averages Calculation: Computes average durations of histogram phases, providing a benchmark against historical performance.
Color-Coded Histogram: Dynamically adjusts the histogram's color intensity based on the current streak's duration relative to its average, offering a visual cue of momentum strength.
Customisable MACD Settings: Enables adjustments to MACD parameters, aligning with individual trading strategies.
Interactive Dashboard: Showcases an on-chart table with average durations for each phase, aiding swift decision-making.
Settings & Customisation
MACD Settings: Customise fast length, slow length, and signal smoothing to tailor the MACD calculations to your trading needs.
Reset Period: Determine the number of bars to identify the histogram's significant high and low points.
Histogram High/Lows: Option to display critical high and low levels of the histogram for easy referencing.
Candle Colours: Select between neutral or traditional candle colors to match your analytical preferences.
When in strong trends, you can use the average table to determine when to look to get into a position. This example we are in a strong downtrend, we then see the histogram growing above the average in these conditions which is where we should look to get into a shorting position.
Strategic Applications
The AMACD serves not just as an indicator but as a comprehensive analytical tool for spotting market trends, momentum shifts, and potential reversal points. It's particularly useful for traders to:
Spot Momentum Changes Utilise dynamic coloring and streak tracking to alert shifts in momentum, helping anticipate market movements.
Identify Market Extremes Use high and low markers to spot potential market turning points, aiding in risk management and decision-making.
Alert Conditions
Above Average Movement Alerts: Triggered when the duration of the MACD histogram's growth or decline is unusually long, these alerts signal sustained momentum:
Above Zero: Alerts for both growing and declining movements above zero, indicating either continued bullish trends or potential bearish reversals.
Below Zero: Alerts for growth and decline below zero, pointing to potential bullish reversals or confirmed bearish trends.
High/Low Break Alerts: Activated when the histogram reaches new highs or falls to new lows beyond the set thresholds, these alerts are crucial for identifying shifts in market dynamics:
Break Above Last High: Indicates a potential upward trend as the histogram surpasses recent highs.
Break Below Last Low: Warns of a possible downward trend as the histogram drops below recent lows.
These alert conditions enable traders to automate part of their market monitoring or potential to automate the signals to take action elsewhere.
Trendanalyisis
Relative Strength Universal
Relative strength is a ratio between two assets, generally it is a stock and a market average (index). RS implementation details are explained here .
This script automatically decides benchmark index for RS calculation based on market cap input values and input benchmark indices values.
Relative strength calculation:
"To calculate the relative strength of a particular stock, divide the percentage change over some time period by the percentage change of a particular index over the same time period". This indicator value oscillates around zero. If the value is greater than zero, the investment has been relatively strong during the selected period; if the value is less than zero, the investment has been relatively weak.
In this script, You can input market cap values and all are editable fields. If company market cap value is grater than 75000(Default value) then stock value will be compared with Nifty index. If company market cap is between 75000 and 25000 then stock value will be compared with midcap 150 to calculate RS. If marketcap is greater than 5000 and less than 25000 then RS will be calculated based on smallcap250. If marketcap is less than 5000 and greater than 500 then it will be compared with NIFTY_MICROCAP250

RSI Volatility Bands [QuantraSystems]RSI Volatility Bands
Introduction
The RSI Volatility Bands indicator introduces a unique approach to market analysis by combining the traditional Relative Strength Index (RSI) with dynamic, volatility adjusted deviation bands. It is designed to provide a highly customizable method of trend analysis, enabling investors to analyze potential entry and exit points in a new and profound way.
The deviation bands are calculated and drawn in a manner which allows investors to view them as areas of dynamic support and resistance.
Legend
Upper and Lower Bands - A dynamic plot of the volatility-adjusted range around the current price.
Signals - Generated when the RSI volatility bands indicate a trend shift.
Case Study
The chart highlights the occurrence of false signals, emphasizing the need for caution when the bands are contracted and market volatility is low.
Juxtaposing this, during volatile market phases as shown, the indicator can effectively adapt to strong trends. This keeps an investor in a position even through a minor drawdown in order to exploit the entire price movement.
Recommended Settings
The RSI Volatility Bands are highly customisable and can be adapted to many assets with diverse behaviors.
The calibrations used in the above screenshots are as follows:
Source = close
RSI Length = 8
RSI Smoothing MA = DEMA
Bandwidth Type = DEMA
Bandwidth Length = 24
Bandwidth Smooth = 25
Methodology
The indicator first calculates the RSI of the price data, and applies a custom moving average.
The deviation bands are then calculated based upon the absolute difference between the RSI and its moving average - providing a unique volatility insight.
The deviation bands are then adjusted with another smoothing function, providing clear visuals of the RSI’s trend within a volatility-adjusted context.
rsiVal = ta.rsi(close, rsiLength)
rsiEma = ma(rsiMA, rsiVal, bandLength)
bandwidth = ma(bandMA, math.abs(rsiVal - rsiEma), bandLength)
upperBand = ma(bandMA, rsiEma + bandwidth, smooth)
lowerBand = ma(bandMA, rsiEma - bandwidth, smooth)
long = upperBand > 50 and not (lowerBand < lowerBand and lowerBand < 50)
short= not (upperBand > 50 and not (lowerBand < lowerBand and lowerBand < 50))
By dynamically adjusting to market conditions, the RSI trend bands offer a unique perspective on market trends, and reversal zones.

Candlesticks Patterns [TradingFinder] Pin Bar Hammer Shooting🔵 Introduction
Truly, the title "TradingView" doesn't do justice to this excellent website, and that's why I've written about its crucial aspect. In this indicator, the identification of all candlesticks known as "Pin bars" is explored.
These candlesticks include the following:
- Hammer : A Pin bar formed at the end of a bearish trend, with its body being either bearish or bullish.
- Shooting Star : Formed at the end of a bullish trend, with its body being either bearish or bullish.
- Hanging Man : Formed during an upward trend, characterized by a candle with a lower shadow.
- Inverted Hammer : Formed during a downward trend, characterized by a candle with an upper shadow.
🟣 Important : For ease of use, we refer to these four candlestick patterns as Pin Bars and categorize them into the main friends "Bullish" and "Bearish."
🟣 Important : In all sources, Hanging Man and Inverted Hammer are referred to as "Reversal candles." However, in reality, whenever they appear after breaking a significant area (Break Out), we expect these candles to signal a continuation of the trend and confirmation in the direction of the trend.
🟣 Important : One of the best signs of market manipulation and entry by market giants is the "Ice Berg." So, it provides one of the best trading opportunities.
🔵 Reason for Creation
Many traders, especially volume traders, use Pin bars as confirmation and enter the market after their occurrence. In this indicator, all four patterns are identified and displayed in a colored candle format, using "triangle" and "circle."
When they are evident on the chart, directly or by drawing a horizontal line, they give us good alerts for reversal or continuation areas.
🔵 Information Table
1. Red circle: Pin bars formed in a downtrend.
2. Blue circle: Bullish Pin bars formed in an uptrend.
3. Black triangle: Bearish Pin bar candle in an uptrend.
4. Blue triangle: Bullish Pin bar candle in a downtrend.
🔵 Settings
Trend Detection Period: A special feature that considers smaller or larger fluctuations. If individual price waves need to be considered, use lower numbers; if the overall trend direction is desired, use larger numbers (e.g., 5-7 or higher). This precisely sets the Zigzag or Pivot format, not displayed but considered in the indicator calculation.
Trend Effect : By changing the Trend Effect status to "Off," all Pin bars, whether bullish or bearish, are displayed regardless of the current market trend. If the status remains "On," only Pin bars in the direction of the main market trend are shown.
🟣 Important : Black triangles "Number 3" and blue triangles "Number 4" displayed in the information table section, as explained in the "Information Table" section.
Show Bullish Pin Bar : When set to "Yes," displays bullish Pin bars; when set to "No," does not display them.
Show Bearish Pin Bar : When set to "Yes," allows the display of bearish Pin bars; when set to "No," does not display them.
Bullish Pin Bar Setting : Using the "Ratio Lower Shadow to Body" and "Ratio Lower Shadow to Higher Shadow" settings, you can customize your bullish Pin bar candles. Larger numbers impose stricter conditions for identifying bullish Pin bars.
Bearish Pin Bar Setting : Using the "Ratio Higher Shadow to Body" and "Ratio Higher Shadow to Lower Shadow" settings, you can customize your bearish Pin bar candles. Larger numbers impose stricter conditions for identifying bearish Pin bars.
Show Info Table : Allows the display or non-display of the information table (located at the bottom of the page and on the right side).
🔵 How to Use
At the end of a downtrend, look for "Hammer" candles, easily identified one by one.
To identify the "Shooting Star" candle pattern at the end of an uptrend; expect a price reversal in the downtrend.
For trades in the downward direction, wait for the formation of an "Inverted Hammer" Pin bar.
And finally, in an uptrend, where a "Hanging Man" candle can form.
🔵 Features
For better visualization, triangles and circles are used above the candles, but they can be easily removed. All Pin bars are displayed in color with the following meanings:
- Black-bodied candle: Inverted Hammer
- Turquoise blue candle: Hammer
- Pink candle: Hanging Man
- Red candle: Shooting Star
🟣 Important : The capability to detect the powerful two-candle pattern "Tweezer Top" at the end of an uptrend emerges by forming two "Shooting Star" candles side by side.
Similarly, the two-candle pattern "Tweezer Bottom" is created at the end of a downtrend with the formation of two "Hammer" candles side by side. To identify the "Tweezer" pattern, make sure the settings in the "Trend Effect" section are set to "Off."
🟣 Auxiliary Indicators
During the start of trading sessions such as Asia, London, and New York, where the highest liquidity exists, alongside this indicator, you can use the Trading Sessions indicator.
Sessions
The combination of Order Blocks "-OB" and "+OB" with candles is one of the best trading methods. The indicator that identifies order blocks, along with this indicator, can yield remarkable results in the success of Pin bar candles.
Order Blocks Finder
The trading toolset "TFlab" presents this indicator. To benefit from all indicators, we invite you to visit our page " TFlab Scripts ".

Order Blocks Finder [TradingFinder] Major OB | Supply and Demand🔵 Introduction
Drawing all order blocks on the path, especially in range-bound or channeling markets, fills the chart with lines, making it confusing rather than providing the trader with the best entry and exit points.
🔵 Reason for Indicator Creation
For traders familiar with market structure and only need to know the main accumulation points (best entry or exit points), and primary order blocks that act as strong sources of power.
🟣 Important Note
All order blocks, both ascending and descending, are identified and displayed on the chart when the structure of "BOS" or "CHOCH" is broken, which can also be identified with "MSS."
🔵 How to Use
When the indicator is installed, it plots all order blocks (active order blocks) and continues until the price reaches them. This continuation happens in boxes to have a better view in the TradingView chart.
Green Range : Ascending order blocks where we expect a price increase in these areas.
Red Range : Descending order blocks where we expect a price decrease in these areas.
🔵 Settings
Order block refine setting : When Order block refine is off, the supply and demand zones are the entire length of the order block (Low to High) in their standard state and cannot be improved. If you turn on Order block refine, supply and demand zones will improve using the error correction algorithm.
Refine type setting : Improving order blocks using the error correction algorithm can be done in two ways: Defensive and Aggressive. In the Aggressive method, the largest possible range is considered for order blocks.
🟣 Important
The main advantage of the Aggressive method is minimizing the loss of stops, but due to the widening of the supply or demand zone, the reward-to-risk ratio decreases significantly. The Aggressive method is suitable for individuals who take high-risk trades.
In the Defensive method, the range of order blocks is minimized to their standard state. In this case, fewer stops are triggered, and the reward-to-risk ratio is maximized in its optimal state. It is recommended for individuals who trade with low risk.
Show high level setting : If you want to display major high levels, set show high level to Yes.
Show low level setting : If you want to display major low levels, set show low level to Yes.
🔵 How to Use
The general view of this indicator is as follows.
When the price approaches the range, wait for the price reaction to confirm it, such as a pin bar or divergence.
If the price passes with a strong candle (spike), especially after a long-range or at the beginning of sessions, a powerful event is happening, and it is outside the credibility level.
An Example of a Valid Zone
An Example of Breakout and Invalid Zone. (My suggestion is not to use pending orders, especially when the market is highly volatile or before and after news.)
After reaching this zone, expect the price to move by at least the minimum candle that confirmed it or a price ceiling or floor.
🟣 Important : These factors can be more accurately measured with other trend finder indicators provided.
🔵 Auxiliary Tools
There is much talk about not using trend lines, candlesticks, Fibonacci, etc., in the web space. However, our suggestion is to create and use tools that can help you profit from this market.
• Fibonacci Retracement
• Trading Sessions
• Candlesticks
🔵 Advantages
• Plotting main OBs without additional lines;
• Suitable for timeframes M1, M5, M15, H1, and H4;
• Effective in Tokyo, Sydney, and London sessions;
• Plotting the main ceiling and floor to help identify the trend.

Squeeze Momentum TD - A Revisited Version of the TTM SqueezeDescription:
The "Squeeze Momentum TD" is our unique take on the highly acclaimed TTM Squeeze indicator, renowned in the trading community for its efficiency in pinpointing market momentum. This script is a tribute and an extension to the foundational work laid by several pivotal figures in the trading industry:
• John Carter, for his creation of the TTM Squeeze and TTM Squeeze Pro, which revolutionized the way traders interpret volatility and momentum.
• Lazybear, whose original interpretation of the TTM Squeeze, known as the "Squeeze Momentum Indicator", provided an invaluable foundation for further development.
• Makit0, who evolved Lazybear's script to incorporate enhancements from the TTM Squeeze Pro, resulting in the "Squeeze PRO Arrows".
Our script, "Squeeze Momentum TD", represents a custom version developed after reviewing all variations of the TTM Squeeze indicator. This iteration focuses on a distinct visualization approach, featuring an overlay band on the chart for an user-friendly experience. We've distilled the essence of the TTM Squeeze and its advanced version, the TTM Squeeze Pro, into a form that emphasizes intuitive usability while retaining comprehensive analytical depth.
Features:
-Customizable Bollinger Bands and Keltner Channels: These core components of the TTM Squeeze.
-Dynamic Squeeze Conditions: Ranging from No Squeeze to High Compression.
-Momentum Oscillator: A linear regression-based momentum calculation, offering clear insights into market trends.
-User-Defined Color Schemes: Personalize your experience with adjustable colors for bands and plot shapes.
-Advanced Alert System: Alerts for key market shifts like Bull Watch Out, Bear Watch Out, and Momentum shifts.
-Adaptive Band Widths: Modify the band widths to suit your preference.
How to use it?
• Transition from Light Green to Dark Green: Indicates a potential end to the bullish momentum. This 'Bull Watch Out' signal suggests that traders should be cautious about continuing bullish trends.
• Transition from Light Red to Dark Red: Signals that the bearish momentum might be fading, triggering a 'Bear Watch Out' alert. It's a hint for traders to be wary of ongoing bearish trends.
• Shift from Dark Green to Light Green: This change suggests an increase in bullish momentum. It's an indicator for traders to consider bullish positions.
• Change from Dark Red to Light Red: Implies that bearish momentum is picking up. Traders might want to explore bearish strategies under this condition.
• Rapid Change from Light Red to Light Green: This swift shift indicates a quick transition from bearish to bullish sentiment. It's a strong signal for traders to consider switching to bullish positions.
• Quick Shift from Light Green to Light Red: Demonstrates a speedy change from bullish to bearish momentum. It suggests that traders might want to adjust their strategies to align with the emerging bearish trend.
Acknowledgements:
Special thanks to Beardy_Fred for the significant contributions to the development of this script. This work stands as a testament to the collaborative spirit of the trading community, continuously evolving to meet the demands of diverse trading strategies.
Disclaimer:
This script is provided for educational and informational purposes only. Users should conduct their own due diligence before making any trading decisions.

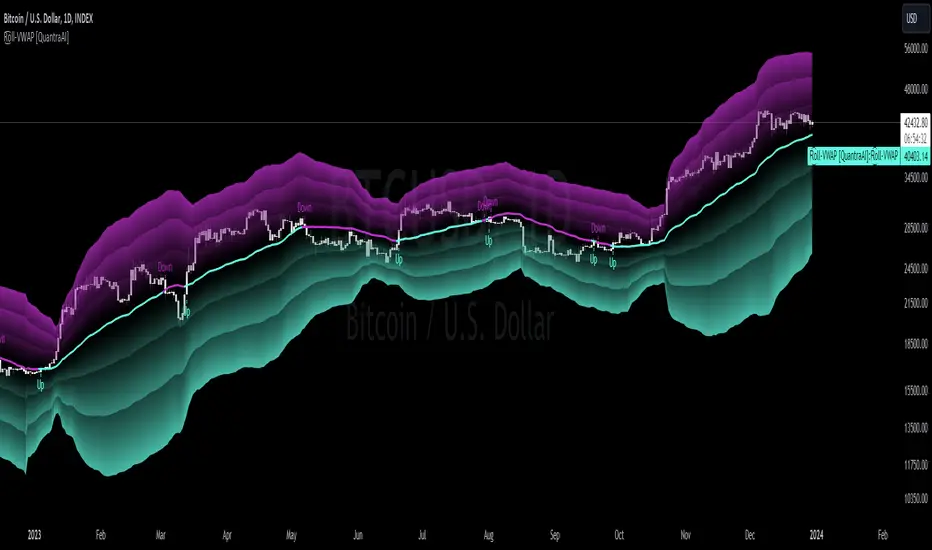
Rolling VWAP [QuantraSystems]Rolling VWAP
Introduction
The Rolling VWAP (R͜͡oll-VWAP) indicator modernizes the traditional VWAP by recalculating continuously on a rolling window, making it adept at pinpointing market trends and breakout points.
Its dual functionality includes both the dynamic rolling VWAP and a customizable anchored VWAP, enhanced by color-coded visual cues, thereby offering traders valuable flexibility and insight for their market analysis.
Legend
In the Image you can see the BTCUSD 1D Chart with the R͜͡oll-VWAP overlay.
You can see the individually activatable Standard Deviation (SD) Bands and the main VWAP Line.
It also features a Trend Signal which is deactivated by default and can be enabled if required.
Furthermore you can find the coloring of the VWAP line to represent the Trend.
In this case the trend itself is defined as:
Close being greater than the VWAP line -> Uptrend
Close below the VWAP line -> Downtrend
Notes
The R͜͡oll-VWAP can be used in a variety of ways.
Volatility adjusted expected range
This aims to identify in which range the asset is likely to move - according to the historical values the SD Bands are calculated and thus their according probabilities displayed.
Trend analysis
Trending above or below the VWAP shows up or down trends accordingly.
S/R Levels
Based on the probability distribution the 2. SD often works as a Resistance level and either mid line or 1. SD lines can act as S/R levels
Unsustainable levels
Based on the probability distributions a SD level of beyond 2.5, especially 3 and higher is hit very seldom and highly unsustainable.
This can either mean a mean reversion state or a momentum slowdown is necessary to get back to a sustainable level.
Please note that we always advise to find more confluence by additional indicators.
Traders are encouraged to test and determine the most suitable settings for their specific trading strategies and timeframes.
Methodology
The R͜͡oll-VWAP is based on the inbuilt TV VWAP.
It expands upon the limitations of having an anchored timeframe and thus a limited data set that is being reset constantly.
Instead we have integrated a rolling nature that continuously calculates the VWAP over a customizable lookback.
To also keep the base utility it is possible to use the anchored timeframes as well.
Furthermore the visualization has been improved and we added the coloring of the main VWAP line according to the Trend as stated above.
The applicable Trend signals are also part of that.
The parameter settings and also the visualizations allow for ample customizations by the trader.
For questions or recommendations, please feel free to seek contact in the comments.
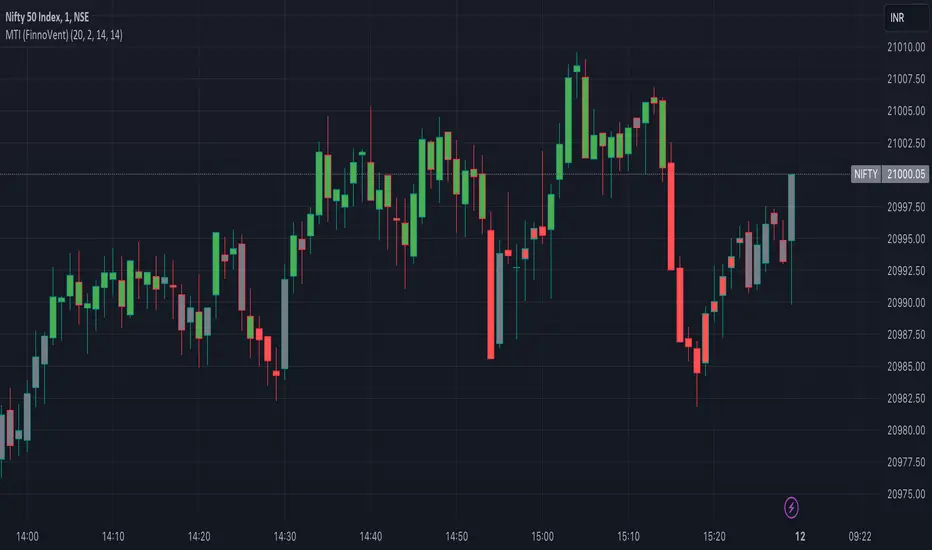
Market Trend Indicator (FinnoVent)The Market Trend Indicator (FinnoVent) is a comprehensive trading tool designed to provide clear visual cues for market trends on TradingView charts. This indicator combines the principles of Exponential Moving Averages (EMAs), Bollinger Bands, the Average Directional Index (ADX), and the Relative Strength Index (RSI) to offer a nuanced view of market movements.
How It Works:
Trend Identification with EMAs: The indicator uses two EMAs (3-period and 30-period) to identify the primary trend. An upward trend is signaled when the 3-period EMA crosses above the 30-period EMA, while a downward trend is indicated when the 3-period EMA crosses below the 30-period EMA.
Sideways Market Detection: To identify sideways trends, the indicator employs Bollinger Bands, ADX, and RSI. A sideways (or consolidating) market condition is identified when:
The price is between the middle 60% of the Bollinger Bands (avoiding the top and bottom 20%).
The ADX is below 30, indicating a lack of a strong trend.
The RSI is between 40 and 60, suggesting a neutral market momentum.
Visual Representation:
Bar Colors: The indicator colors the price bars on the chart based on the identified trend:
Green Bars: Indicate an upward trend.
Red Bars: Indicate a downward trend.
Grey Bars: Indicate a sideways or consolidating market.
How to Use:
Trend Following: Use the colored bars as a guide for trend following. Green bars suggest a potential entry for a long position, while red bars may indicate opportunities for short positions.
Sideways Market Caution: Grey bars signal a sideways market. In such conditions, traders might exercise caution and avoid trend-following strategies, as the market lacks a clear direction.
Complementary Analysis: While the Market Trend Indicator (FinnoVent) provides valuable insights, it's recommended to use it in conjunction with other forms of analysis (like fundamental analysis, other technical indicators, or price action) for comprehensive decision-making.
Suitable for: This indicator is versatile and can be applied to various timeframes and trading instruments, including stocks, forex, commodities, and indices.
Important Notes:
The indicator is designed to minimize repainting but always consider the latest data for the most accurate analysis.
Like all indicators, it is not foolproof. It works best when combined with a solid trading plan and risk management strategies.
Channel CorridorOVERVIEW
The Channel Corridor indicator is designed to operate on a log chart of asset prices (e.g., BTCUSD), specifically on a weekly timeframe.
The intent of the indicator is to provide a visual representation of market dynamics, focusing on a dynamically adjusted corridor around a Simple Moving Average (SMA) of an asset's price. The corridor adapts to changing market conditions. The indicator includes channels within the corridor for additional reference points.
PURPOSE
Trend Identification: The channel corridor can aid in visualising the overall trend, as it dynamically adjusts the corridor based on an SMA and user-defined parameters.
Volatility Assessment: The width of the channel corridor can may act as a gauge of market volatility.
Reversal Points: The channel corridor may signal potential trend reversals or corrections when an asset price approaches the upper or lower bounds of the corridor.
Long-Term Trend Analysis: The channel corridor may aid in longer-term trend analysis.
CONSIDERATIONS
Validation: It's recommended that careful back-testing over historical data be done before acting on any identified opportunities.
User Discretion: Trading decisions should not rely solely on this script. Users should exercise judgment and consider market conditions.
CREDIT
Ideation: Thanks @Sw1ngTr4der for the idea and corridor seed code

Consecutive Higher/Lower ClosingsThe Consecutive Higher/Lower Closings indicator is a powerful tool designed to assist traders in identifying potential buy and sell signals based on consecutive higher or lower closing prices. This indicator provides users with the flexibility to specify the number of consecutive higher or lower closings required to trigger a signal, allowing for a customizable trading strategy.
Key Features:
Customizable Parameters: Users can define the number of consecutive higher and lower closings needed to generate buy and sell signals, providing a tailored approach to trading.
Clear Buy and Sell Signals: The indicator plots clear buy and sell signals directly on the chart, making it easy for traders to identify potential entry and exit points.
Usage:
Consecutive Higher Closings (Buy Signal): When the current closing price is higher than the previous closing price for the specified number of consecutive periods (as defined by the user), a buy signal will be generated.
Consecutive Lower Closings (Sell Signal): When the current closing price is lower than the previous closing price for the specified number of consecutive periods (as defined by the user), a sell signal will be generated.
How to Use:
Apply the Consecutive Higher/Lower Closings indicator to your chart.
Adjust the input parameters, consecutiveHigherClosings and consecutiveLowerClosings, to match your preferred trading strategy. These parameters determine the number of consecutive higher and lower closings needed to trigger signals.
Interpret the buy and sell signals generated by the indicator. When a buy signal is displayed (green triangle up), it suggests a potential entry point. Conversely, a sell signal (red triangle down) indicates a potential exit point.
Important Note:
This indicator is designed to assist traders in making informed decisions, but it should be used in conjunction with other technical analysis tools and risk management strategies for a comprehensive trading approach.
Kindly be aware that this strategy is most effective with Monster stocks with smooth price action, particularly when analyzing in weekly and/or daily timeframe.
Disclaimer:
Trading involves risk, and past performance does not guarantee future results. Always conduct thorough research and consider your risk tolerance before making trading decisions.
Predictive Trend and Structure (Expo)█ Overview
The Predictive Trend and Structure indicator is designed for traders seeking to identify future trend directions and interruptions in trend continuation. This indicator is unique because it employs standard deviation to predict upcoming trend directions and potential trend continuation levels. This enables traders to stay ahead of the market.
█ How It Works
This indicator primarily functions based on the calculated standard deviation of the trend over a specified period. It evaluates the trend direction by comparing the current trend value to its previous one and scales the standard deviation, allowing for adjustments in sensitivity to price fluctuations.
█ How to Use
Trend
You can easily identify when a future trend begins by observing where the trend level is displayed. If the price breaks above and remains above the trend, it indicates a bullish trend. Conversely, if the price breaks below and stays below, it signifies a bearish trend.
Support and Resistance
With the Predictive Structure enabled, the indicator aids in identifying potential support and resistance levels.
Trend Continuation Break
Trend continuation breaks occur when prices breaks support or resistance, indicating the existing trend may persist. The indicator plots these levels in advance, allowing traders to quickly identify where trend continuation might occur.
█ Settings
Period for Std Dev: Determines the number of periods used for the standard deviation calculation, impacting the indicator's sensitivity to price changes.
Standard Deviation Scaler: Scales the computed standard deviation, affecting the deviations needed to confirm trends and the indicator's focus on significant trend changes.
Predictive Structure: Enables or disables the prediction of market structures like potential levels of structure breaks/trend continuation breaks.
-----------------
Disclaimer
The information contained in my Scripts/Indicators/Ideas/Algos/Systems does not constitute financial advice or a solicitation to buy or sell any securities of any type. I will not accept liability for any loss or damage, including without limitation any loss of profit, which may arise directly or indirectly from the use of or reliance on such information.
All investments involve risk, and the past performance of a security, industry, sector, market, financial product, trading strategy, backtest, or individual's trading does not guarantee future results or returns. Investors are fully responsible for any investment decisions they make. Such decisions should be based solely on an evaluation of their financial circumstances, investment objectives, risk tolerance, and liquidity needs.
My Scripts/Indicators/Ideas/Algos/Systems are only for educational purposes!

RSRS (Resistance Support Relative Strength)The Resistance Support Relative Strength (RSRS) indicator, published by Everbright Securities, is a technical analysis tool that enjoys immense popularity among Chinese quantitative traders, owing to its stellar performance in China's stock markets.
🟠 Principle
The indicator treats daily highs and lows as resistance and support levels respectively. It measures market strength by comparing the magnitude of price changes in daily highs versus lows. Specifically, it fits a linear regression model to the (low, high) data points over the past N days (typically 18) and uses the slope (beta) as the RSRS value. A steeper slope indicates stronger market strength.
🟠 Algorithm
1. Collect the daily low and high prices over the past N days.
2. Apply Ordinary Least Squares to estimate the linear regression model: high = alpha + beta * low. The beta is the RSRS value.
3. Compute the z-score of the RSRS over the past M days (typically 600).
4. Compare the z-score to preset buy and sell thresholds (typically 0.7 and -0.7) to generate trading signals. If z-score > buy threshold, a buy signal is triggered. If z-score < sell threshold, a sell signal is triggered.

Bitcoin wave modelBitcoin wave model is based on the logarithmic regression model and the sinusoidal waves, induced by the halving events.
This chart presents the outcome of an in-depth analysis of the complete set of Bitcoin price data available from October 2009 to August 2023.
The central concept is that the logarithm of the Bitcoin price closely adheres to the logarithmic regression model. If we plot the logarithm of the price against the logarithm of time, it forms a nearly straight line.
The parameters of this model are provided in the script as follows: log (BTCUSD) = 1.48 + 5.44log(h).
The secondary concept involves employing the inherent time unit of Bitcoin instead of days:
'h' denotes a slightly adjusted time measurement intrinsic to the Bitcoin blockchain. It can be approximated as (days since the genesis block) * 0.0007. Precisely, 'h' is defined as follows: h = 0 at the genesis block, h = 1 at the first halving block, and so forth. In general, h = block height / 210,000.
Adjustments are made to account for variations in block creation time.
The third concept revolves around investigating halving waves triggered by supply shock events resulting from the halvings. These halvings occur at regular intervals in Bitcoin's native time 'h'. All halvings transpire when 'h' is an integer. These events induce waves with intervals denoted as h = 1.
Consequently, we can model these waves using a sin(2pih - a) function. The parameter determining the time shift is assessed as 'a = 0.4', aligning with earlier expectations for halving events and their subsequent outcomes.
The fourth concept introduces the notion that the waves gradually diminish in amplitude over the progression of "time h," diminishing at a rate of 0.7^h.
Lastly, we can create bands around the modeled sinusoidal waves. The upper band is derived by multiplying the sine wave by a factor of 3.1*(1-0.16)^h, while the lower band is obtained by dividing the sine wave by the same factor, 3.1*(1-0.16)^h.
The current bandwidth is 2.5x. That means that the upper band is 2.5 times the lower band. These bands are forming an exceptionally narrow predictive channel for Bitcoin. Consequently, a highly accurate estimation of the peak of the next cycle can be derived.
The prediction indicates that the zenith past the fourth halving, expected around the summer of 2025, could result in prices ranging between 200,000 and 240,000 USD.
Enjoy the mathematical insights!

Traders Trend DashboardThe Traders Trend Dashboard (TTD) is a comprehensive trend analysis tool designed to assist traders in making informed trading decisions across various markets and timeframes. Unlike conventional trend-following scripts, TTD goes beyond simple trend detection by incorporating a unique combination of moving averages and a visual dashboard, providing traders with a clear and actionable overview of market trends. Here's how TTD stands out from the crowd:
Originality and Uniqueness:
TTD doesn't rely on just one moving average crossover to detect trends. Instead, it employs a dynamic approach by comparing two moving averages of distinct periods across multiple timeframes. This innovative methodology enhances trend detection accuracy and reduces false signals commonly associated with single moving average systems.
Market Applicability:
TTD is versatile and adaptable to various financial markets, including forex, stocks, cryptocurrencies, and commodities. Its flexibility ensures that traders can utilize it across different asset classes and capitalize on market opportunities.
Optimal Timeframe Utilization:
Unlike many trend indicators that work best on specific timeframes, TTD caters to traders with diverse trading preferences. It offers support for intraday trading (1m, 3m, 5m), short-term trading (15m, 30m, 1h), and swing trading (4h, D, W, M), making it suitable for a wide range of trading styles.
Underlying Conditions and Interpretation:
TTD is particularly effective during trending markets, where its multi-timeframe approach helps identify consistent trends across various time horizons. In ranging markets, TTD can indicate potential reversals or areas of uncertainty when moving averages converge or cross frequently.
How to Use TTD:
1. Timeframe Selection: Choose the relevant timeframes based on your trading style and preferences. Enable or disable timeframes in the settings to focus on the most relevant ones for your strategy.
2. Dashboard Interpretation: The TTD dashboard displays green (🟢) and red (🔴) symbols to indicate the relationship between two moving averages. A green symbol suggests that the shorter moving average is above the longer one, indicating a potential bullish trend. A red symbol suggests the opposite, indicating a potential bearish trend.
3. Confirmation and Strategy: Consider TTD signals as confirmation for your trading strategy. For instance, in an uptrend, look for long opportunities when the dashboard displays consistent green symbols. Conversely, in a downtrend, focus on short opportunities when red symbols dominate.
4. Risk Management: As with any indicator, use TTD in conjunction with proper risk management techniques. Avoid trading solely based on indicator signals; instead, integrate them into a comprehensive trading plan.
Conclusion:
The Traders Trend Dashboard (TTD) offers traders a powerful edge in trend analysis, combining innovation, versatility, and clarity. By understanding its unique methodology and integrating its signals with your trading strategy, you can make more informed trading decisions across various markets and timeframes. Elevate your trading with TTD and unlock a new level of trend analysis precision.
Swing Point Oscillator with Trend Filter [Quantigenics]The "Swing Point Oscillator with Trend Filter" is a sophisticated trading oscillator designed to enhance trading decisions by adapting to market conditions. Oscillators typically signal overbought/oversold market states, often yielding false signals in strong trends. This trend indicator addresses this by implementing a 'Trend Filter' which changes color in strong trends, alerting traders to avoid typical oscillator reversals. In strong trends (when the trend Filter is red), mid-high or mid-low levels can be used for pullback entries. In more neutral markets (when the trend Filter is close to blue), extreme high and low levels (top and bottom) can be used, as a true 'over bought / over sold' oscillator. The oscillator combines components of the Stochastic Oscillator and the CCI, then normalizes the result, providing a unique, adaptive signal. The color-coded lines and Trend Filter offer clear visual cues, making this a comprehensive tool for various market scenarios.
Caution: Always use the indicator in conjunction with other tools and analysis methods to confirm trading decisions. Avoid trading solely based on this indicator.
GOLD 4HR
CL1! 4HR
How to Use:
Swing Point Oscillator: Displays the momentum of the price relative to its recent high and low.
Trend Filter: Highlights the general direction of the market trend.
Zones: Visual representation to categorize oscillator values (Up Zone and Down Zone).
Interpretation:
Oscillator:
When the oscillator moves upward and approaches or enters the Up Zone, it indicates increasing bullish momentum.
When the oscillator moves downward and approaches or enters the Down Zone, it suggests increasing bearish momentum.
Values near the middle (around zero) often indicate indecision or consolidation in the market.
Trend Filter:
A trend filter line above the Mid-High or below the Mid-Low suggests a strong trend.
When the trend filter is between the Mid-High and Mid-Low, it might indicate a weaker or sideways trend.
Its color will change based on its position relative to the zones. For instance, it turns red when indicating a stronger trend.
Zones:
Up Zone: The area between the Top Line and the Mid-High. Indicates strong bullish momentum when the oscillator is within this zone.
Down Zone: The area between the Mid-Low and the Bottom Line. Indicates strong bearish momentum when the oscillator is in this zone.
Trading Tips:
Bullish Scenario: Consider long positions when the oscillator is rising, and the trend filter indicates a strong upward trend.
Bearish Scenario: Consider short positions when the oscillator is falling, and the trend filter indicates a strong downward trend.

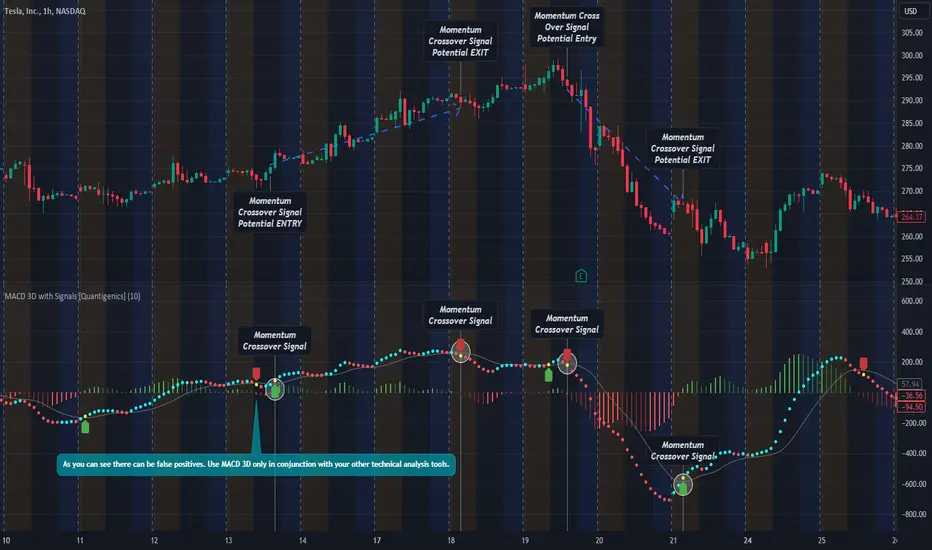
MACD 3D with Signals [Quantigenics]Quantigenics MACD 3D with Buy Sell Signals is a MACD-based trading indicator that aims to identify market trends and potential turning points, for Buy/Sell opportunities, by leveraging price data and volatility.
Unlike the traditional MACD indicator, the average price is calculated from the high, low, and close prices, from which a specialized MACD value is derived. This MACD value, combined with an average and standard deviation, takes into account volatility, and is used to generate an upper and lower boundary.
The indicator color-codes market trends: aqua indicates upward trends (signifying increased buying pressure), red suggests downward trends (increased selling pressure). When the MACD value crosses above the upper boundary or falls below the lower boundary, the color changes to yellow indicating a possible reversal point and "Momentum Crossover Signals" can be plotted at this point. "Standard Signal" arrows can also plotted when the MACD 3D changes from auqa to red and vice-versa.
A trendline is drawn at the median value, providing a baseline for comparison. A differential value, which measures the distance between the MACD value and the median line, provides additional insight into the price's deviation from this baseline (divergences from the underlying price can be spotted using this data as well). The differential is color-coded: green when MACD is above the median, and red when it's below, with darker shades representing a decreasing gap.
Alerts can be set to trigger with the "Standard Signal" arrows appearing after MACD 3D changes from auqa to red and vice-versa and when the "Momentum Crossover Signal" arrows appear when the MACD value crosses above the upper boundary or falls below the lower boundary indicating a potential reversal. Providing immediate notifications which can be especially helpful in larger time frames where it may take time for a trade setup to develop.
CME_MINI:NQ1!
OANDA:XAUUSD
Enjoy the MACD 3D indicator. Happy Trading!
Adaptive Trend Indicator [Quantigenics]Our Adaptive Trend Indicator is an advanced trading indicator using price and time series analysis to adapt to market trends. It calculates a weighted average of the median price and twice-smoothed average price, then applies a linear regression over twice the user-defined period, generating a trend line. This trend line represents the prevailing market direction and adjusts dynamically based on price fluctuations. When the Adaptive Trend value increases compared to the previous value, the line turns aqua, signaling an upward trend. Conversely, if it decreases, the line turns red, indicating a downward trend. This color coding provides visual guidance for traders. By combining advanced statistical techniques with real-time adaptation, the Adaptive Trend indicator provides timely trend information, supporting traders in navigating various market conditions.
Additionally, this indicator may be applied multiple times to the same chart. Traders may adjust the length of each instance to show a group of trendlines that can indicate when price action is overbought or oversold as well as support or resistance at different indicator lengths. Example below.
CRYPTO:BTCUSD
CRYPTO:BTCUSD
NASDAQ:TSLA
We hope you enjoy this indicator. Happy Trading!

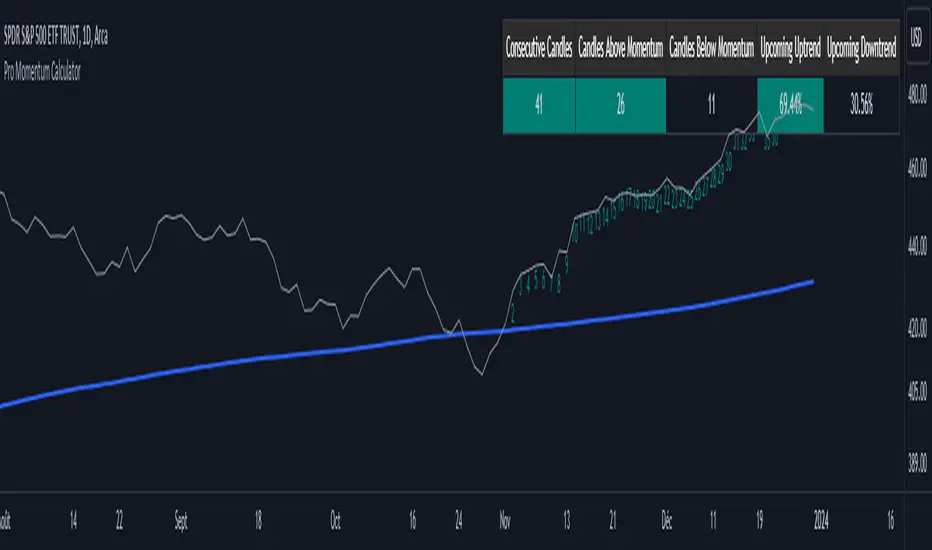
Pro Momentum CalculatorThe Pro Momentum Calculator Indicator is a tool for traders seeking to gauge market momentum and predict future price movements. It achieves this by counting consecutive candle periods above or below a chosen Simple Moving Average (SMA) and then providing a percentage-based probability for the direction of the next candle.
Here's how this principle works:
1. Counting Consecutive Periods: The indicator continuously tracks whether the closing prices of candles are either above or below the chosen SMA.
- When closing prices are above the SMA, it counts consecutive periods as "green" or indicating potential upward momentum.
- When closing prices are below the SMA, it counts consecutive periods as "red" or suggesting potential downward momentum.
2. Assessing Momentum: By monitoring these consecutive periods, the indicator assesses the strength and duration of the current market trend.
This is important information for traders looking to understand the market's behavior.
3. Predicting the Next Candle: Based on the historical data of consecutive green and red periods, the indicator calculates a percentage probability for the direction of the next candle:
- If there have been more consecutive green periods, it suggests a higher likelihood of the next candle being green (indicating a potential upward movement).
- If there have been more consecutive red periods, it suggests a higher likelihood of the next candle being red (indicating a potential downward movement).
The Pro Momentum Calculator indicator's versatility makes it suitable for a wide range of financial markets, including stocks, Forex, indices, commodities, cryptocurrencies...
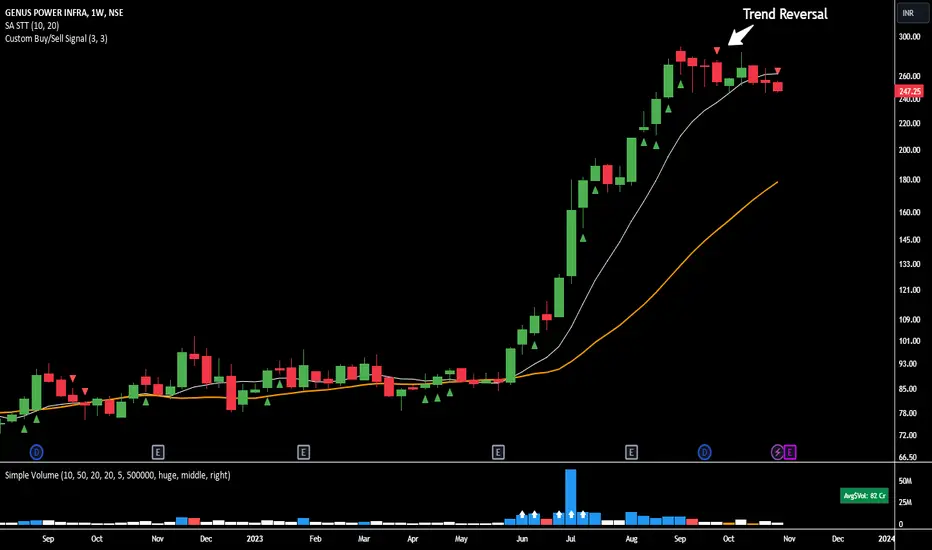
Major and Minor Trend Indicator by Nikhil34a V 2.2Title: Major and Minor Trend Indicator by Nikhil34a V 2.2
Description:
The Major and Minor Trend Indicator v2.2 is a comprehensive technical analysis script designed for use with the TradingView platform. This powerful tool is developed in Pine Script version 5 and helps traders identify potential buying and selling opportunities in the stock market.
Features:
SMA Trend Analysis: The script calculates two Simple Moving Averages (SMAs) with user-defined lengths for major and minor trends. It displays these SMAs on the chart, allowing traders to visualize the prevailing trends easily.
Surge Detection: The indicator can detect buying and selling surges based on specific conditions, such as volume, RSI, MACD, and stochastic indicators. Both Buying and Selling surges are marked in black on the chart.
Option Buy Zone Detection: The script identifies the option buy zone based on SMA crossovers, RSI, and MACD values. The buy zone is categorized as "CE Zone" or "PE Zone" and displayed in the table along with the trigger time.
Two-Day High and Low Range: The script calculates the highest high and lowest low of the previous two trading days and plots them on the chart. The area between these points is shaded in semi-transparent green and red colors.
Crossover Analysis: The script analyzes moving average crossovers on multiple timeframes (2-minute, 3-minute, and 5-minute) and displays buy and sell signals accordingly.
Trend Identification: The script identifies the major and minor trends as either bullish or bearish, providing valuable insights into the overall market sentiment.
Usage:
Customize Major and Minor SMA Periods: Adjust the lengths of major and minor SMAs through input parameters to suit your trading preferences.
Enable/Disable Moving Averages: Choose which SMAs to display on the chart by toggling the "showXMA" input options.
Set Surge and Option Buy Zone Thresholds: Modify the surgeThreshold, volumeThreshold, RSIThreshold, and StochThreshold inputs to refine the surge and buy zone detection.
Analyze Crossover Signals: Monitor the crossover signals in the table, categorized by timeframes (2-minute, 3-minute, and 5-minute).
Explore Market Bias and Distance to 2-Day High/Low: The table provides information on market bias, current price movement relative to the previous two-day high and low, and the option buy zone status.
Additional Use Cases:
Surge Indicator:
The script includes a Surge Indicator that detects sudden buying or selling surges in the market. When a buying surge is identified, the "BSurge" label will appear below the corresponding candle with black text on a white background. Similarly, a selling surge will display the "SSurge" label in white text on a black background. These indicators help traders quickly spot strong buying or selling activities that may influence their trading decisions. These surges can be used to identify sudden premium dump zones.
Option Buy Zone:
The Option Buy Zone is an essential feature that identifies potential zones for buying call options (CE Zone) or put options (PE Zone) based on specific technical conditions. The indicator evaluates SMA crossovers, RSI, and MACD values to determine the current market sentiment. When the option buy zone is triggered, the script will display the respective zone ("CE Zone" or "PE Zone") in the table, highlighted with a white background. Additionally, the time when the buy zone was triggered will be shown under the "Option Buy Zone Trigger Time" column.
Price Movement Relative to 2-Day High/Low:
The script calculates the highest high and lowest low of the previous two trading days (high2DaysAgo and low2DaysAgo) and plots these points on the chart. The area between these two points is shaded in semi-transparent green and red colors. The green region indicates the price range between the highpricetoconsider (highest high of the previous two days) and the lower value between highPreviousDay and high2DaysAgo. Similarly, the red region represents the price range between the lowpricetoconsider (lowest low of the previous two days) and the higher value between lowPreviousDay and low2DaysAgo.
Entry Time and Current Zone:
The script identifies potential entry times for trades within the option buy zone. When a valid buy zone trigger occurs, the script calculates the entryTime by adding the durationInMinutes (user-defined) to the startTime. The entryTime will be displayed in the "Entry Time" column of the table. Depending on the comparison between optionbuyzonetriggertime and entryTime, the background color of the entry time will change. If optionbuyzonetriggertime is greater than entryTime, the background color will be yellow, indicating that a new trigger has occurred before the specified duration. Otherwise, the background color will be green, suggesting that the entry time is still within the defined duration.
Current Zone Indicator:
The script further categorizes the current zone as either "CE Zone" (call option zone) or "PE Zone" (put option zone). When the market is trending upwards and the minor SMA is above the major SMA, the currentZone will be set to "CE Zone." Conversely, when the market is trending downwards and the minor SMA is below the major SMA, the currentZone will be "PE Zone." This information is displayed in the "Current Zone" column of the table.
These additional use cases empower traders with valuable insights into market trends, buying and selling surges, option buy zones, and potential entry times. Traders can combine this information with their analysis and risk management strategies to make informed and confident trading decisions.
Note:
The script is optimized for identifying trends and potential trade opportunities. It is crucial to perform additional analysis and risk management before executing any trades based on the provided signals.
Happy Trading!

RAINBOW AVERAGES - INDICATOR - (AS) - 1/3
-INTRODUCTION:
This is the first of three scripts I intend to publish using rainbow indicators. This script serves as a groundwork for the other two. It is a RAINBOW MOVING AVERAGES indicator primarily designed for trend detection. The upcoming script will also be an indicator but with overlay=false (below the chart, not on it) and will utilize RAINBOW BANDS and RAINBOW OSCILLATOR. The third script will be a strategy combining all of them.
RAINBOW moving averages can be used in various ways, but this script is mainly intended for trend analysis. It is meant to be used with overlay=true, but if the user wishes, it can be viewed below the chart. To achieve this, you need to change the code from overlay=true to false and turn off the first switch that plots the rainbow on the chart (or simply move the indicator to a new pane below). By doing this, you will be able to see how all four conditions used to detect trends work on the chart. But let's not get ahead of ourselves.
-WHAT IS IT:
In its simplest form, this indicator uses 10 moving averages colored like a rainbow. The calculation is as follows:
MA0: This is the main moving average and can be defined with the type (SMA, EMA, RMA, WMA, SINE), length, and price source. However, the second moving average (MA1) is calculated using MA0 as its source, MA2 uses MA1 as the data source, and so on, until the last one, MA9. Hence, there are 10 moving averages. The first moving average is special as all the others derive from it. This indicator has many potential uses, such as entry/exit signals, volatility indication, and stop-loss placement, but for now, we will focus on trend detection.
-TREND DETECTION:
The indicator offers four different background color options based on the user's preference:
0-NONE: No background color is applied as no trend detection tools is being used (boring)
1-CHANGE: The background color is determined by summing the changes of all 10 moving averages (from two bars). If the sum is positive and not falling, the background color is GREEN. If the sum is negative and not rising, the background color is RED. From early testing, it works well for the beginning of a movement but not so much for a lasting trend.
2-RAINBW: The background color is green when all the moving averages are in ascending order, indicating a bullish trend. It is red when all the moving averages are in descending order, indicating a bearish trend. For example, if MA1>MA2>MA3>MA4..., the background color is green. If MA1 threshold, and red indicates width < -threshold.
4-DIRECT: The background color is determined by counting the number of moving averages that are either above or below the input source. If the specified number of moving averages is above the source, the background color is green. If the specified number of moving averages is below the source, the background color is red. If all ten MAs are below the price source, the indicator will show 10, and if all ten MAs are above, it will show -10. The specific value will be set later in the settings (same for 3-TSHOLD variant). This method works well for lasting trends.
Note: If the indicator is turned into a below-chart version, all four color options can be seen as separate indicators.
-PARAMETERS - SETTINGS:
The first line is an on/off switch to plot the skittles indicator (and some info in the tooltip). The second line has already been discussed, which is the background color and the selection of the source (only used for MA0!).
The line "MA1: TYP/LEN" is where we define the parameters of MA0 (important). We choose from the types of moving averages (SMA, EMA, RMA, WMA, SINE) and set the length.
Important Note: It says MA1, but it should be MA0!.
The next line defines whether we want to smooth MA1 (which is actually MA0) and the period for smoothing. When smoothing is turned on, MA0 will be smoothed using a 3-pole super smoother. It's worth noting that although this only applies to MA0, as the other MAs are derived from it, they will also be smoothed.
In the line below, we define the type and length of MAs for MA2 (and other MAs except MA0). The same type and length are used for MA1 to MA9. It's important to remember that these values should be smaller. For example, if we set 55, it means that MA1 is the average of 55 periods of MA0, MA2 will be 55 periods of MA1, and so on. I encourage trying different combinations of MA types as it can be easily adjusted for ur type of trading. RMA looks quirky.
Moving on to the last line, we define some inputs for the background color:
TSH: The threshold value when using 3-TSHOLD-BGC. It's a good idea to change the chart to a pane below for easier adjustment. The default values are based on EURUSD-5M.
BG_DIR: The value that must be crossed or equal to the MA score if using 4-DIRECT-BGC. There are 10 MAs, so the maximum value is also 10. For example, if you set it to 9, it means that at least 9 MAs must be below/above the price for the script to detect a trend. Higher values are recommended as most of the time, this indicator oscillates either around the maximum or minimum value.
-SUMMARY OF SETTINGS:
L1 - PLOT MAs and general info tooltip
L2 - Select the source for MA0 and type of trend detection.
L3 - Set the type and length of MA0 (important).
L4 - Turn smoothing on/off for MA0 and set the period for super smoothing.
L5 - Set the type and length for the rest of the MAs.
L6 - Set values if using 4-DIRECT or 3-TSHOLD for the trend detection.
-OTHERS:
To see trend indicators, you need to turn off the plotting of MAs (first line), and then choose the variant you want for the background color. This will plot it on the chart below.
Keep in mind that M1 int settings stands for MA0 and MA2 for all of the 9 MAs left.
Yes, it may seem more complicated than it actually is. In a nutshell, these are 10 MAs, and each one after MA0 uses the previous one as its source. Plus few conditions for range detection. rest is mainly plots and colors.
There are tooltips to help you with the parameters.
I hope this will be useful to someone. If you have any ideas, feedback, or spot errors in the code, LET ME KNOW.
Stay tuned for the remaining two scripts using skittles indicators and check out my other scripts.
-ALSO:
I'm always looking for ideas for interesting indicators and strategies that I could code, so if you don't know Pinescript, just message me, and I would be glad to write your own indicator/strategy for free, obviously.
-----May the force of the market be with you, and until we meet again,

Higher Fibonacci EMAOverall image:
If the closing price is higher than the three Fibonacci EMAs (uptrend):
Thanks to @ZenAndTheArtOfTrading and his indicator "Higher Timeframe EMA", URL =
This is a trend-discriminating indicator that uses 3 EMAs.
The Williams Alligator is the underlying philosophy, and we have applied it to capture the larger trend.
It is set up for the current time frame + 2 higher time frames.
One of the upper time legs has a daily EMA length of 13 Fibonacci numbers.
The top-level time leg has a weekly EMA with a length of 5 Fibonacci.
If the current closing price of the ticker leg is higher than these three EMAs, the bar color will be green. If it is lower, it will be red. If it is neither, it will be gray.
If the bar color is green, it suggests that the trend is upward. If it is red, you can consider entering short. If it is gray, it is best not to enter anything.

Moving Average-TREND POWER v2.0-(AS)HELLO:
-This indicator is a waaaay simpler version of my other script - Moving Average-TREND POWER v1.1-(AS).
HOW DOES IT WORK:
-Script counts number of bars below or above selected Moving Average (u can se them by turning PLOT BARS on). Then multiplies number of bars by 0.01 and adds previous value. So in the uptrend indicator will be growing faster with every bar when price is above MA. When MA crosess price Value goes to zero so it shows when the market is ranging.
If Cross happens when number of bars is higher than Upper threshold or below Lower threshold indicator will go back to zero only if MA crosses with high in UPtrend and low in DNtrend. If cross happens inside THSs Value will be zero when MA crosses with any type of price source like for example (close,high,low,ohlc4,hl etc.....).This helps to get more crosess in side trend and less resets during a visible trend
HOW TO SET:
Just select what type of MA you want to use and Length. Then based on your preference set values of THSs'
OTHER INFORMATIONS:
-Script was created and tested on EURUSD 5M.
-For bigger trends choose slowerMAs and bigger periods and the other way around for short trends (FasterMAs/shorter periods)
-Below script code you can find not used formulas for calculating indicator value(thanks chat GPT), If you know some pinescript I encourage you to try try them or maybe bulid better ones. Script uses most basic one.
-Pls give me some feedback/ideas to improve and check out first version. Its way more complicated for no real reason but still worth to take a look'
-Also let me know if you find some logical errors in the code.
Enjoy and till we meet again.

Moving Average - TREND POWER v1.1- (AS)0)NOTE:
This is first version of this indicator. It's way more complicated than it should be. Check out Moving Average-TREND POWER v2.1-(AS), its waaaaay less complicated and might be better.Enjoy...
1)INTRODUCTION/MAIN IDEA:
In simpliest form this script is a trend indicator that rises if Moving average if below price or falling if above and going back to zero if there is a crossover with a price. To use this indicator you will have to adjust settings of MAs and choose conditions for calculation.
While using the indicator we might have to define CROSS types or which MAs to use. List of what cross types are defined in the script and Conditiones to choose from.The list will be below.
2) COMPOSITION:
-MA1 can be defined by user in settings, possible types: SMA, EMA, RMA, HMA, TEMA, DEMA, LSMA, WMA.
-MA2 is always ALMA
3) OVERLAY:
Default is false but if you want to see MA1/2 on chart you can change code to true and then turn on overlay in settings. Most plot settings are avalible only in OV=false.
if OV=true possible plots ->MA1/2, plotshape when choosen cross type
if OV=false -> main indicator,TSHs,Cross counter
4)PRESETS :
Indicator has three modes that can be selected in settings. First two are presets and do not require selecting conditions as they set be default.
-SIMPLE - most basic
-ABSOLUTE - shows only positive values when market is trending or zero when in range
-CUSTOM - main and the most advanced form that will require setting conditions to use in calculating trend
4.1)SIMPLE – this is the most basic form of conditions that uses only First MA. If MA1 is below selected source (High/Low(High for Uptrend and Low for DNtrend or OHLC4) on every bar value rises by 0.02. if it above Low or OHLC4 it falls by 0.02 with every bar. If there is a cross of MA with price value is zero. This preset uses CROSS_1_ULT(list of all cross types below)
4.2) ABSOLUTE – does not show direction of the trend unlike others and uses both MA1 and MA2. Uses CROSS type 123_ULT
4.3) CUSTOM – here we define conditions manually. This mode is defined in parts (5-8 of description)
5)SETTINGS:
SOURCE/OVERLAY(line1) – select source of calculation form MA1/MA2, select for overlay true (look point 3)
TRESHOLDS(line2). – set upper and lower THS, turn TSHs on/off
MA1(line3) – Length/type of MA/Offset(only if MA type is LSM)
MA2(line4) – length/offset/sigma -(remember to set ma in the way that in Uptrend MA2MA1 in DNtrend)
Use faster MA types for short term trends and slower types / bigger periods for longer term trends, defval MA1/2 settings
are pretty much random so using them is not recomended.
CROSSshape(line5) – choose which cross type you want to plot on chart(only in OV=true) or what type you want to use in counting via for loops,
CROSScount(line6) – set lookback for type of cross choosen above
BOOLs in lines 5 and 6 - plotshape if OV=true/plot CROSScount histogram (if OV=false)
Lines 7 and 8 – PRESET we want to use /SRC for calculation of indicator/are conditions described below/which MAs to use/Condition for
reducing value t 0 - (if PRESET is ABSOLUTE or SIMPLE only SRC should be set(Line 8 does not matter if not CUSTOM))
5)SOURCE for CONDS:
Here you can choose between H/L and OHLC. If H/L value grow when MAlow. If OHLC MAOHLC. H/L is set by default and recommended. This can be selected for all presets not only CUSTOM
6)CROSS types LIST:
“1 means MA1, 2 is MA2 and 3 I cross of MA1/MA2. L stands for low and H for high so for example 2H means cross of MA2 and high”
NAME -DEFINITION Number of possible crosses
1L - cross of MA1 and low 1
1H - cross of MA1 and high 1
1HL - cross of MA1 and low or MA1 and high 2 -1L/1H
2L - cross of MA2 and low 1
2H - cross of MA2 and high 1
2HL - cross of MA2 and low or MA1 and high 2 -2L/2H
12L - cross of MA1 and low or MA2 and low 2 -1L/2L
12H - cross of MA1 and high or MA2 and high 2 -1H/2H
12HL - MA1/2 and high/low 4 -1H/1L/2H/2L
3 -cross of MA1 and MA2 1
123HL -crosses from 12HL or 3 5 -12HL/3
1_ULT - cross of MA1 with any of price sources(close,low,high,ohlc4 etc…)
2_ULT - cross of MA2 with any of price sources(close,low,high,ohlc4 etc…)
123_ULT – all crosses possible of MA1/2 (all of the above so a lot)
7)CRS CONDS:
“conditions to reduce value back to zero”
>/< - 0 if indicator shows Uptrend and there’s a cross with high of selected MA or 0 if in DNtrend and cross with low. Better for UP/DN trend detection
ALL – 0 if cross of MA with high or low no matter the trend, better for detecting consolidation
ULT – if any cross of selected MA, most crosses so goes to 0 most often
8)MA selection and CONDS:
-MA1: only MA1 is used,if MA1 below price value grows and the other way around
MA1price =-0.02
-MA2 – only MA2 is used, same conditions as MA1 but using MA2
MA2price =-0.02
-BOTH – MA1 and MA2 used, grows when MA1 if below, grows faster if MA1 and MA2 are below and fastest when MA1 and MA2 are below and MA2price=-0.02
-MA1 and MA2 >price=-0.03
-MA1 and MA2 ?price and MA2>MA1=-0.04
9)CONDITIONS SELECTION SUMMARRY:
So when CUSTOM we choose :
1)SOURCE – H/L or OHLC
2)MAs – MA1/MA2/BOTH
3)CRS CONDS (>/<,ALL,ULT)
So for example...
if we take MA1 and ALL value will go to zero if 1HL
if MA1 and >/< - 0 if 1L or 1H (depending if value is positive or negative).(1L or 1H)
If ALL and BOTH zero when 12HL
If BOTH and ULT value goes back to zero if Theres any cross of MA1/MA2 with price or cross of MA1 and MA2.(123_ULT)
If >/< and BOTH – 0 if 12L in DNtrend or 12H if UPtrend
10) OTHERS
-script was created on EURUSD 5M and wasn't tested on different markets
-default values of MA1/MA2 aren't optimalized so do not
-There might be a logical error in the script so let me know if you find it (most probably in 'BOTH')
-thanks to @AlifeToMake for help
-if you have any ideas to improve let me know
-there are also tooltips to help
