[blackcat] L3 M.H. Pee Trend Continuation FactorLevel: 3
Background
Developed by M. H. Pee, the Trend Continuation Factor aims to help traders identify whether the market is trending, and, in case it is, in what direction it is headed. It can be used in any time frame, with every currency pair and is suitable for beginner traders.
Function
The indicator is comprised of two lines, namely the PlusTCF and MinusTCF, which separately correspond to bullish and bearish momentum, respectively. If the PlusTCF line is positive, then the prevailing trend is bullish, while a positive MinusTCF line signifies a bearish trend. Logically, both lines cannot be positive at the same time because the market cannot be in a bullish and a bearish trend simultaneously. However, they both can be negative at a current moment, implying that the market has consolidated in a trading range.
As for trading this indicator, it is generally interpreted and acted upon in a similar way as trading the Average Directional Movement Index. The most basic trading strategy involving the TCF is to enter long positions when the PlusTCF line is positive and to enter short positions when the MinusTCF is positive.
Traders also tend to regard the crossovers of the PlusTCF and MinusTCF lines as entry signals in the direction of the advancing line. Thus, if the PlusTCF crosses the MinusTCF and becomes positive, you should initiate a long entry, and vice versa.
Key Signal
PlusTCF Line --> bullish momentum line in yellow;
MinusTCF Line --> bearish momentum line in fuchsia.
Alerts are available.
Remarks
This is a Level 3 free and open source indicator.
Feedbacks are appreciated.
Trendcontinuation


[astropark] Trend Skywalker V1 [alarms]Dear Followers,
today another awesome Swing and Scalping Trading Strategy indicator: Trend Skywalker !
It shows a trend cloud that reacts very fast to price action, so it's perfect for trending markets: it helps a lot to find out
when a trend is going to end and a new is going to start
when to enter again within a trending market
where to put your stoploss
In this example below you can see the three points above:
In fact in a trending market it will highlight that:
price consolidation within the could is a trend weakening signal , so you can easily spot when a trend is going to end and a new is going to start
bullish/bearish trend cloud retests are nice opportunity to re-enter within a trending market, especially if cloud is thick
where to put your stoploss ( below the cloud and/or recent low in a buy scenario , above the cloud and/or recent high in a sell scenario )
This strategy/indicator has the following options:
change analysis window (the lower, the more reactive; the higher, the less reactive)
enable/disable signals on chart
enable/disable "more confirmations" signals filter
enable/disable bars and background coloring based on trend
enable/disable an automatic Trailing Stop strategy option (Automatic Stops)
enable/disable a peak profit tracker (the max percentage profit labels)
enable/disable highlights of trend cloud retests
enable/disable highlights of trend cloud price breakouts
Here below some examples how the indicator works on many markets and timeframe.
ETH/USD 4h
EUR/USD 15m
LTC/BTC 1h
This strategy only trigger 1 buy (where to start a long trade) or 1 sell (for short trade).
Keep in mind that proper risk management and money management strategies are very important to manage your trades (DM me if you need any clarification on these points).
This script will let you set all notifications you may need in order to be alerted on each triggered signals.
The one for backtesting purpose can be found by searching for the astropark's "Trend Skywalker" and then choosing the indicator with "strategy" suffix in the name, or you can find here below:
This is a premium indicator , so send me a private message in order to get access to this script.

Trend Indicator for Directional Trading (main)TIDT is a two-part trend-based indicator that aims to recognize the general direction and help you identify good opportunities for going long or short. This is the main indicator that is plotted on the chart and is comprised of 3 Moving Averages over which you have full control. You can choose between the following 7 types:
- Simple Moving Average (SMA)
- Exponential Moving Average (EMA)
- Weighted Moving Average (WMA)
- Running Moving Average (RMA)
- Hull Moving Average (HMA)
- Volume Weighted Moving Average (VWMA)
- Arnaud Legoux Moving Average (ALMA)
For clarity of the trend whenever a fast MA crosses up or down a slower MA, the slower one changes its color. The faster MA changes color based on its direction.
Depending on your MA preferences and their period, you generate two main signal types:
1) Moving Average Bounce Signals - You will get a signal whenever the price bounces off, nearly touches or pierces your first MA (depending on your settings as described below)
2) Pullback / Retracement Signals - You will get a signal whenever a trend is established and the price retraces, thus giving you an optimal entry.
I've included 3 additional settings that you can tweak in order to reduce the noise or get more signals, all depending on your risk tolerance and trading style. Configuring these settings will filter the results you get in "Moving Average Bounce Signals". They are as follows:
1) Trend Strength - identifies ranging areas and helps you avoid choppy markets. The higher number, the stronger the trend must be for a signal.
2) Buffer Zone - allows you to receive a signal whenever price approaches your first MA. This way you will not miss a signal if the price doesn't bounce off your MA, or it will notify you in advance of a possible bounce/breakdown.
3) Max Candles Beyond MA - gives you a signal even if the price doesn't bounce off your first MA, but goes through it and then goes back up. You can select how many candles can close beyond the MA before invalidating the signal. Currently, the maximum number of candles that can close beyond the first MA is 5. This is done for your own practicality.
Almost all available options can be configured including the colors of the different signals - Bounces, Pullbacks, MA piercing depending on the number of candles, etc.
The second part of the indicator (called the same way with "add-on" at the end) is meant to complement this one and show additional trending signals, as well as Bull and Bear Divergences. For better results, both indicators must be used at the same time.
Please, note that like any other indicator, this one does exactly this - it indicates a good possibility of an entry, but does not guarantee profitability. Any indicator must be used as part of a system and strict money-management rules.
If you have any questions regarding the indicator or suggestions on how it could be improved, please let me know in the comment section below. Thank you.

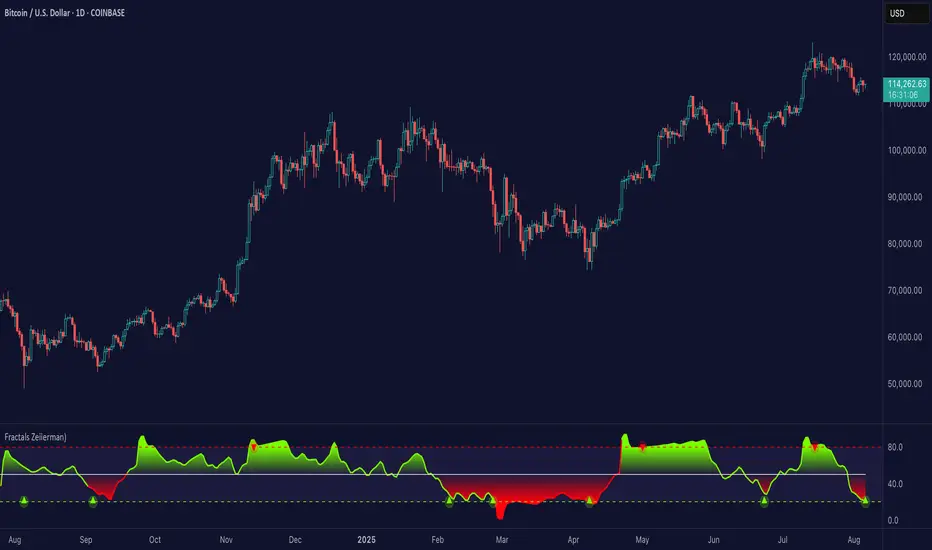
Fractals (Expo)
Fractals (Expo) make use of fractals to identify trends and reversals. The indicator is designed to adapt smoothly and quickly to significant price moves in order to identify trend reversals as well as filtering out noise in an established trend. The indicator is simple to use and understand therefore valuable to all trading styles.
The user has the ability to enable a custom input source which gives the user great flexibility and full control over what the calculations should be based on. The default input source is fractals from the swing points of the market.
Real-Time Trend Alerts
No Repainting
Works on any market and in any timeframe
HOW TO USE
Use the indicator to gain insights into trends and trend reversals.
Identify Trends
Identify Trend reversals
Use it as a Trend filter
INDICATOR IN ACTION
Daily Chart
I hope you find this indicator useful , and please comment or contact me if you like the script or have any questions/suggestions for future improvements. Thanks!
I will continually work on this indicator, so please share your experience and feedback as it will enable me to make even better improvements. Thanks to everyone that has already contacted me regarding my scripts. Your feedback is valuable for future developments!
-----------------
Disclaimer
Copyright by Zeiierman.
The information contained in my scripts/indicators/ideas does not constitute financial advice or a solicitation to buy or sell any securities of any type. I will not accept liability for any loss or damage, including without limitation any loss of profit, which may arise directly or indirectly from the use of or reliance on such information.
All investments involve risk, and the past performance of a security, industry, sector, market, financial product, trading strategy, or individual’s trading does not guarantee future results or returns. Investors are fully responsible for any investment decisions they make. Such decisions should be based solely on an evaluation of their financial circumstances, investment objectives, risk tolerance, and liquidity needs.
My scripts/indicators/strategies/ideas are only for educational purposes!
ACCESS THE INDICATOR
• Contact me on TradingView or use the links below
Trend & Contrarian (Expo)Trend & Contrarian (Expo) is a powerful trend tool with adaptive contrarian- signals. A strong trend is displayed by the background color and the unique Trend dots/line can be used to confirm a strong trend or to identify early trend reversals. The contrarian-signals are adapting dynamically to price moves and should be used as 'preparation' or 'warning' prior to trigger, should be confirmed by a trend reversals signal or by other indicators.
The contrarian signals should only be used if the user fully understands how they work, please test the feature before entering a trade based on it. However, these signals can be very valuable if used correctly.
Green background color ➞ Strong Positive Trend
Red background color ➞ Strong Negative Trend
No background color? ➞ No strong trend. The Trend Dots/line determine the trend
HOW TO USE
Identify strong trends
Identify trend reversals
Identify contrarian signals
INDICATOR IN ACTION
4-hour chart
I hope you find this indicator useful , and please comment or contact me if you like the script or have any questions/suggestions for future improvements. Thanks!
I will continually work on this indicator, so please share your experience and feedback as it will enable me to make even better improvements. Thanks to everyone that has already contacted me regarding my scripts. Your feedback is valuable for future developments!
-----------------
Disclaimer
Copyright by Zeiierman.
The information contained in my scripts/indicators/ideas does not constitute financial advice or a solicitation to buy or sell any securities of any type. I will not accept liability for any loss or damage, including without limitation any loss of profit, which may arise directly or indirectly from the use of or reliance on such information.
All investments involve risk, and the past performance of a security, industry, sector, market, financial product, trading strategy, or individual’s trading does not guarantee future results or returns. Investors are fully responsible for any investment decisions they make. Such decisions should be based solely on an evaluation of their financial circumstances, investment objectives, risk tolerance, and liquidity needs.
My scripts/indicators/strategies/ideas are only for educational purposes!
ACCESS THE INDICATOR
• Contact me on TradingView or use the links below

ATR Trend & ATR Top/Bottom (Zeiierman)█ Overview
ATR Trend & ATR Top/Bottom (Zeiierman) blends momentum, volatility, and adaptive trend analysis into a unified framework. It fuses a dynamic oscillator with ATR-based exhaustion detection to identify trend direction, impulses, and potential reversals within the same structure.
Rather than viewing volatility as noise, this tool interprets it as trend expansion, which represents directional conviction, while contraction signals absorption or exhaustion. By combining multi-phase smoothing, adaptive ATR scaling, and contextual trend filtering, the indicator delivers a complete picture of when a market is accelerating, stabilizing, or reversing.
It performs best once a trend has matured and volatility normalizes around a directional core, giving traders the confidence to participate in established moves while dynamically managing risk.
⚪ Why This One Is Unique
Traditional trend oscillators rely on fixed parameters that degrade across assets or timeframes. ATR Trend & ATR Top/Bottom instead employs adaptive weighting and volatility-normalized filtering that automatically aligns with the current market structure.
Its framework integrates three distinct components:
Adaptive Oscillator Core that reveals the internal rhythm of trend and momentum.
ATR Top/Bottom Layer that marks exhaustion and potential turning zones.
Trend Signal & Dynamic Trailing Stop Engine that highlights directional shifts, confirms alignment with the prevailing trend, and transforms trend data into a self-adjusting risk-management system.
█ Main Features
⚪ ATR Trend (The Main Oscillator)
The ATR Trend serves as the indicator’s primary oscillator, translating price and volatility dynamics into a smooth directional curve. When the oscillator line remains above its equilibrium, bullish momentum dominates; when it stays below, bearish momentum prevails. Color transitions reflect real-time trend bias, helping traders immediately recognize whether the market is strengthening or weakening.
This component forms the structural core of the tool, defining overall trend direction, momentum intensity, and transition zones.
It also visualizes trend expansion through the fast leading signal line. When this line crosses above the upper or below the lower boundary, it signals an expansive move within the active trend, often representing short-term overbought or oversold conditions, and can also indicate trend strength in the prevailing market direction.
⚪ ATR Top/Bottom
The ATR Top/Bottom layer highlights potential exhaustion zones within the trend. Green peaks reveal areas of buy-side saturation, suggesting a possible slowdown or reversal in bullish momentum, while red peaks mark sell-side extremes, often appearing before stabilization or renewed strength. These zones help traders identify when a move is becoming stretched or losing balance, offering valuable context for managing exits, scaling out, or anticipating reversals. However, these areas can extend for a prolonged period when price is in a strong, sustained trend, reflecting persistent directional pressure rather than immediate exhaustion.
⚪ Trend Channel Hits
The Trend Channel Hits feature visualizes moments when the price interacts with the projected internal trend channel boundaries of the prevailing trend.
Green arrows appear when the price touches the upper boundary of the trend channel. This can indicate two possible outcomes:
A potential breakout from a negative trend into a developing bullish trend, as price breaks above the upper boundary of the descending channel.
A take-profit zone within an established bullish trend, as price reaches the upper channel where mean reversion is likely to occur.
Red arrows appear when the price touches the lower boundary of the trend channel. This can indicate:
A potential breakout from a positive trend into a developing bearish trend, as price breaks below the lower boundary of the rising channel.
A take-profit opportunity within an established bearish trend, as price reaches the lower channel where mean reversion or short-term recovery is likely to occur.
These signals provide early visual confirmation of trend exhaustion, continuation, or structural breakout, helping traders refine entries, exits, and profit-taking within the broader market context.
█ How to Use
⚪ Trend Following
When the oscillator line remains above the mid-level, the market is in a bullish phase. When it stays below the mid-level, the trend is bearish. Periods where the oscillator holds close to its upper or lower limits indicate strong, sustained momentum in that direction. Watch for color changes or crossovers near the mid-level, as these often signal an upcoming shift in trend control.
Bullish Trend
Bearish Trend
⚪ Trend Signals
To help traders identify and participate in trend trades, the indicator includes pre-built Trend Signals that highlight optimal entry conditions within confirmed market trends. These signals are designed to activate only once the market shows established directional momentum, ensuring higher reliability and filtering out noise from short-term fluctuations.
In addition, the indicator includes built-in take-profit markers for each signal. These serve as suggested partial exit levels, helping traders systematically secure profits while allowing the remaining position to follow the trend with the dynamic trailing stop.
Before relying on the signals, always confirm that the market has been trending for a sustained period. This ensures that entries align with genuine long-term directional strength rather than temporary volatility.
Bullish Trend Signals
Bullish Trend Signals appear during an established uptrend when the indicator detects confirmed positive momentum and stable directional structure. These signals mark potential continuation points where buyers regain control after short-term pauses or pullbacks.
The objective is to follow the trend signals, manage trades with the dynamic trailing stop, and consider taking partial profits at the inbuilt take-profit levels plotted by the indicator.
This setup works best when the market is trending clearly upward and has demonstrated consistent buying strength over time.
Bearish Trend Signals
Bearish Trend Signals occur during a confirmed downtrend, indicating that selling momentum remains dominant and the trend structure is intact. They typically appear after short-term corrective rallies, signaling that sellers are reasserting control within the broader bearish environment.
As with bullish signals, the goal is to follow the trend signals and trailing stop to capture sustained downside movement, while using the inbuilt take-profit levels to lock in partial gains as the move progresses. This approach performs best when the market is in a clear, mature downtrend with persistent selling pressure and expanding downside momentum.
⚪ Trend Impulses
Impulses represent short bursts of directional acceleration within the active trend.
A surge above the upper band reflects bullish expansion.
A move below the lower band marks bearish acceleration.
These impulses often precede short consolidations before the trend resumes. Traders can use them to scale into strong phases or take partial profits at temporary extremes.
⚪ Reversals
Enable ATR Top/Bottom to monitor momentum peaks:
Red peaks show strong selling momentum. When these peaks start to fade, it can signal that selling pressure is weakening and a potential recovery may be forming.
Green peaks show strong buying momentum. As their size shrinks, it may signal that buying pressure is slowing, and a possible pullback or reversal could follow.
⚪ Extended Trends
For traders who want to visualize intense, extended trend phases, enable the ATR Top/Bottom feature and increase the Length setting to around 30, with Sensitivity set between 40 and 50. Consider reducing the ATR Trend Length to 50 to gain clearer signals of when a trend begins and ends.
This configuration extends the ATR Top/Bottom zones across the entire duration of a major trend, making it easier to identify sustained directional strength and long-lasting momentum phases.
█ How It Works
⚪ Adaptive Oscillator Engine
The oscillator interprets directional flow through a combination of momentum mapping and volatility weighting. It continuously re-centers its equilibrium to reflect evolving market structure, producing a stable yet responsive representation of underlying trend force.
Calculation: Applies multi-domain smoothing and adaptive normalization to align amplitude with volatility while maintaining directional coherence.
⚪ ATR Top/Bottom Detection
The exhaustion layer isolates high-magnitude deviations from the current volatility envelope, identifying potential top and bottom regions where expansion may stall.
Calculation: Uses proportional volatility thresholds and dynamic range modeling to highlight statistically elevated momentum extremes without over-reacting to noise.
-----------------
Disclaimer
The content provided in my scripts, indicators, ideas, algorithms, and systems is for educational and informational purposes only. It does not constitute financial advice, investment recommendations, or a solicitation to buy or sell any financial instruments. I will not accept liability for any loss or damage, including without limitation any loss of profit, which may arise directly or indirectly from the use of or reliance on such information.
All investments involve risk, and the past performance of a security, industry, sector, market, financial product, trading strategy, backtest, or individual's trading does not guarantee future results or returns. Investors are fully responsible for any investment decisions they make. Such decisions should be based solely on an evaluation of their financial circumstances, investment objectives, risk tolerance, and liquidity needs.
付費腳本

Trend Algo (Zeiierman)█ Overview
Trend Algo (Zeiierman) converts raw price movement into a cohesive, volatility-aware trend map. Rather than static moving averages, it builds an adaptive trend core that responds to market state changes, then layers regime-sensitive clouds (Infinite Sky) and horizon-bounded channels (HorizonX), plus precise trend-change and continuation signals. The result is a clean framework for reading direction, timing pullbacks, and validating momentum.
The indicator visualizes the active trend line, adaptive clouds, and stateful signals to reveal transition zones, trend acceleration, and exhaustion. It suits intraday execution, swing confirmations, and structural regime assessment.
⚪ Why This One Is Unique
Unlike conventional trend tools, this version combines volatility-normalized trend estimation, AI-style regime clustering, and horizon-bounded support/resistance channels. Its framework uses multi-phase smoothing, adaptive width scaling, and state detection that aligns entries and continuations with current market inertia—reducing whipsaw while preserving responsiveness.
█ Main features
⚪ Dynamic Clouds
The Dynamic Trend Line provides a stabilized, noise-aware trajectory of price, color-coded by directional bias. Two cloud systems overlay the core trend:
Infinite Sky (AI) — a regime-aware cloud that distinguishes fast vs. slow trend states.
HorizonX — adaptive channels that operate as dynamic support/resistance and define trend boundaries.
⚪ Candle Coloring
The candle coloring is designed to highlight trend momentum peaks, allowing you to instantly recognize when the trend is accelerating or slowing down. This visual feedback makes it easier to interpret the strength and speed of directional moves directly on the chart, seamlessly complementing the Dynamic Trend Line and Cloud systems.
⚪ Trend Change Signals & Trend Continuation Signals
The main signals are the Trend Change Signals , designed to trigger when the current trend structure begins to shift its state. These signals give you an instant sense of when a potential trend reversal or directional change might occur.
To complement them, we’ve added Trend Continuation Signals , which only activate within an established trend. These signals confirm the current direction and indicate that the trend is gaining strength and preparing for another move in the same direction.
⚪ Trend Line
Two types of trend lines are integrated: Stability and Dynamic.
The Stability Line follows the current price action in a smooth, drift-like manner — staying closer to price to act as a faster support and resistance zone.
The Dynamic Line adapts to volatility, ensuring that continuous movements within the trend are taken into account. This helps traders stay aligned with the trend and capture extended moves during periods of higher market activity.
█ How to Use
⚪ Trend Changes
Trend Change Signals appear when the current trend structure begins to shift, signaling a potential reversal or directional transition. These signals help traders anticipate moments when momentum weakens or changes direction, offering early insight into possible turning points in the market. Combine Trend Change Signals with Candle Coloring or Cloud behavior to confirm entries and strengthen trend reversal validation.
⚪ Trend Continuations
Trend Continuation Signals trigger within an established trend, confirming that the current direction remains strong. They often appear after pullbacks or pauses, suggesting that the market is ready for another move in the same direction. These signals work best when paired with the Dynamic Trend Line, allowing traders to stay confidently aligned with powerful ongoing trends.
⚪ Support and Resistance
The Stability Trend Line acts as a reactive support and resistance guide, staying close to price and highlighting areas where market reactions are most likely to occur. It offers traders a clear view of short-term structure and helps identify potential bounce or rejection zones with precision.
The Dynamic Trend Line adapts to volatility, forming flexible support and resistance zones that expand during strong momentum and contract during quieter phases, keeping the visual structure balanced and responsive to changing market conditions.
HorizonX defines the outer adaptive boundaries of the trend. These dynamic channels operate as broader support and resistance frameworks, helping traders anticipate trend exhaustion or continuation zones beyond the immediate price action.
The Infinite Sky (AI) cloud adds a regime-aware layer that distinguishes fast and slow trend states, visually framing the strength of support or resistance regions as they evolve and allowing traders to read both momentum and structure in a single glance.
█ How It Works
⚪ Dynamic Trend Core
A volatility-normalized estimator generates the primary trajectory and color state, balancing stability vs. agility by adapting to dispersion and displacement.
Calculation: Multi-phase weighted smoothing with volatility-scaled adjustments and adaptive phase control to minimize lag while preserving curvature.
⚪ Infinite Sky (AI Regime Cloud)
Differentiates fast vs. slow trend states and paints a regime-aware cloud that guides timing and risk.
Calculation: Windowed return modeling (with optional consolidation), two-pole response filtering, and distribution-center clustering to classify regimes and modulate the envelope.
⚪ HorizonX Trend Channels
Defines dynamic support/resistance “horizons” that expand/contract with conditions and filter counter-trend noise when strong-trend mode is enabled.
Calculation: A volatility-aware core that evolves with changing price dynamics, maintaining precision across all market conditions.
⚪ Trend Line & Continuations
A fast reaction line confirms pullbacks and validates continuation only when aligned with prevailing bias and structure.
Calculation: Short-horizon smoothing with phase-managed weighting, slope/position gating, and context checks against regime and horizon levels.
⚪ Impulse Detection
Identifies statistically meaningful bursts that precede expansion or warn of exhaustion after extended runs.
Calculation: Nonlinear impulse-response mapping emphasizing second-order changes in directional energy while suppressing micro-noise.
⚪ Trend Bands
Upper/lower bands visualize the active envelope for timing adds, trims, or exits within trend.
Calculation: Percentile-guided banding blended with adaptive anchors to retain structural relevance through regime shifts.
⚪ Bar Color Integration
Bars can inherit trend/gradient context to make state shifts obvious at a glance.
Calculation: Algorithmic gradient model integrating directional momentum intensity to render bar coloration in sync with market flow.
-----------------
Disclaimer
The content provided in my scripts, indicators, ideas, algorithms, and systems is for educational and informational purposes only. It does not constitute financial advice, investment recommendations, or a solicitation to buy or sell any financial instruments. I will not accept liability for any loss or damage, including without limitation any loss of profit, which may arise directly or indirectly from the use of or reliance on such information.
All investments involve risk, and the past performance of a security, industry, sector, market, financial product, trading strategy, backtest, or individual's trading does not guarantee future results or returns. Investors are fully responsible for any investment decisions they make. Such decisions should be based solely on an evaluation of their financial circumstances, investment objectives, risk tolerance, and liquidity needs.
付費腳本

TBS - Trend Buy and Sell IndicatorTrend Buy and Sell Indicator
TBS identifies trend based on price cross-over/cross-under to a moving average. Confirmed Up-trend is displayed in green and Down-trend in red backgrounds. Before a trend is confirmed price cross-over is displayed in blue and cross-under in orange backgrounds. Once an uptrend is confirmed, TBS suggest buys based on touch downs to a Support moving average by a green arrow under the candle . A sell is suggested by TBS by a red arrow on top of the candle when the price reaches a certain percentage above support moving average. Motivation and Tolerance levels are provided to fine tune buying and selling signals.
Example : Default settings for BTC Weekly charts are Trend Moving Average = 50, Support Moving Average = 21, Motivation Buy = 10, Tolerance Buy = 5, Motivation Sell = 50 and Tolerance Sell = 90. That means in uptrend identified by green background every time the closing price touches 10% higher than 21 week moving average value TBS suggests buy, so a trader can choose to buy 80% of intended position at this level. If the price continues to drop down and touches 5% below 21 week moving average, a trader may choose to buy another 20% at this level. In the likely scenarios of price hike from here a trader may choose to sell 80% at the Motivation Sell level 50% higher than 21 week moving average. If the price reaches Tolerance Sell level at 90% higher than 21 week moving average a trader may choose to sell remaining 20% of the position.
Note 1 : TBS suggest Buys and sells but the execution of buy and sell is up to trader's discretion for example using Stop Buy order or Limit Buy order etc.
Note 2 : TBS is designed to be a medium to long term indicator for example weekly and monthly timescales. Traders might find it useful on shorter term time-frames but its not designed for short term time frame in mind.
Note 3 : Most of the parameters in TBS indicator are configurable as Trend Moving Average and Support Moving Average vary significantly across assets. Default parameters are set for Bitcoin Weekly time frame. Traders should play around with parameters to find best fit for Trend Moving Average and Support Moving Average for the asset of interest. For example TBS is very relevant and useful for Gold Weekly time frame with Trend Moving Average = 100, Support Moving Average = 30, Motivation Buy = 1, Tolerance Buy = 0, Motivation Sell = 11 and Tolerance Sell = 20.

[Trend] Support- & Resistance Levels/Zones (Expo)- Trend - Support & Resistance Levels/Zones (Expo) automatically identifies and displays support and resistance levels based on the direction of the trend.
Levels/Zones are displayed where there is a high probability that price will find Support in positive trends and Resistance in negative trends.
Trend Cloud and Trend Detection Line can be enabled.
The indicator can be used standalone or as a part of your current trading strategy.
Real-time
No repainting
Works on any market
HOW TO USE
1. Use the indicator to identify where the price can find support and resistance Levels/Zones in trends.
2. Use the indicator to identify the trend direction.
INDICATOR IN ACTION
4 hour chart
I hope you find this indicator useful , and please comment or contact me if you like the script or have any questions/suggestions for future improvements. Thanks!
I will continually work on this indicator, so please share your experience and feedback as it will enable me to make even better improvements. Thanks to everyone that has already contacted me regarding my scripts. Your feedback is valuable for future developments!
ACCESS THE INDICATOR
• Contact me on TradingView or use the links below
-----------------
Disclaimer
Copyright by Zeiierman.
The information contained in my scripts/indicators/ideas does not constitute financial advice or a solicitation to buy or sell any securities of any type. I will not accept liability for any loss or damage, including without limitation any loss of profit, which may arise directly or indirectly from the use of or reliance on such information.
All investments involve risk, and the past performance of a security, industry, sector, market, financial product, trading strategy, or individual’s trading does not guarantee future results or returns. Investors are fully responsible for any investment decisions they make. Such decisions should be based solely on an evaluation of their financial circumstances, investment objectives, risk tolerance, and liquidity needs.
My scripts/indicators/ideas are only for educational purposes!

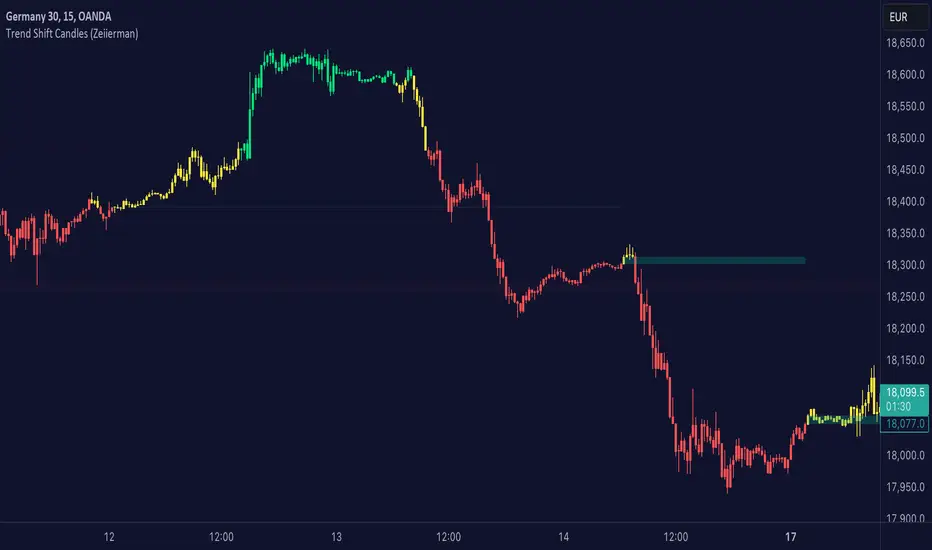
Trend shift Candles (Expo)Trend shift Candles (Expo) identifies where the market characteristics change. Trend shifts often occur in these areas. This is visualized with white candlesticks and Zones.
-> When the market enters a positive trend the candlesticks become green and when the market enters a negative trend the candlesticks become red.
-> The user can choose which timeframe to use. Vwap can be enabled as an input source instead of using price.
-> Please play around with the settings, I haven't set them to any specific values.
HOW TO USE
1. Use the indicator to identify the direction of the trend.
2. Use the indicator to identify trend changes.
-> Visual Order should be set to "Bring to Front" in order to see the color of the candles.
INDICATOR IN ACTION
4 hour chart
The indicator work on Heikin Ashi, Candles, Bars, Renko, Line Break, Kagi, and Point & Figure chart.
I hope you find this indicator useful , and please comment or contact me if you like the script or have any questions/suggestions for future improvements. Thanks!
I will continually work on this indicator, so please share your experience and feedback as it will enable me to make even better improvements. Thanks to everyone that has already contacted me regarding my scripts. Your feedback is valuable for future developments!
ACCESS THE INDICATOR
• Contact me on TradingView or use the links below
-----------------
Disclaimer
Copyright by Zeiierman.
The information contained in my scripts/indicators/ideas does not constitute financial advice or a solicitation to buy or sell any securities of any type. I will not accept liability for any loss or damage, including without limitation any loss of profit, which may arise directly or indirectly from the use of or reliance on such information.
All investments involve risk, and the past performance of a security, industry, sector, market, financial product, trading strategy, or individual’s trading does not guarantee future results or returns. Investors are fully responsible for any investment decisions they make. Such decisions should be based solely on an evaluation of their financial circumstances, investment objectives, risk tolerance, and liquidity needs.
My scripts/indicators/ideas are only for educational purposes
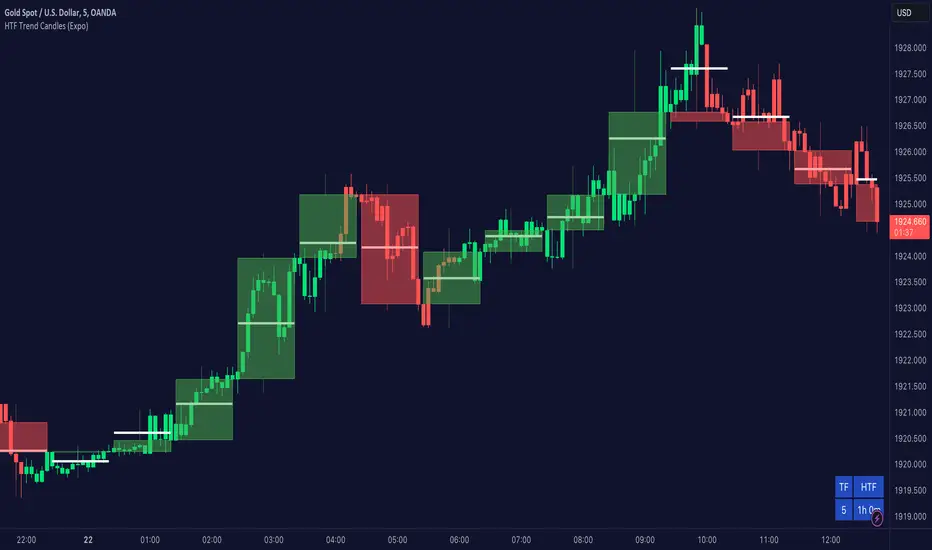
Higher TimeFrame Trend Candles (Expo) The trend is your friend!
Higher TimeFrame Candles (Expo) identifies the trend from Higher TimeFrame and displays a Zone where the trend changes. It is an effective and convenient way of getting a broader picture of the market and you will always be sure that you're trading in the same direction as the higher timeframe trend.
The user can choose which time frame to use. Heikin Ashi Trend can be displayed.
HOW TO USE
1. Use the indicator to identify the direction of the trend.
2. Use the indicator to identify trend changes.
--> Visual Order should be set to "Bring to Front" in order to see the color of the candles.
INDICATOR IN ACTION
4 hour chart
The indicator work on Heikin Ashi, Candles, Bars, Renko, Line Break, Kagi, and Point & Figure chart.
I hope you find this indicator useful , and please comment or contact me if you like the script or have any questions/suggestions for future improvements. Thanks!
I will continually work on this indicator, so please share your experience and feedback as it will enable me to make even better improvements. Thanks to everyone that has already contacted me regarding my scripts. Your feedback is valuable for future developments!
ACCESS THE INDICATOR
• Contact me on TradingView or use the links below
-----------------
Disclaimer
Copyright by Zeiierman.
The information contained in my scripts/indicators/ideas does not constitute financial advice or a solicitation to buy or sell any securities of any type. I will not accept liability for any loss or damage, including without limitation any loss of profit, which may arise directly or indirectly from the use of or reliance on such information.
All investments involve risk, and the past performance of a security, industry, sector, market, financial product, trading strategy, or individual’s trading does not guarantee future results or returns. Investors are fully responsible for any investment decisions they make. Such decisions should be based solely on an evaluation of their financial circumstances, investment objectives, risk tolerance, and liquidity needs.
My scripts/indicators/ideas are only for educational purposes
The trend changes direction.
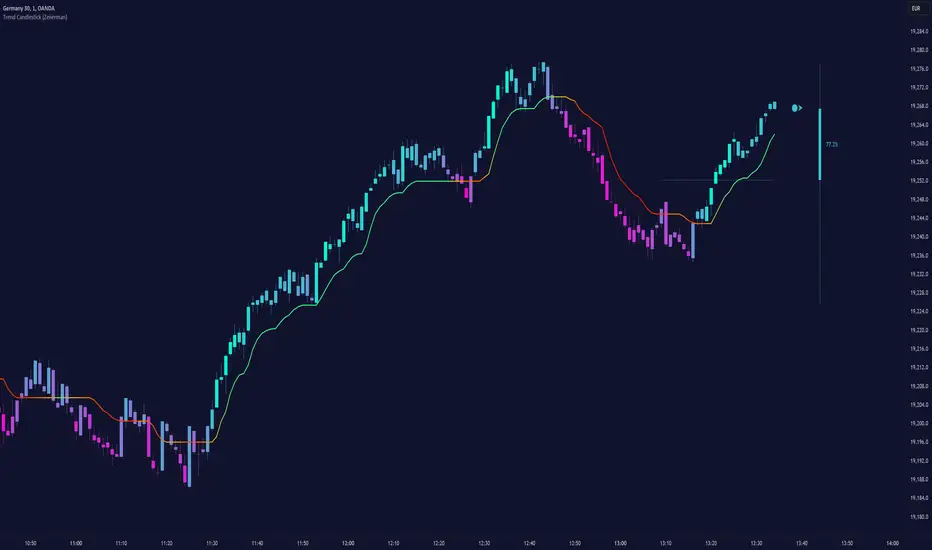
Trend Candlestick (Expo)Trading with the Trend!
Trend Candlestick (Expo) identifies the direction of the trend and Zones are displayed where the trend changes. The user has the ability to adjust the settings so that long term, as well as short term trend direction and trend changes, can be visualized.
The indicator is visual and easy to use.
HOW TO USE
1. Use the indicator to identify the direction of the trend.
2. Use the indicator to identify trend changes.
3. Use the indicator to find support and resistance levels.
--> Visual Order should be set to "Bring to Front" in order to see the color of the candles.
INDICATOR IN ACTION
15 min chart
The indicator work on Heikin Ashi, Candles, Bars, Renko, Line Break, Kagi, and Point & Figure chart.
I hope you find this indicator useful , and please comment or contact me if you like the script or have any questions/suggestions for future improvements. Thanks!
I will continually work on this indicator, so please share your experience and feedback as it will enable me to make even better improvements. Thanks to everyone that has already contacted me regarding my scripts. Your feedback is valuable for future developments!
ACCESS THE INDICATOR
• Contact me on TradingView or use the links below
-----------------
Disclaimer
Copyright by Zeiierman.
The information contained in my scripts/indicators/ideas does not constitute financial advice or a solicitation to buy or sell any securities of any type. I will not accept liability for any loss or damage, including without limitation any loss of profit, which may arise directly or indirectly from the use of or reliance on such information.
All investments involve risk, and the past performance of a security, industry, sector, market, financial product, trading strategy, or individual’s trading does not guarantee future results or returns. Investors are fully responsible for any investment decisions they make. Such decisions should be based solely on an evaluation of their financial circumstances, investment objectives, risk tolerance, and liquidity needs.
My scripts/indicators/ideas are only for educational purposes
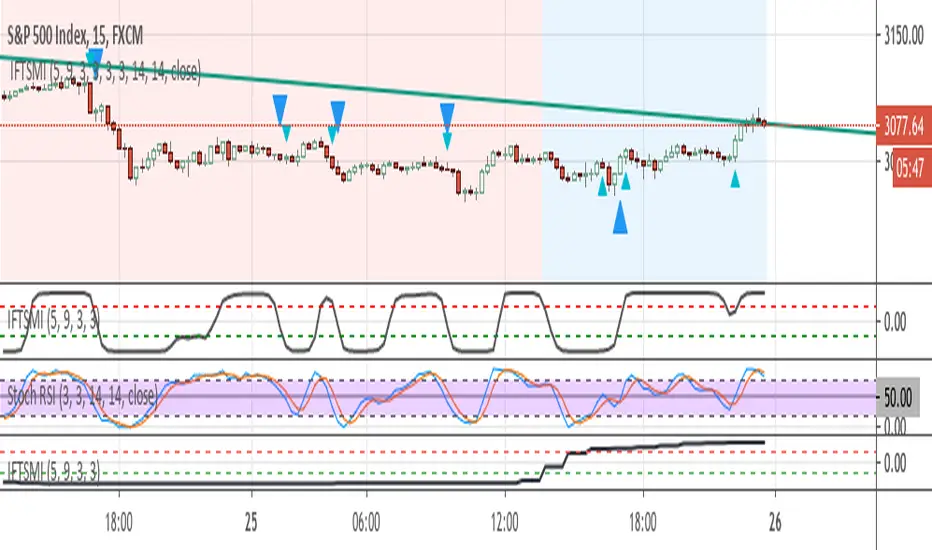
Inverse Fisher Transform of SMI and sto. RSI, MTF confirmedThe system uses 1 hour and 15 min timeframe data. Signals coming from 15 min Inverse Fisher Transform of SMI and stochastic RSI are confirmed by 1 hour Inverse Fisher Transform SMI, according to the following rules:
long cond.: 15 min IFTSMI crosses ABOVE -0.5 or SRSI k-line crosses ABOVE 50 while 1-hour IFTSMI is already ABOVE -0.5
short cond.:15 min IFTSMI crosses BELOW 0.5 or SRSI k-line crosses BELOW 50 while 1-hour IFTSMI is already BELOW 0.5
SMI and Inverse Fisher Transform of SMI codes belong to @kivancozbilgic.
Sto RSI and kijun-sen line to determine and follow the trend This script uses 25-75 treshold of stochastic RSI with the help of kijun-sen as confirmation, to find entry points to any trend either newly developed or an established one. I just realized it on the 1 hour SPX chart. Sure it can be used on other symbols. Crossing above/below 25/75 line of sto RSI is considered as buy/sell signal. Signals are evaluated whether price be above/below kijun-sen line. If a sell signal below kijun-sen is generated it is a continuation signal for downtrend, otherwise it is a countertrend signal (maybe a signal for a new downtrend). A countertrend signal must be evaluated carefully and only accepted in the right side of kijun-sen. e.g entering a sell signal generated above kijun-sen should be accepted only below the kijun-sen, vice-versa.

Trend Follow with kijun-sen/tenkan sen for 1 Hour SPX
This script determines, plots and alerts on probable trend initiation and continuation points, using tenkan-sen(conversion line of ichimoku), kijun-sen(baseline of ichimoku) and stochastic RSI, for 1 H SPX.
New long/short trend initiates when prices cross above/below kijun sen. The trend continues when prices cross above/below tenkan-sen or stochastic RSI crosses up/down its signal line, while prices are above/below kijun-sen.
It is good to take partial profit between 10-15 points gain and trail the left with stops below kijun-sen line.
While placing the order, using 2-3 points buffer above/below of signal bars is recommended. Additionally, please be careful about clouds and do not place long/short orders below/above clouds.

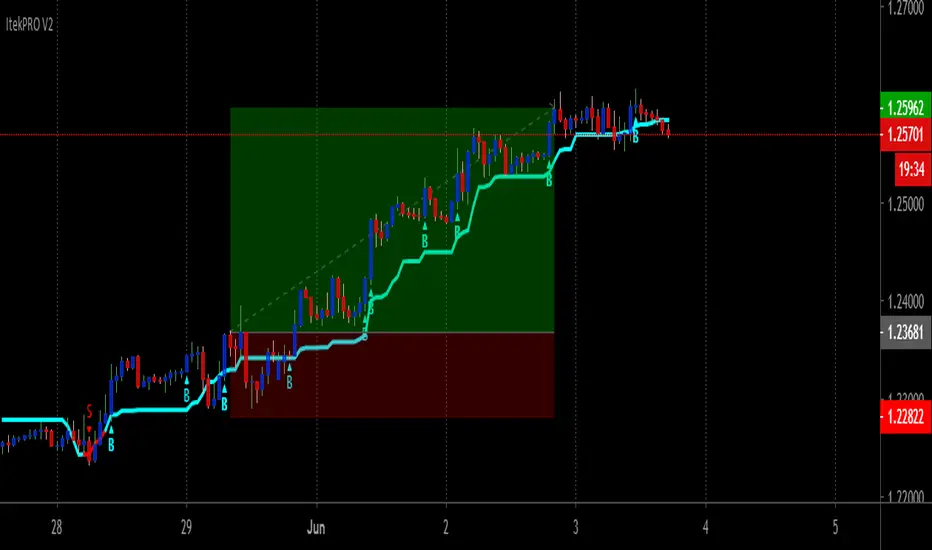
ItekPRO V2Itek PRO V2 Is An New Version of Iteksignal Trading System With Multiple BUY/SELL Entries And Exits That Can Be Used On Any Market!
An efficient way to Trade Manually Rule-Based and safely is with Itek PRO V2, a price action trend continuation Systen Trading.
GREAT for Swing Traders, Position Traders, or Investors. Works on Forex, Crypto, Stocks, Commodities.
This powerful indicator will work on just about ANY symbol and chart so that you can capture either smaller moves, or larger moves.. find the right symbol and time frame for your style of trading and use this amazing strategy to pull profitable trades.
TREND Direction and Trend Turns Are Clearly Indicated With The Built In Color-Coded Trend Line Indicator
When the trend line is BLUE the trend is headed UP, when its RED the trend is headed DOWN, when the trend line is flat it may indicate sideways conditions. The potential TREND TURNS can be seen by the change in the SLOPE and confirm by the change in the COLOR.
Signals produced by the indicator are very easy to read, completely Non-Discretionary.
Here’s How It Works
Entry Signals
Once Itek PRO V2 indicator has spotted an entry point, it clearly displays a Buy or Sell Signal on your chart, showing you exactly where possible entry to continue with the trend or start a new one.
Trade Setup Definitions
· Signal bar: It is the closed bar where the indicator is plotted (Blue or Red dots) in the chart.
· Entry bar: The first bar after the signal bar that reach the high of the Signal bar.
Setup Entry Rules
· Rule 1: Wait for the Signal bar closes. Enter the Long trade 1-2 pips above the high of the signal bar (Opposite for Short).
· Rule 2: If the HIGH of Signal Bar is near an important resistance level enter the trade 1-2 tick above resistance.
Ehlers Market State Indicator [CC]The Market State Indicator was created by John Ehlers (Stocks & Commodities V. 38:06 (8–15)) and this is technically part of three indicators in one so I'm splitting each one to a separate script. This particular indicator was designed for the market state which acts as a trend direction and tells you whether the trend is strong in either direction. Keep in mind that when the indicator rapidly switches then the market is choppy and when it is a steady line then it is a very strong trend. Essentially buy when the indicator line is green and sell when it is red.
Let me know if you would like me to publish other scripts or if you want something custom done!
Note: I'm republishing this because the original script couldn't be found in searches so this will fix that.

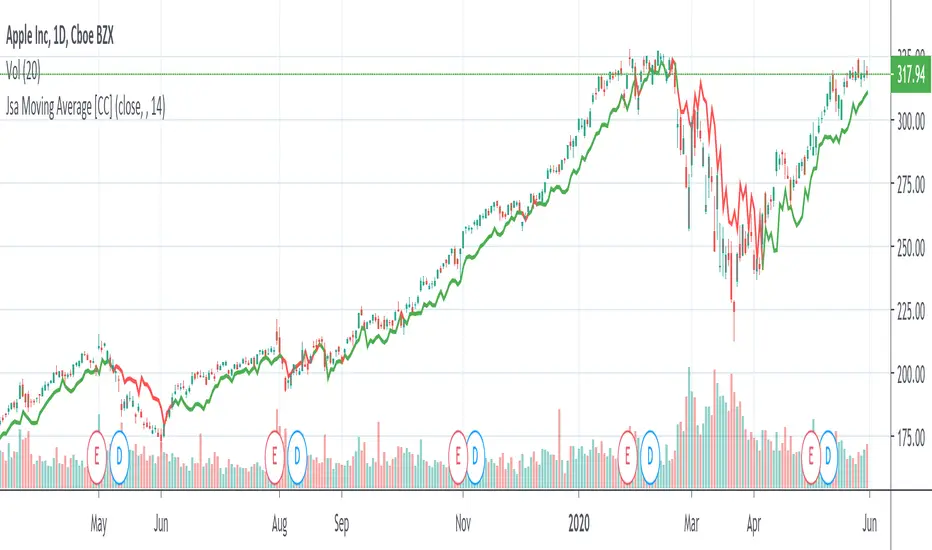
Jsa Moving Average [CC]The Jsa Moving Average was created by George R. Arrington, Ph .D. (Stocks & Commodities V. 11:10 (427-431)) and it is an extremely simple formula but has very many great uses. For one thing it acts as support and resistance levels and it also acts like a trailing stop. It gives a wide enough berth during extended up or down trends to let you ride the wave up or down and when it gets close to the price it means that it is a choppy market. Buy when the indicator line is green and sell when it turns red.
Let me know if you would like to see me publish other indicators or if you want something custom done!
Note: I'm republishing this because the original script couldn't be found in searches so this will fix that.
Trend Analysis IndicatorThe Trend Analysis Indicator was created by Adam White (Stocks & Commodities V. 10:8 (358-360)) and this is not to be confused with the Trend Analysis Index which was also created by Adam White. The stock is trending when it is above the signal and loses steam when it falls below the signal. Generally you should buy when it is above it's signal and sell when it goes below the signal.
Let me know if you would like me to write more scripts!

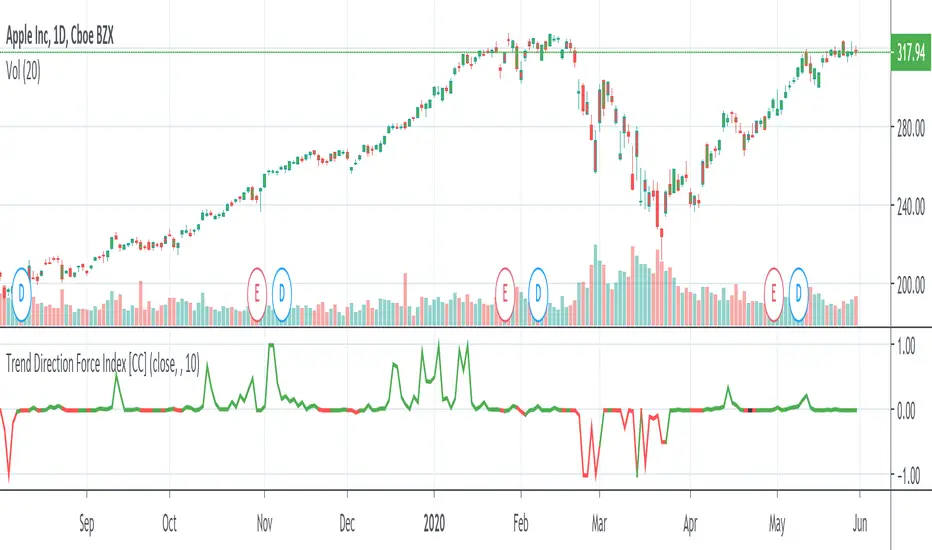
Trend Direction Force IndexThis is my own version of the famous Trend Direction Force Index and I modified the original to make my version react quickly to any trend. I have color coded the indicator to make it extremely easy to read so if it is green then buy and red then sell.
This was a custom request so if you would like more then just send me a message!
Trend Exhaustion IndicatorThe Trend Exhaustion Indicator is a custom indicator of mine that is loosely based on the Trend Exhaustion Index created by Clifford L. Creel Ph.D. (Stocks & Commodities V. 9:1 (9-11))
This indicator will let you know the trend reversal points and when it falls below the signal line then the trend is ending vice versa. Buy when the indicator crosses above the signal line and sell when it falls below the signal line.
Let me know if you would like to see me write any other scripts!

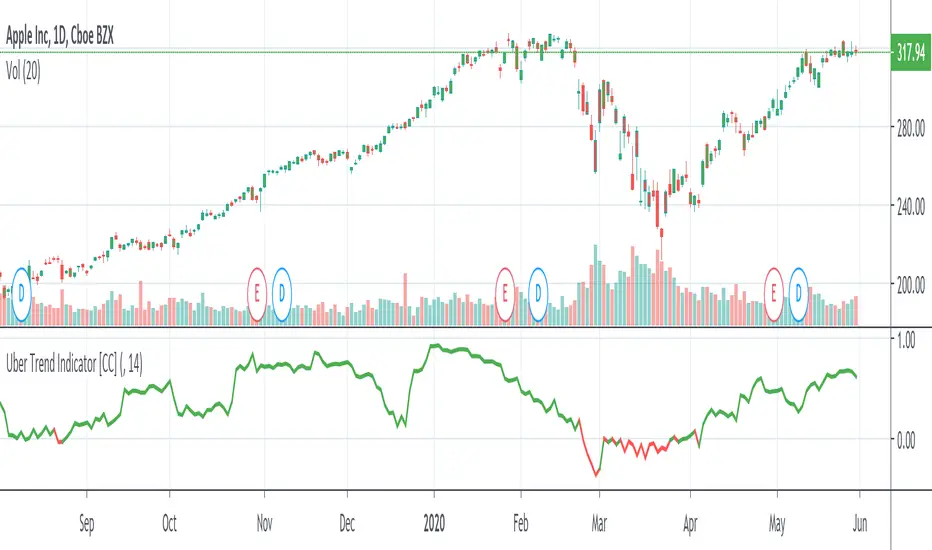
Uber Trend IndicatorThis is my first custom indicator that I created as a medium to long term trend indicator. Buy if it is above 0 and sell if it is below 0.
Since this is my first unique indicator, I would love to hear your feedback! Please let me know if you would like to see any other scripts!