Keltner TrendThis indicator takes the concept of Keltner Channels and uses them as a trend following system by using a deviation band of 1 ATR, such that when the price closes above the upper band a bull trend is predicted to follow, and when the price closes below the lower band the start of a bear trend is assumed.
Only 1 band is plotted at all times depending on the bias of the trend.
Default settings are a 21 EMA as a centerline with a 13 period ATR.
Enjoy!
Trendfollowing

Trend Follow SystemTrend following algorithm:
We take 1- 5 Fibonacci Ema values. 21, 34, 55, 89, 144
2- We normalize the changes of these values over time between 1-100.
3- We take the ema value of 1 length so that it does not follow a horizontal course after the normalization process.
4- In order not to experience too much change, we take the value of sma with a length of 5.
5-We think that when all values are 100, the trend is up, when all values are 0, the trend is down, otherwise the trend is horizontal.

EMAC - Exponential Moving Average Cross - StudyEMAC - Exponential Moving Average Cross - Study
This is the short Study version of EMAC that has been optimized for TradersPost alerts only
For the original full Strategy version with many editable inputs please see EMAC - Exponential Moving Average Cross
For the full Strategy version with the best currently known optimized inputs (average best settings across 26 tickers) please see EMAC - Exponential Moving Average Cross - Optimized


Breakout FinderHelo All,
I got many requests for a Breakout script and here it's. This script searches the breakouts/breakdowns and draw square if there is one.
The options:
"Period" is used to find Pivot Points
"Max Breakout Length" is the maximum length to search breakouts
"Threshold Rate %" is channel width of the breakout area. calculated using highest/lowest of last 300 bars.
"Minimum Number of Tests" is the minimum number of tests that the Price tried to break the S/R level
and some options for coloring and linestyle
Lets see some examples:
in this example "Minimum Number of Tests" is 2 so the Price must have tested to break resistance area 2 times and then it breaks it as seen in the screenshot:
in following example Threshold rate is %10, so the channel width is very big:
as you can see in followinf screenshot you can choose different colors and line styles:
Alerts added ;)
Enjoy!

MTF Trend WidgetThis indicator identifies trends in multiple higher timeframes (D, W, M) and shows them in a widget off to the right of the chart.
It's meant to be used as an alternative filter for "trading with the trend." Typically people use moving averages of varying lengths for this (i.e. if over 200 MA it's an uptrend, etc.), but I wanted to see if it might be more effective to see if the higher timeframes were actually trending or not in a certain direction.
For the purposes of this indicator, an uptrend is defined as higher highs and higher lows. So if currently in a downtrend and the highs are broken, the indicator will flip to an uptrend because now we have a higher high. Vice versa for downtrends.
The user can choose the lookback period for defining these highs/lows (the pivot points). A smaller lookback number will give you more frequent pivot points.
The user can toggle on visibility of all historical pivot points to make sure the frequency and placement of the swing highs/lows is to their liking.
The user can show the support/resistance lines of those most recent swing high/low points on the multiple timeframes as well.
When these lines are breached, that is when the trends change, so you can see if you are close to changing any longer term trends.
My hope is that this gives people a quick glance at the overall trend without having to cycle through different timeframes.

Indicator PanelHello All,
This script shows Indicator panel in a Table. Table.new() is a new feature and released today! Thanks a lot to Pine Team to add this new great feature! This new feature is a game changer!
The script shows indicator values for each symbol and changes background color of each cell by using current and last values of the indicators for each symbol. if current value is greater than last value then backgroung color is green, if lower than last value then red, if they are equals then gray.
You can choose the indicators to display. Number of columns in the table is dynamic and is changed by number of the indicators.
You can choose 5 different Symbols, 6 Indicators and 2 Simple or Exponential Moving averages, you can set type of moving averages and the lengths. You can also set the lengths for each Indicators.
Indicators:
- RSI
- MACD ( MACD and Signal and Histogram )
- DMI ( +DI and -DI + and ADX )
- CCI
- MFI
- Momentum
- MA with Length 50 (length can be set)
- MA with Length 200 (length can be set)
In this example RSI, MACD and MA 200 were chosen, you can see how table size changes dynamically:
Enjoy!

BAM's Weighted ROCTraders,
BAM's Weighted ROC is a Momentum indicator. ROC stands for 'Rate of Change' therefor this indicator plots the reading of a weighted average Rate of Change. In its current form it uses 4 periods en 4 weightings. The periods are set to 21/63/126/252 which corresponds to the number of trading days in each 1/3/6/12 months. The weightings are set to emphasize the more recent periods where the 1-month period counts for 40% of the signal, the 3-monthh period for 30%, the 6-month for 20% and the 12-month for 10%. These settings, both periods and weightings, are customizable. The current settings are meant to serve the widely used 1-day time interval chart setting. Feel free to alter the time frame and adjust the parameters accordingly; eg I like trading the weekly chart on a 10/20/30/40 period settings.
BAM's Weighted ROC can be used as a trendfilter for Trend Following trading systems or as an entry signal for Swing trading systems, or both. In the current setting the indicator is set to trend-following; it turns green when positive (above 0), indicating positive momentum. And red when negative (below 0), indicating negative momentum. In the most basic form one can trade a well diversified portfolio of assets using the indicator as guidance for entry and exit signals as it flows back and forth between positive and negative. Another use for the indicator lies in Swing Trading systems. In this approach the transfer from declining momentum into ascending momentum can be interpreted as a shift in momentum from negative to positive, and therefor constitute an entry opportunity. A combination of the 2 signals is of perfectly viable too, wait for positive momentum (reading above 0) in combination with a upward shift from one bar to the other. Use the reverse logic as an exit signal. In these examples the indicator is used in a stand-alone fashion. But off course it can also be used in conjunction with other indicators.
I personally use the two functions, trend-following en swingtrading, in tandem (combined)
for further reading into the rational behind Trend Following trading systems I recommend the following sources:
- Free Read: Google for 'Meb Faber, Global Asset Allocation' he gives out free copies on his website. Meb is a well known character in the Momentum-factor arena.
- Easy read: 'Following the trend' By Andreas Clenow. I don't think there is any Trend Following trader that doesn't know this chaps work.
- sophisticated Read: Trend Following with Managed Futures by A. Greyserman and K. Kaminski. This one is for those who seriously mean business!
Good luck out there, pls consider that the momentum factor holds an edge, at least based on historical performance, but this out-performance (most often) lies in the low single digits.
Pls be aware that use of this indicator is at your own risk. All info provided is solely presented for educational purposes.
Kind regards,
Bam

RSI Trend Indicator [paRSI]The Relative Strength Index ( RSI ) is a measurement used by traders to assess the price momentum. It is scaled from 0 to 100. when RSI reads below 30, it is usually interpreted as oversold and when RSI is above 70 it is usually interpreted as overbought. However, it is usually not profitable to trade based on overbought and oversold signal.
RSI Trend Indicator or as I like to call it "paRSI" ("Parsa (my name) + RSI") shows that when RSI is above a specific number (default value = 60) it indicates bullish trend and when RSI is below a specific number (default value = 40 ) it indicates bearish trend. Lastly when RSI is below the 2 specified numbers it indicates a neutral trend.
I don't recommend trading based on this single indicator. If you're a trend trader this might be useful tool in addition to your own strategy
Usage:
If the created pattern has worked previously on the chart, you could enter on the first stages of the green or red section (depending on the market's trend).
It is not recommended to trade in any direction when there is no color
*THIS IS A TREND FOLLOWING STRATEGY AND DOES NOT WORK ON ALL MARKETS*

Support Resistance ChannelsHello All,
For Long time I was planning to make Support/Resistance Channels script, finally I had time and here it is.
How this script works?
- it finds and keeps Pivot Points
- when it found a new Pivot Point it clears older S/R channels then;
- for each pivot point it searches all pivot points in its own channel with dynamic width
- while creating the S/R channel it calculates its strength
- then sorts all S/R channels by strength
- it shows the strongest S/R channels, before doing this it checks old location in the list and adjust them for better visibility
- if any S/R channel was broken on last move then it gives alert and put shape below/above the candle
- The colors of the S/R channels are adjusted automatically
You can set/change following settings:
- Pivot Period
- Source : High/Low or Close/Open can be used
- Maximum Channel Width %: this is the maximum channel width rate, this is calculated using Highest/Lowest levels in last 300 bars
- Number of S/R to show : this is the number of Strongest S/R to show
- Loopback Period: While calculating S/R levels it checks Pivot Points in LoopBack Period
- Show S/R on last # Bars: To see S/R levels only on last N bars
- Start Date: the script starts calculating Pivot Point from this date, the reason I put this option is for visuality. Explained below
- You can set colors/transparency
- and You can enable/disable shapes for broken S/R levels
Examples:
You can change colors as you wish:
here " Show S/R on last # Bars " set 100:
Sometimes visuality may corrupt because of old S/R levels, to solve it you need to set "Start Date" in the options to start the script in visual part (last 292 bars)
here in first screenshot it doesn't look good (shrink), then on second screenshot I set the "Start Date" it looks better, if you change time frame don't forget to set it again :)
Enjoy!

Robust Channel [tbiktag]Introducing the Robust Channel indicator.
This indicator is based on a remarkable property of robust statistics , namely, the resistance to the presence of data points that deviate significantly from the established trend (generally speaking, outliers ). Being outlier-resistant, the Robust Channel indicator “remembers” a pre-existing trend and thus exhibits a very peculiar "lag" in case of a sharp price change. This allows high-confidence identification of such price actions as a trend reversal, range break, pullback, etc.
In the case of trending and range-bound market conditions, the price remains within the channel most of the time, fluctuating around the central line.
Technical details
The central line is calculated using the repeated median slope algorithm. For each data point in a lookback window of a user-specified Length , this method calculates the median slope of the lines that connect that point to all other points inside the window. The overall median of these median slopes is then calculated and used as an estimate of the trend slope. The algorithm is very efficient as it uses an on-the-fly procedure to update the array containing the slopes (new data pushed - old data removed).
The outer line is then calculated as the central line plus the Length -period standard deviation of the price data multiplied by a user-defined Channel Width Factor . The inner line is defined analogously below the central line.
Usage
As a stand-alone indicator, the Robust Channel can be applied similarly to the Bollinger Bands and the Keltner Channel:
A close above the outer line can be interpreted as a bullish signal and a close below the inner line as a bearish signal.
Likewise, a return to the channel from below after a break may serve as a bullish signal, while a return from above may indicate bearish sentiment.
Robust Channel can be also used to confirm chart patterns such as double tops and double bottoms.
If you like this indicator, feel free to leave your feedback in the comments below!

EMA 3/5/10/20/50/100/200Trend follow the fastest moving stocks with the right EMAs to trail your stops.

Divergence for Many Indicators v4Hello Traders,
Here is my new year gift for the community, Digergence for Many Indicators v4 . I tried to make it modular and readable as much as I can. Thanks to Pine Team for improving Pine Platform all the time!
How it works?
- On each candle it checks divergences between current and any of last 16 Pivot Points for the indicators.
- it search divergence on choisen indicators => RSI , MACD , MACD Histogram, Stochastic , CCI , Momentum, OBV, VWMACD, CMF and any External Indicator !
- it checks following divergences for 16 pivot points that is in last 100 bars for each Indicator.
--> Regular Positive Digergences
--> Regular Negative Digergences
--> Hidden Positive Digergences
--> Hidden Negative Digergences
- for positive divergences first it checks if closing price is higher than last closing price and indicator value is higher than perious value, then start searching divergence
- for negative divergences first it checks if closing price is lower than last closing price and indicator value is lower than perious value, then start searching divergence
Some Options:
Pivot Period: you set Pivot Period as you wish. you can see Pivot Points using "Show Pivot Points" option
Source for Pivot Points: you can use Close or High/Low as source
Divergence Type: you can choose Divergence type to be shown => "Regular", "Hidden", "Regular/Hidden"
Show Indicator Names: you have different options to show indicator names => "Full", "First Letter", "Don't Show"
Show Divergence Number: option to see number of indicators which has Divergence
Show Only Last Divergence : if you enable this option then it shows only last Positive and Negative Divergences
you can include any External Indicator to see if there is divergence
- enable "Check External Indicator"
- and then choose External indicator name in the list, "External Indicator"
- External indicator name is shown as Extrn
- related external indicator must be added before enabling this option
Coloring, line width and line style options for different type of divergences.
Following Alerts added:
- Positive Regular Divergence Detected
- Negative Regular Divergence Detected
- Positive Hidden Divergence Detected
- Negative Hidden Divergence Detected
Now lets see some examples:
Hidden Divergences:
Regular and Hidden Divergences together:
Showing first letters of indicators:
You can see only the number of indicators which has divergence:
You can see only divergence lines without indicators names and numbers:
option to used different label/line/text colors:
You have option to see only last divergences:
You can change Pivot Period, in following example Pivot Period = 15:
You can use Close or High/Low as Source for Divergence
You can include external indicators and get divergences on it:
Wish you all a happy new year!
Enjoy!

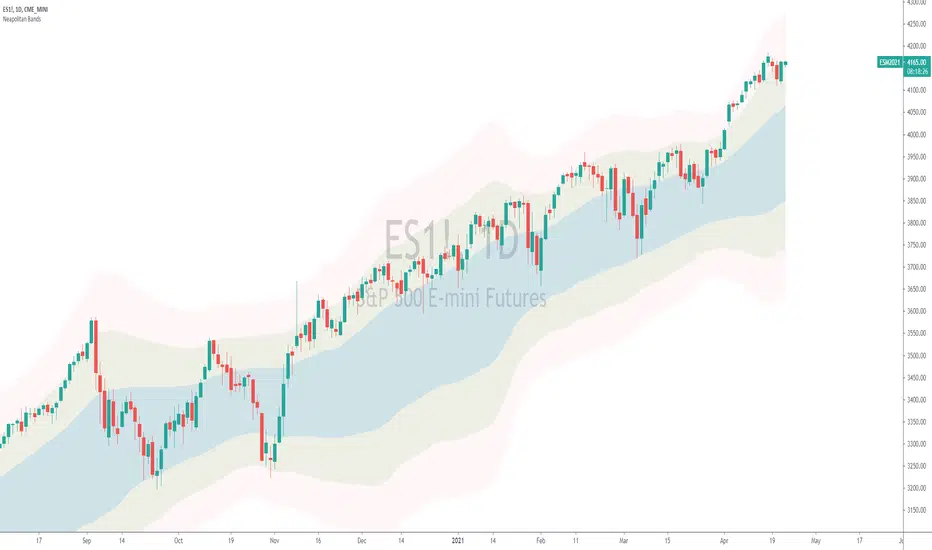
Neapolitan BandsThe Neapolitan Bands were derived from Jean Marc Guillot's 2001 IFTA trading strategy. In his study published by the International Federation of Technical Analysis titled, "Using Indicators from the Derivatives Markets to Forecast FX Moves" Guillot utilizes multiple bollinger bands of various deviations to determine trends and reversals, entries and exits. I isolated this particular part of his overall trading strategy because it has been a useful trend following indicator for me.
Some basics:
Neapolitan Bands can help identify points that a trend starts and ends, as well as reversals when price is ranging.
These bands are typically paired with another indicator like Guillot did to help separate/time trend or reversal signals. (He used MACD, Slow Stochastic, and RSI)
Parts of this indicator:
The period is by default 55 to identify "intermediate" trends. Not short or long term ones.
The blue area shows the 1st standard deviation. This is the "normal range" where price "likes" to be.
The green area shows the 2nd standard deviation and identifies/defines trends. Closes in this area are used for entering trends long or short.
The red area shows the 3rd standard deviation that shows either a spot to take profit/enter a reversal trade, or a point where the market is free falling.
Trend trading rules:
Entry and exit signals for trends are based on price closing above and below the 1st standard deviation, or blue area. If you expect a bullish trend, you buy once price enters the upper green area.
Guillot recommends setting a stop loss to the MA period of the Neapolitan Bands. So if it's 55 periods, you set the stop loss at the 55 SMA.
Reversal trading rules:
For reversals Guillot says, "In a trading range, bands act as supports and resistances. In extreme conditions reversals can occur within or past the 2nd standard deviation." For us, this means that technically anywhere in the green or red areas, a reversal can occur when the price is ranging. Typically this happens at the edges of the bands.
The "edge to edge" trade:
This is a strategy I took from Ichimoku Clouds and applied to the Neapolitan Bands. An "edge to edge" trade is when price closes back into the blue area from one edge, and price travels all the way to the other edge of the blue area. This can apply going from the edge of one green area to the other edge.
Note that this is one piece of Guillot's trading system, and not the whole thing. On top of that I have modified the original parameters to suit the function of trend following, and added an extra bollinger band. Using a shorter period like 20 is more optimal for shorter expected trends or reversals, and it's what Guillot used himself.
Thanks to Sean Nance for reminding me the indicator looks like ice cream! ( coming up with the name :P )
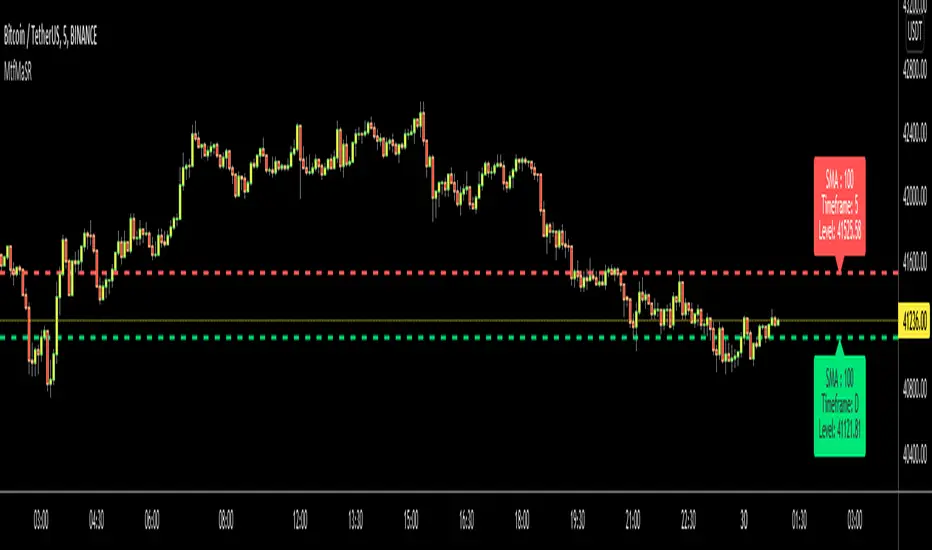
Moving Averages as Support Resistance MTFHello Traders!
As most of you know that Moving Averages with the lengths 50, 100, 150 and 200 are very important. We should use these this moving averages to figure out S/R levels, the possible reversals points, trend direction etc. we should check these moving averages on Higher Time Frames as well. for example if you look at the chart with 5mins time frame, you should also check it in 1hour and 4hour time frames to see to big picture and main trend. this is important as trend is your friend and you should not take positions against the trend.
I developed this script to show them clearly and make the chart understandable. 1 resistance line above the price and 1 support line below the price, it shows the moving average type, length, time frame and S/R level.
You have option to show SMA or EMA and to include/exclude current time frame, because you may want to see only MAs from higher time frames. you should set higher time frames accordingly.
if you add all moving averages for current and higher time frame the chart looks very crowded as following example:
The script makes it clear to understand the chart better, here an example:
It can show when S/R was broken and you get alert. here an example:
You have coloring and style options, you can change line style and colors as you wish:
Enjoy!
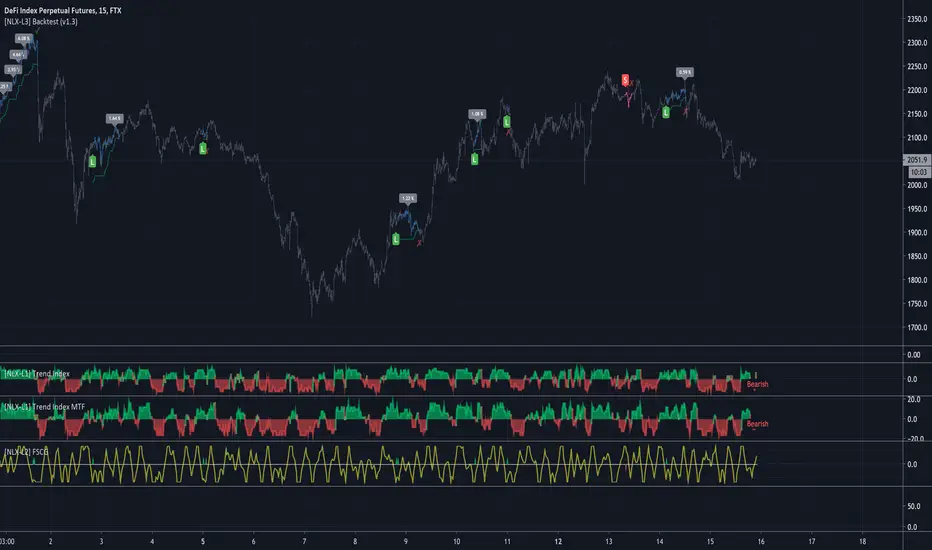
[NLX-L1] Trend Index- NLX Modular Trading Framework -
This module is build upon the Trend Index by Mango2Juice (thanks for your permission to use the source!)
It includes all the common indicators and creates a positive or negative score, which can be used with my Modular Trading Framework and linked to an entry/exit indicator.
SuperTrend
VWAP Bands
Relative Strength Index ( RSI )
Commodity Channel Index ( CCI )
William Percent Range (WPR)
Directional Movement Index (DMI)
Elder Force Index ( EFI )
Momentum
Demarker
Parabolic SAR
... and more
- Getting Started -
1. Add this Trend Index to your Chart
2. Add one of my Indicator Modules to your Chart, such as the QQE++ Indicator
3. In the QQE Indicator Settings combine it with the Trend Index (and choose L1 Type)
4. Optional: Add the Noise Filter , and in the Noise Filter Settings you select the QQE Indicator as combination (and choose L2 for Type)
5. Add the Backtest Module to your Chart
6. Select the Noise Filter in the Backtest Settings
Indicator modules can be combined in many different ways in my framework - have fun!
- Alerts for Automated Trading -
The alerts module is coming soon and you will be able to create alerts to automated your trades.
See my signature below for more information.
Multi Time Frame CandlesHello Traders,
This script can show (upto) 3 candles of another time frames without changing chart time frame realtime . You can choose the time frame and number of candles in the options. You have option to change body and wick colors as well.
in this example number of candles is 2:
You can set body and wick colors:
In this example, weekly candles are shown on 1h chart:
Enjoy!

RSI TrendsRSI is a momentum indicator, however most people seem to be using it to go against the momentum by trying to identify tops/bottoms using it. Its in my opinion the wrong way to be using it. It can be easily used for trend following which seems like a better use for it.
Uptrend - RSI > 60
Downtrend - RSI < 40
Sideways - RSI between 40 and 60
If however not interested in filtering for sideways trends and convert it to a long-short only strategy that stays in market all the time then it can be simply modified by setting both overbought/oversold thresholds to 50. In such a case uptrend will be above 50 and downtrend will be less than 50.
Note: wait for close for current bar to be confirmed as RSI is calculated at close

Support Resistance - Aging [Example]Hello All,
First all of Thanks to Pine Team for adding Arrays to Pine!
In this script I tried to make example for
1. Finding S/R lines using highest/lowest function
2. Using 1D array as 2D (we keep S/R levels and age)
3. "Age" usage for S/R levels, getting older on each candle and changing colors by their age (maximum age is 127 then it disappears)
You can use "Close"/Open " or " High/Low " as source.
There is an option for the background color, by default it's Black, do not forget to set it accordingly :)
Enjoy!

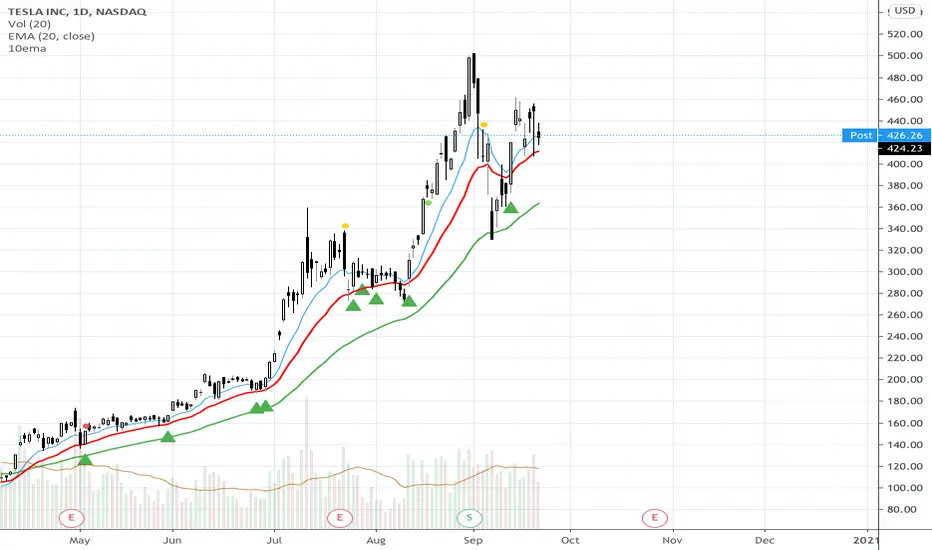
10ema Basic Swing Trade StrategySTRATEGY INGREDIENTS
* DAILY chart
* 10 ema on daily
* 50 ema on daily
STRATEGY RECIPE SUMMARY
Wait for a CLOSE BELOW the 10 ema on the daily chart ...YESTERDAY. Wait for a CLOSE ABOVE the 10ema TODAY...ensure the price action is ABOVE the 50 ema on the daily chart ...buy at the close if the green arrow indicator is shown. Be sure to get your order filled BEFORE the market closes -- if you are using directional options...b/c you know, the options market doesn't have after hours.
BE AWARE of your own risk tolerance...step stops at appropriate levels...Take responsibility for your own trades. BACKTEST this strategy before using a LIVE MONEY TRADING ACCOUNT.
Support Resistance - Dynamic v2Hello Traders!
After the addition of "Arrays" to the Pine, I developed new and improved version of Support Resistance - Dynamic script as version 2. In this script Arrays were used. This can be used as Support Resistance tool, also it will be an example for the people who want to learn Array usage in Pine. Many thanks to Pine Team for adding Arrays!
The script finds the Pivot Points and check them in channels if there can be S/R or not, and draws mid line of the channel as S/R line. you can set number of PPs and channel width in the options. Each channel width is optimized dynamically according to Pivot Points. Also you can choose " High/Low " or " Close/Open " as source for Pivot Points.
There is an option for maximum number of S/R levels. S/R levels are found and sorted dynamically and number of S/R lines with enough strength changes dynamically.
Some other options for coloring and line width. (Solid, Dashed or Dotted)
S/R levels are shown in the Labels and Label colors are changed automatically, if S/R line is below the closing price then it's color is Green (as Support), otherwise its color is Red (as Resistance).
Examples:
Enjoy!

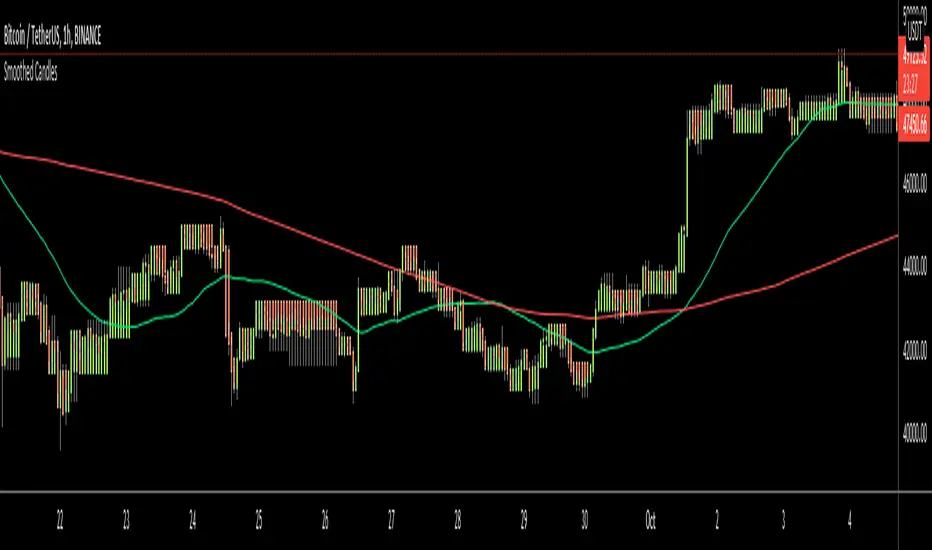
Smoothed CandlesHello Traders,
This is " Smoothed Candles " script to get rid of noises and to get a smoothed chart to figure out breakouts and price movements easily.
There are three scaling methods: User Defined, Dynamic (ATR) and Percentage
Optionally you can add 2 Simple Moving Averages and 2 Exponential Moving Averages
Optionally you can hide the Wicks, example:
You can add moving averages:
Easily find breakouts:
Enjoy!
Higher Timeframe Trend Indicator V3.0What is it?
An indicator that depicts the trend of up to 5 higher timeframes on the same chart without needing to context-switch between charts.
Features
- Supports up to 5 timeframes
- Trends indicated by 5 colored buttons: one for each timeframe
- Varying shades of green: uptrend
- Varying shades of red: downtrend
- White/silver: sideways/neutral
- Configurable length (time period) for each timeframe
- Increase length to capture long term trends; decrease it to capture only short term ones
- Configurable sensitivity for each timeframe
- Sensitivity determines what angle is considered trending and what is not
- Increase sensitivity to capture weak trends
- Decrease sensitivity to filter out weak trends and capture only strong/steep ones
- Sensitivity ranges from 1 (least sensitive) to 3 (most sensitive)
- Move the labels around vertically for better visibility by changing the "Location" and "Offset" parameters
How should one use it?
Use it to quickly browse through charts to understand the context across timeframes, and zero in on only those that have trends aligning on the higher and lower timeframes as per your strategy. For e.g., a chart that is trending up strongly on the 15min and 60min (indicated by dark green colored buttons), and trending down on the 1 and/or 5 min (indicated by red-colored buttons), can be shortlisted for a potential pullback trade. Use your favorite pullback strategy (Supply/Demand, Support/Resistance, Moving Averages, etc.) to hop in on the trend.
How are trends determined?
The indicator uses normalized %change in price of the linear regression line segment of the chosen price sources (close, high, low, MA, etc.) over a specified length to determine trend direction and intensity
Known Issues
Will indicate the trend correctly only for timeframes *higher* than the current (visible) resolution/timeframe of the chart. Might not indicate it correctly for lower timeframes ( i.e., lower than the current (visible) resolution/timeframe of the chart). For this reason, all timeframes lower than the current resolution will be hidden in the present release.
Future releases
- I am still experimenting with various sensitivity levels and the corresponding trend shades to make the tool as accurate and intuitive as possible. These modifications might come in
- Sensitivity levels might be increased.
- Bug fixes, if any
