Rob Booker - ADX Breakout updated to pinescript V5Rob Booker - ADX Breakout. The strategy remains unchanged but the code has been updated to pinescript V5. This enables compatibility with all new Tradingview features. Additonally, indicators have been made more easily visible, default cash settings as well as input descriptions have been added.
Rob Booker - ADX Breakout: (Directly taken from the official Tradingview V1 version of the script)
Definition
Rob Booker’s Average Directional Index (ADX) Breakout is a trend strength indicator that affirms the belief that trading in the direction of a trend and continuing to follow its pull is more profitable for traders, while simultaneously reducing risk.
History
ADX was traditionally used and developed to determine a price’s trend strength. It is commonly known as a tool from the arsenal of Rob Booker, experienced entrepreneur and currency trader.
Calculations
Calculations for the ADX Breakout indicator are based on a moving average of price range expansion over a specific period of time. By default, the setting rests at 14 bars, this however is not mandatory, as other periods are routinely used for analysis as well.
Takeaways
The ADX line is used to measure and determine the strength of a trend, and so the direction of this line and its interpretation are crucial in a trader’s analysis. As the ADX line rises, a trend increases in strength and price moves in the trend’s direction. Similarly, if the ADX line is falling, a trend decreases in strength and price then enters a period of consolidation, or retracement.
Traditionally, the ADX is plotted on the chart as a single line that consists of values that range from 0-100. The line is non-directional, meaning that it always measures trend strength regardless of the position of a price’s trend (up or down). Essentially, ADX quantifies trend strength by presenting in both uptrends and downtrends of the line.
What to look for
The values associated with the ADX line help traders determine the most profitable trades and where risk lies in the current trend. It is important to know how to quantify trend strength and distinguish between the varying values in order to understand the differences in trending vs. non-trending conditions. Let’s take a look at ADX values and what they mean for trend strength.
ADX Value:
0-25: Signifies an absent of weak trend
25-50: Signifies a strong trend
50-75: Signifies a very strong trend
75-100: Signifies an extremely strong trend
To delve into this a bit further, let’s assess the meaning of ADX if it is valued below 25. If the ADX line remains below 25 for more than 30 or so bars, price then enters range conditions, making price patterns more distinguishable and visible to traders. Price will move up and down between resistance and support in order to determine selling and buying interest and may then eventually break out into a trend or pattern.
The way in which ADX peaks, ebs, and flows is also a signifier of its overall pattern and trend momentum. The line can clearly indicate to the trader when trend strength is strong versus when it is weak. When ADX peaks are pictured as higher, it points towards an increase in trend momentum. If ADX peaks are pictured as lower - you guessed it - it points towards a decrease in trend momentum. A trend of lower ADX peaks could be a warning for traders to watch prices and manage and assess risk before a trade gets out of hand. Similarly, whenever there is a sudden move that seems out of place or a change in trend character that goes against what you’ve seen before, this should be a clear sign to watch prices and assess risk.
Summary
The ADX Breakout indicator is a trend strength indicator that analyzes price movements relative to trend strength to signal a user when is best for a trade and when is best to manage risk and assess patterns. As long as a trader recognizes strong trends and assesses the risk of each trade properly, they should have no problem using this indicator and utilizing it to work in their favor. In addition, the ADX helps identify trending conditions, but while doing so, also aids traders in finding strong trends to trade. The indicator can even alert traders to specific changes in trend momentum, allowing them to be primed for risk management.
Trendfollowing

tvbot Trend Following with Mean Reversion algoDefault settings are for the ETHUSDT 5 min Binance Chart regular candles.
Back test Default settings are 10,000 usd to start, Commission 0.075%, capital deployment per position is 10%, slippage value of 1.
This algo uses the EMA to set the trend line . You are also able to turn the trend line into a range instead of just a static line. The algo uses the VWMA to set the base entry parameters. When a candle closes above or below the VWMA it will record that price and then wait for the VWMA to meet the candle close price. When that happens the Base entry condition is met. (it causes the vwma to create a hook like structure. essentially tell you that the momentum has changed directions.)
The algo will always check to see if the trend line has either breached or has been tested and held. If this condition has been met it will then go to the base entry condition to check to see if the momentum has changed.
There is a mean reversion component in this algo as well. When the price has moved away from the mean(set by user) by a certain amount the algo will start to look for a top or bottom. Once that condition has been met it will then use the base entry condition to look for a change in momentum, but the mean reversion base entry condition uses the HMA to check for a change in momentum.
This algo effectively looks like a hamburger. Mean reversion being the tops and bottoms(bun) and the trend following(beef patty)

Rate Of Change Trend Strategy (ROC)This is very simple trend following or momentum strategy. If the price change over the past number of bars is positive, we buy. If the price change over the past number of bars is negative, we sell. This is surprisingly robust, simple, and effective especially on trendy markets such as cryptos.
Works for many markets such as:
INDEX:BTCUSD
INDEX:ETHUSD
SP:SPX
NASDAQ:NDX
NASDAQ:TSLA

EMA bands + leledc + bollinger bands trend following strategy v2The basics:
In its simplest form, this strategy is a positional trend following strategy which enters long when price breaks out above "middle" EMA bands and closes or flips short when price breaks down below "middle" EMA bands. The top and bottom of the middle EMA bands are calculated from the EMA of candle highs and lows, respectively.
The idea is that entering trades on breakouts of the high EMAs and low EMAs rather than the typical EMA based on candle closes gives a bit more confirmation of trend strength and minimizes getting chopped up. To further reduce getting chopped up, the strategy defaults to close on crossing the opposite EMA band (ie. long on break above high EMA middle band and close below low EMA middle band).
This strategy works on all markets on all timeframes, but as a trend following strategy it works best on markets prone to trending such as crypto and tech stocks. On lower timeframes, longer EMAs tend to work best (I've found good results on EMA lengths even has high up to 1000), while 4H charts and above tend to work better with EMA lengths 21 and below.
As an added filter to confirm the trend, a second EMA can be used. Inputting a slower EMA filter can ensure trades are entered in accordance with longer term trends, inputting a faster EMA filter can act as confirmation of breakout strength.
Bar coloring can be enabled to quickly visually identify a trend's direction for confluence with other indicators or strategies.
The goods:
Waiting for the trend to flip before closing a trade (especially when a longer base EMA is used) often leaves money on the table. This script combines a number of ways to identify when a trend is exhausted for backtesting the best early exits.
"Delayed bars inside middle bands" - When a number of candle's in a row open and close between the middle EMA bands, it could be a sign the trend is weak, or that the breakout was not the start of a new trend. Selecting this will close out positions after a number of bars has passed
"Leledc bars" - Originally introduced by glaz, this is a price action indicator that highlights a candle after a number of bars in a row close the same direction and result in greatest high/low over a period. It often triggers when a strong trend has paused before further continuation, or it marks the end of a trend. To mitigate closing on false Leledc signals, this strategy has two options: 1. Introducing requirement for increased volume on the Leledc bars can help filter out Leledc signals that happen mid trend. 2. Closing after a number of Leledc bars appear after position opens. These two options work great in isolation but don't perform well together in my testing.
"Bollinger Bands exhaustion bars" - These bars are highlighted when price closes back inside the Bollinger Bands and RSI is within specified overbought/sold zones. The idea is that a trend is overextended when price trades beyond the Bollinger Bands. When price closes back inside the bands it's likely due for mean reversion back to the base EMA in which this strategy will ideally re-enter a position. Since the added RSI requirements often make this indicator too strict to trigger a large enough sample size to backtest, I've found it best to use "non-standard" settings for both the bands and the RSI as seen in the default settings.
"Buy/Sell zones" - Similar to the idea behind using Bollinger Bands exhaustion bars as a closing signal. Instead of calculating off of standard deviations, the Buy/Sell zones are calculated off multiples of the middle EMA bands. When trading beyond these zones and subsequently failing back inside, price may be due for mean reversion back to the base EMA. No RSI filter is used for Buy/Sell zones.
If any early close conditions are selected, it's often worth enabling trade re-entry on "middle EMA band bounce". Instead of waiting for a candle to close back inside the middle EMA bands, this feature will re-enter position on only a wick back into the middle bands as will sometimes happen when the trend is strong.
Any and all of the early close conditions can be combined. Experimenting with these, I've found can result in less net profit but higher win-rates and sharpe ratios as less time is spent in trades.
The deadly:
The trend is your friend. But wouldn't it be nice to catch the trends early? In ranging markets (or when using slower base EMAs in this strategy), waiting for confirmation of a breakout of the EMA bands at best will cause you to miss half the move, at worst will result in getting consistently chopped up. Enabling "counter-trend" trades on this strategy will allow the strategy to enter positions on the opposite side of the EMA bands on either a Leledc bar or Bollinger Bands exhaustion bar. There is a filter requiring either a high/low (for Leledc) or open (for BB bars) outside the selected inner or outer Buy/Sell zone. There are also a number of different close conditions for the counter-trend trades to experiment with and backtest.
There are two ways I've found best to use counter-trend trades
1. Mean reverting scalp trades when a trend is clearly overextended. Selecting from the first 5 counter-trend closing conditions on the dropdown list will usually close the trades out quickly, with less profit but less risk.
2. Trying to catch trends early. Selecting any of the close conditions below the first 5 can cause the strategy to behave as if it's entering into a new trend (from the wrong side).
This feature can be deadly effective in profiting from every move price makes, or deadly to the strategy's PnL if not set correctly. Since counter-trend trades open opposite the middle bands, a stop-loss is recommended to reduce risk. If stop-losses for counter-trend trades are disabled, the strategy will hold a position open often until liquidation in a trending market if th trade is offsides. Note that using a slower base EMA makes counter-trend stop-losses even more necessary as it can reduce the effectiveness of the Buy/Sell zone filter for opening the trades as price can spend a long time trending outside the zones. If faster EMAs (34 and below) are used with "Inner" Buy/Zone filter selected, the first few closing conditions will often trigger almost immediately closing the trade at a loss.
The niche:
I've added a feature to default into longs or shorts. Enabling these with other features (aside from the basic long/short on EMA middle band breakout) tends to break the strategy one way or another. Enabling default long works to simulate trying to acquire more of the asset rather than the base currency. Enabling default short can have positive results for those high FDV, high inflation coins that go down-only for months at a time. Otherwise, I use default short as a hedge for coins that I hold and stake spot. I gain the utility and APR of staking while reducing the risk of holding the underlying asset by maintaining a net neutral position *most* of the time.
Disclaimer:
This script is intended for experimenting and backtesting different strategies around EMA bands. Use this script for your live trading at your own risk. I am a rookie coder, as such there may be errors in the code that cause the strategy to behave not as intended. As far as I can tell it doesn't repaint, but I cannot guarantee that it does not. That being said if there's any question, improvements, or errors you've found, drop a comment below!

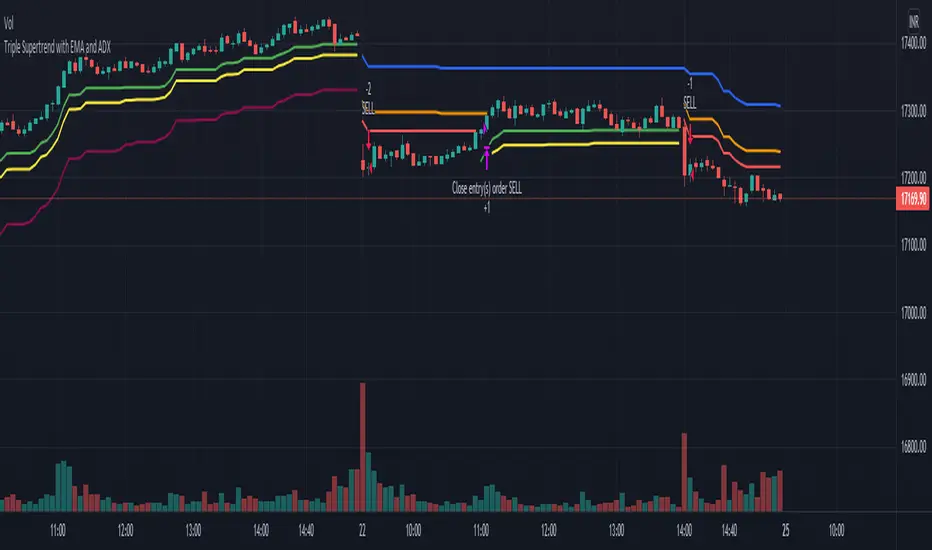
Triple Supertrend with EMA and ADX strategyPublishing a strategy that includes adx and ema filter as well
Entry: all three Supertrend turns positive. If a filter of ADX and EMA is applied, also check if ADX is above the selected level and close is above EMA
Exit: when the first supertrend turns negative
opposite for short entries
A FIlter is given to take or avoid re-enter on the same side. For example, After a long exit, if the entry condition is satisfied again for long before the short single is triggered it takes re-entry if selected.
"Buy signal" from Cipher B for 3commasThis is another modification for cipher B indicator from VuManChu. I also would like to acknowledge "The Art of Trading" channel in youtube for their mastery pine script course.
This script is designed to send alerts to 3commas platform. In strategy.entry in comment option, you can incorporate your token for your bot.
The buy signal accomplishes only when BTC is above simple moving average (SMA).
When BTC crosses down SMA, any position closes immediately.
The parameters were tuned for this particular plot.

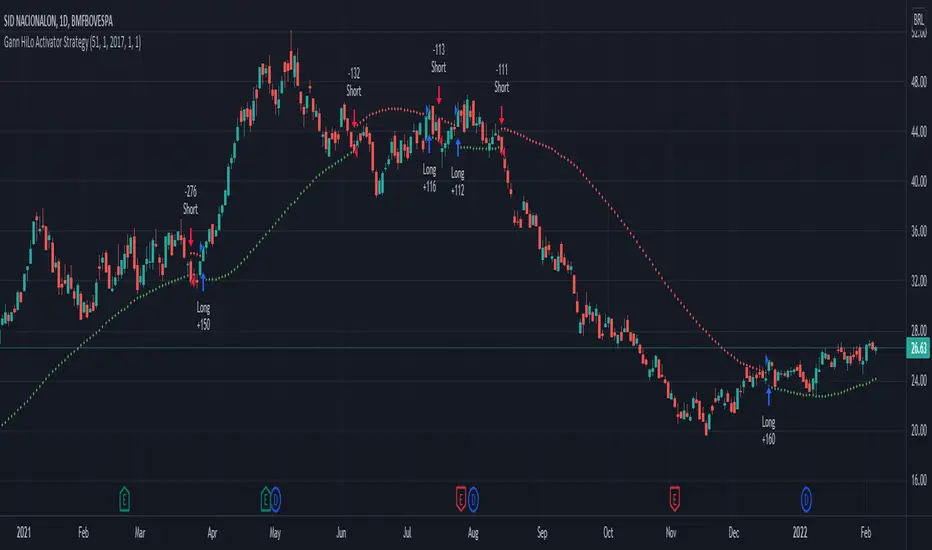
Gann HiLo Activator Strategy█ OVERVIEW
Strategy based on the Gann Hilo Activator . This is a trend following strategy, which means it will go long (and close the previous short position) once the price closes above the high SMA, and go short (and close the previous long position) once the price closes below the low SMA.
█ PARAMETERS
- Length
- Displace (or offset): default is 1
- Begin from start: strategy will run since the beggining
- From year, month, day: Choose an specific date to start backtesting (must disable the parameter above to work)
█ HOW TO USE
After choosing the start date to run the strategy, you can change the length field and look at the backtest results to find the most optimal settings for the current symbol.
This strategy was tested on the stock and crypto market with good results. Hope you enjoy!
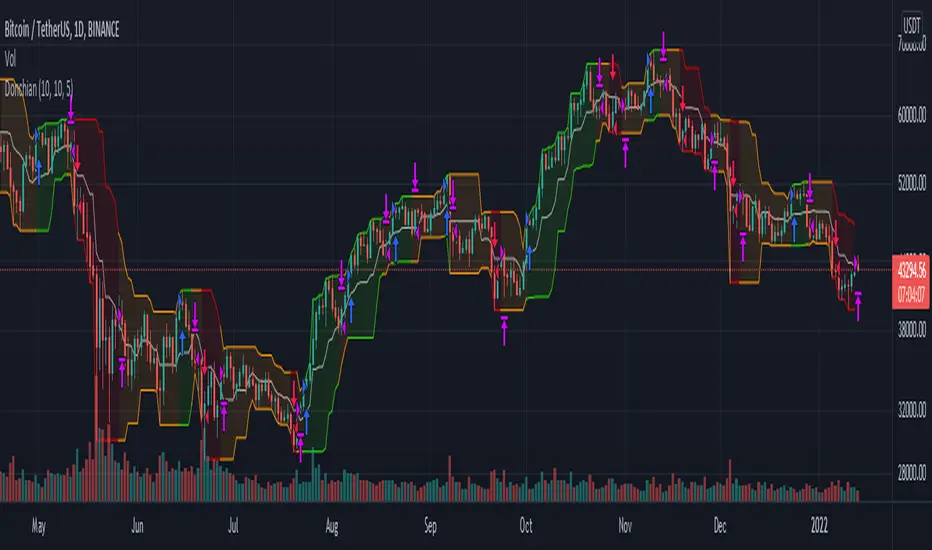
Donchian Channel Strategy IdeaThis strategy idea is a variation of the "Donchian Channel" trading strategy. It is built with a highest-high band, a lowest-low band, and a baseline which is average the highest-high and the lowest-low bands. This strategy is very useful in trending instruments on 1W and 1D timeframes. This is the implementation used in the QuantCT app.
You can set the operation mode to be Long/Short or long-only.
You also can set a fixed stop-loss or ignore it so that the strategy acts solely based on entry and exit signals.
Trade Idea
When the close price breaks up the previous highest-high, it is a long signal, the market is considered rising (bullish), and the plotted indicator becomes green. Long positions are held until the close price crosses under the baseline.
When the close price breaks down the previous lowest-low, it is a short signal, the market is considered falling (bearish), and the plotted indicator becomes red. Short positions are held until the close price crosses above the baseline.
Otherwise, if we have no position in the market, the market is considered ranging, and the plotted indicator becomes orange.
Entry/Exit rules
Enter LONG if the close price breaks up the previous highest-high (i.e. when the plotted indicator becomes green).
Exit LONG if the close price crosses under the baseline (i.e. when the plotted indicator becomes orange).
Enter SHORT if the close price breaks down the previous lowest-low (i.e. when the plotted indicator becomes red).
Exit SHORT if the close price crosses above the baseline (i.e. when the plotted indicator becomes orange).
CAUTION
It's just a bare trading idea - a profitable one. However, you can enhance this idea and turn it into a full trading strategy with enhanced risk/money management and optimizing it, and you ABSOLUTELY should do this!
DON'T insist on using Long/Short mode on all instruments! This strategy performs much better in Long-Only mode on many (NOT All) trending instruments (Like BTC, ETH, etc.).
Classic Long Term Trend Following SystemThis is a classic long term trend following system.
The breakout period is 50 days instead of 20 and the moving average crossover are 40 and 120.
The moving averages are also exponential instead of simple.
The stoploss is 4 ATRs away from the price.
Recommendations:
Donchian Channels settings > 50 days
Moving Averages > 40 and 120, 80 and 140
Important to note:
My first strategy, DC Breakout System | This is simplicity at its finest, is best used on the crypto market and this one for stocks, commodities, currencies, etc. Those markets tend to trend a lot longer than crypto do.

Trend Following with Bollinger BandsThis is a trend following system which uses the Bollinger Bands instead of the Donchian Channels.
Long position:
* Price closes above the middle line.
* The fast EMA (in this case the 40) crosses over or is above the slow one (in this case the 120)
Short position:
* Price closes below the middle line.
* The fast EMA crosses under or is below the slow one.
Stoploss:
* 4 ATRs away from the price.

Trend Following with Donchian Channels and MACDThis is a trend following system based on the Donchian Channels. Instead of using a simple moving average crossover, this system uses the MACD as the trendfilter:
Long positions:
* Price makes a new 50 day high,
* The MACD-line crosses above or is above the Signal-line.
* Both the MACD and the Signal-lines are above the zero-line.
Short positions:
* Price makes a new 50 day low,
* The MACD-line crosses below or is below the Signal-line.
* Both the MACD and the Signal-lines are below the zero-line.
Stoploss:
The initial and the trailing stoploss are 4 ATRs away from the price.

DC Breakout Strategy | This is simplicity at its finest.As the title already describes: this is a Donchian breakout strategy. This strategy, as of now, only goes long. It goes long when the price close makes a new high and the 8 day moving average is above the 32 day moving average. The strategy exits the trade if the price breaks the atr trailing stop of * 3 or the 8 day moving average crosses below the 32 day moving average.
This is simplicity at its finest.

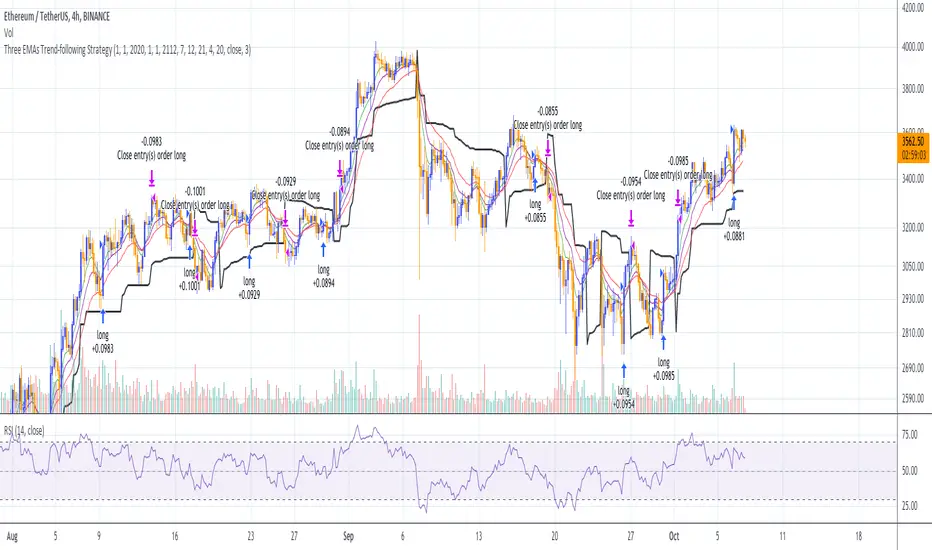
Three EMAs Trend-following Strategy (by Coinrule)Trend-following strategies are great because they give you the peace of mind that you're trading in line with the market.
However, by definition, you're always following . That means you're always a bit later than your want to be. The main challenges such strategies face are:
Confirming that there is a trend
Following the trend, hopefully, early enough to catch the majority of the move
Hopping off the trade when it seems to have run its course
This EMA Trend-following strategy attempts to address such challenges while allowing for a dynamic stop loss.
ENTRY
The trading system requires three crossovers on the same candle to confirm that a new trend is beginning:
Price crossing over EMA 7
Price crossing over EMA 14
Price crossing over EMA 21
The first benefit of using all three crossovers is to reduce false signals. The second benefit is that you know that a strong trend is likely to develop relatively soon, with the help of the fast setup of the three EMAs.
EXIT
The strategy comes with a fixed take profit and a volatility stop, which acts as a trailing stop to adapt to the trend's strength. That helps you get out of the way as soon as market conditions change. Depending on your long term confidence in the asset, you can edit the fixed take profit to be more conservative or aggressive.
The position is closed when:
The price increases by 4%
The price crosses below the volatility stop.
The best time frame for this strategy based on our backtest is the 4-hr. Shorter timeframes can also work well, although they exhibit larger volatility in their returns. In general, this approach suits medium timeframes. A trading fee of 0.1% is taken into account. The fee is aligned to the base fee applied on Binance, which is the largest cryptocurrency exchange.
You can execute this strategy on your favourite exchange at coinrule.com
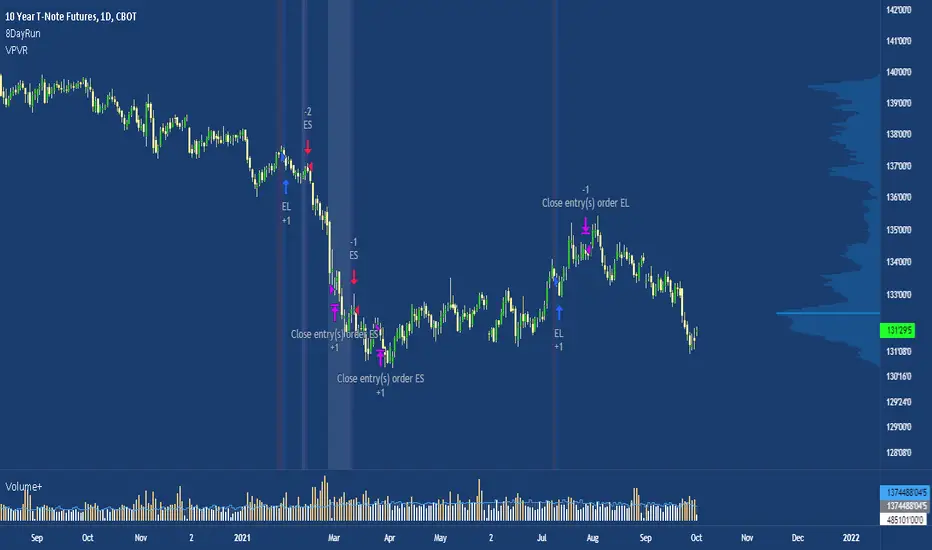
8 Day Extended Runs Inspired by Linda Bradford Raschke.
Strategy suited to the US T-note (ZN1!) with a t-test of 4.06.
The 5 day SMA is vital to Linda’s trend identification system. She’s done extensive testing and research using this indicator and has built models based on it. Linda used the 5 day SMA to determine that large outlier price moves happen in the direction of the trend in each market about 9-10 times per year. The powerful part about that number is that when the trend does persist, it can go on a long run, making this a trade with a high expected value.
Note: the current exit criteria is sell 10 days after entry, users should experiment with different stop placements.
Vin's Playzone Strategy How it works
Playzone is a very simple system, utilizing just two exponential moving
averages. The 'Zones' in which different 'actions' should be taken is
highlighted with different colors on the chart. Calculations for the zones
are based on the relative position of price to the two EMA lines and the
relationship between the two EMAs
How to use
The basic method for using Playzone is to follow the green/red color.
Buy when bar closes in green.
Sell when bar closes in red.
Using it this way is safe but slow and is expected to have around 35-40%
accuracy, while yielding around 2-3 profit factors. The system works best
on larger time frames.
The more advanced method uses the zones to switch between different
trading system and biases, or in conjunction with other indicators.
example 1:
Buy when Yellow-Green and Bullish Divergence between price and RSI is visible,
if not Buy on Green and vise-versa
example 2:
Set up a long-biased grid and trade long only when actionzone is in green
change the bias to short when actionzone turns to te bearish side(red)
(Look at colors on a larger time frame)
"We let the market tell us what to do, Not to outguess what the market gonna do."

Strategy Template - V2This is an educational script created to demonstrate few basic building blocks of a trend based strategy and how to achieve different entry and exit types. My initial intention was to create a comprehensive strategy template which covers all the aspects of strategy. But, ended up creating fully fledged strategy based on trend following.
This is an enhancement on Strategy-Template But this script is comparitively more complex. Hence I decided to create new version instead of updating the existing one.
Lets dive deep.
SIMPLE COMPONENTS OF TREND FOLLOWING STRATEGY
TREND BIAS - This defines the direction of trend. Idea is not to trade against the trend direction. If the bias is bullish, look for long opportunities and if bias is bearish, look for short opportunities. Stay out of the market when the bias is neutral.
Often, trend bias is determined based on longer timeframe conditions. Example - 200 Moving Average, Higher timeframe moving averages, Higher timeframe high-lows etc. can be used for determining the trend bias.
In this script, I am using Weekly donchian channels combined with daily donchian channels to define trend bias.
Long Bias - 40 Day donchian channel sits completely in upper portion of 40 Week dochnial channel.
Short Bias - 40 Day donchian channel sits completely in lower portion of 40 Week donchian channel.
ENTRY CONDITION - Entry signals are generated only in the direction of bias. Hence, when in LongBias, we only get Long signals and when in short bias, we only get short signals.
In our case, when in Long Bias - if price hits 40 day high for the first time, this creates our long entry signal. Similarly when in Short Bias , price hitting 40 day low will create signal for going short. Since we do not take trades opposite to trend, no entry conditions are formed when price hits 40 day high in Short Bias or 40 day low in Long Bias.
EXIT CONDITION - Exit conditions are formed when we get signals of trend failure.
In our case, when in long trade, price hitting 40 day low creates exit signal. Similarly when in short trade price hitting 40 day high creates exit signal for short trade.
DIFFERENT TYPES OF ENTRY AND EXIT
In this script, I have tried to demonstrate different entry and exit types.
Entry types
Market - Enter immediately when entry signal is received. That is, in this case when price crossover over high in long bias and crosses under low in short bias
Stop - This method includes estimating at what level new highs are made and creating a stop buy order at that level. This way, we do not miss if the break out is stronger. But, susciptible to fail during fakeouts.
Limit - This method includes executing a limit order to buy at lower price or sell at higher price. In trend following methods, downside of limit order is when there is genuine breakout, these limit orders may not hit and during trend failures the limit orders are likely to hit and go straight to stop.
Stop-Limit - this is same as stop order but will also place a limit condition to avoid buying on overextended breakout or with lots of slippage.
Exit types
Market - whether to keep the existing trade running or whether to close it is determined after close of each bar and exit orders are executed manually upon receiving exit signal.
Stop - We place stop loss orders beforehand when there is a trade in place. This can help in avoiding big movements against trade within bar. But, this may also stop on false signals or fakeouts.
Take profit
Stop - No take profits are configured.
Target - 30% of the positions are closed when take profit levels are hit. Take profit levels are defined by risk reward.
USING THE CODE AS TEMPLATE
As mentioned earlier, I intended to create a fully fledged strategy template. But, ended up creating a fully fledged stratgy. However, you can take some part of this code and use it to start your own strategy. Will explain what all things can be adopted without worrying about the strategy implementation within
Strategy definition : This can be copied as is and just change the title of strategy. This defines some of the commonly used parameters of strategy which can help with close to realistic backtesting results for your coded strategy and comparison with buy and hold.
Generic Strategy Parameters : The parameter which defines controlling alllowed trade direction and trading window are present here. This again can be copied as is and variable inDateRange can be directly used in entry conditions.
Generic Methods : f_getMovingAverage and f_secureSecurity are handy and can be used as is. atr method provideded by pine gives you ATR based on RMA. If you want SMA or any other moving average based ATR, you can use the method f_getCustomAtr
Trade Statements : This section has all types of trading instructions which includes market/stop/limit/stop-limit type of entries and exits and take profit statements. You can adopt the type of entry you are interested in and change when condition to suit your strategy.
Trade conditions and levels : This section is required. But, cannot be copied. All the trade logic goes here which also sets parameters which are used in when of Trade Statements.
Hope this helps.

Ichimoku Cloud Strategy IdeaThis strategy idea uses the famous Ichimoku Cloud (Forward-shifted SMA-9 and SMA-26) and Chiku (52-candle lagged close price) with its default parameters. This strategy is slow and issues few signals. However, this is one of the most performant long-term trend trading strategies. It usually works well on 1D and 4H timeframes and even better on trending instruments. This is the implementation used in QuantCT app.
You can set operation mode to be Long/Short or long-only.
You also can set a fixed stop-loss or ignore it so that the strategy act solely based on entry and exit signals.
Trade Idea
When both close price and chiku are above the cloud, market is considered rising (bullish) and the plotted cloud becomes green.
When both close price and chiku are below the cloud, market is considered falling (bearish) and the plotted cloud becomes red.
Otherwise, market is considered ranging and the plotted cloud becomes orange.
Entry/Exit rules
Enter LONG right after both close price and chiku went above the cloud (i.e. when the end of the plotted cloud becomes green).
Enter SHORT right after both close price and chiku went below the cloud (i.e. when the end of the plotted cloud becomes red).
EXIT market when close price enters the cloud.
CAUTION
It's just a bare trading idea - but a profitable one. You can enhance this idea and turn it into a full trading strategy with enhanced risk/money management and optimizing it, and you ABSOLUTELY should do this!
DON'T insist on using Long/Short mode on all instruments! This strategy performs much better in Long-Only mode on several instruments (Like BTC , ETH, etc.), and also performs better in Long/Short mode on other instruments (Like VET, BNT, etc.).

Trend Bounce [racer8]I discovered this mechanical trading system titled "This Algo Strategy Has Only 3 rules and 62% Win Rate".
I coded the trading system on Tradingview...and now I am introducing it to you guys.
I modified the system so that it has both buy & sell signals.
I've tested it repeatedly in different markets on TV including stocks, currency pairs, bitcoin, and commodities...and it works!
A buy signal is generated whenever the current close is below the previous 7-day low and the current close is above the 200 period moving average.
A sell signal is generated whenever the current close is above the previous 7-day high and the current close is below the 200 period moving average.
The system also has a 2-ATR stop loss which I coded.
This system is unique in that it has both trend-following and reversal elements in it.
The system trades short-term reversals while obeying the long-term trend.
Essentially, you are buying the dips of bullish trends! & selling at the peaks of bearish trends!
Enjoy ♡

Breakout Trend Follower V2This is a variation on my other Breakout Trend Follower script. In the other script, you can use a moving average to act as a filter for your trades (i.e. if the price is below the moving average, it won't go long). After making the tool that detects trends on higher timeframes, I wanted to see if that might be a better filter than a moving average.
So this script lets you look at higher time frame trends (i.e. are there higher highs and higher lows? If so, this is an uptrend). You only take trades when you are with the trend. You have the ability to select up to two trends to act as a filter. Each trend direction is shown on a table on the chart for easy reference. The current pivot highs and lows are plotted on the chart so you can see when you might be breaking both the current timeframe's trend and higher level trends.
What I found was that in general this does not perform as well as the other strategy, but it does seem to be a lot more picky with trades. Showing higher win rates and a better profit factor. It just takes a lot less trades and the net profit isn't as good.

Momentum Trading By Mahfuz AzimA following indicator is Momentum Trading that uses fast QQE crosses with Moving Averages
Use for trend direction filtering. QQE or Qualitative Quantitative Estimation is based
Relative strength index (RSI), but uses a smoothing technique as an additional transformation. Three crosses can be selected (all selected by default)

PMA Strategy IdeaThis strategy idea uses three EMAs on HLC/3 data, know as PMA(Pivot Moving Average). This strategy is very useful in trending instruments on 1W and 1D timeframes. This is the implementation used in QuantCT app. The study version of this idea is published in public library as ACD PMA .
You can set operation mode to be Long/Short or long-only.
You also can set a fixed stop-loss or ignore it so that the strategy act solely based on entry and exit signals.
Trade Idea
When all EMAs are rising, market is considered rising (bullish) and the plotted indicator becomes green.
When all EMAs are falling, market is considered falling (bearish) and the plotted indicator becomes red.
Otherwise, market is considered ranging and the plotted indicator becomes orange.
Entry/Exit rules
Enter LONG if all EMAs are rising (i.e. when the plotted indicator becomes green).
Enter SHORT if all EMAs are falling (i.e. when the plotted indicator becomes red).
EXIT market if none of the above (i.e. when the plotted indicator becomes orange).
CAUTION
It's just a bare trading idea - a profitable one. However, you can enhance this idea and turn it into a full trading strategy with enhanced risk/money management and optimizing it, and you ABSOLUTELY should do this!
DON'T insist on using Long/Short mode on all instruments! This strategy performs much better in Long-Only mode on many (NOT All) trending instruments (Like BTC , ETH, etc.).

Momentum Strategy IdeaThis strategy idea uses two, fast and slow, momentum indicators for trade setups and exits. This is a fast reacting strategy which is very useful in trending instruments on 1D and 4H timeframes. This is the implementation used in QuantCT app.
You can set operation mode to be Long/Short or long-only.
You also can set a fixed stop-loss or ignore it so that the strategy act solely based on entry and exit signals.
Trade Idea
When both momentum indicators are positive, asset is considered rising ( bullish ) and the plotted indicator becomes green.
When both momentum indicators are negative, asset is considered falling ( bearish ) and the plotted indicator becomes red.
Otherwise, asset is considered ranging and the plotted indicator becomes orange.
Entry/Exit rules
Enter LONG if both momentum indicators are greater than zero (i.e. when the plotted indicator becomes green).
Enter SHORT if both momentum indicators are lower than zero (i.e. when the plotted indicator becomes red).
EXIT market if none of the above (i.e. when the plotted indicator becomes orange).
CAUTION
It's just a bare trading idea - a profitable one. However, you can enhance this idea and turn it into a full trading strategy with enhanced risk/money management and optimizing it, and you ABSOLUTELY should do this!
DON'T insist on using Long/Short mode on all instruments! This strategy performs much better in Long-Only mode on many (NOT All) trending instruments (Like BTC , ETH, etc.).

EMAC - Exponential Moving Average Cross - OptimizedEMAC - Exponential Moving Average Cross - Optimized
This is the full Strategy version with the best currently known optimized inputs with the average best settings across the following 26 tickers:
QQQ
TQQQ
SPY
SPXL
AAPL
AMZN
TSLA
BYND
CRWD
DDOG
ESTC
FSLY
MDB
NVDA
PINS
PTON
ROKU
SHOP
SQ
TDOC
TWLO
APPS
CHWY
DKNG
ETSY
FVRR
For the short Study version of EMAC that has been optimized for TradersPost alerts only please see EMAC - Exponential Moving Average Cross - Study
For the original full Strategy version with many editable inputs please see EMAC - Exponential Moving Average Cross
