On Balance VolumeEnhanced the original OBV (On Balance Volume) indicator:
- Draw max lines of OBV in the last 30 candles so that we can notice the trend, as well as divergences easier.
- If you use fiat as base currency (USDT in cryptocurrency for example), we can display the OBV in fiat, so that we can compare total trading volume across a list of symbols to find healthy symbols to trade easier.
Trendtrading

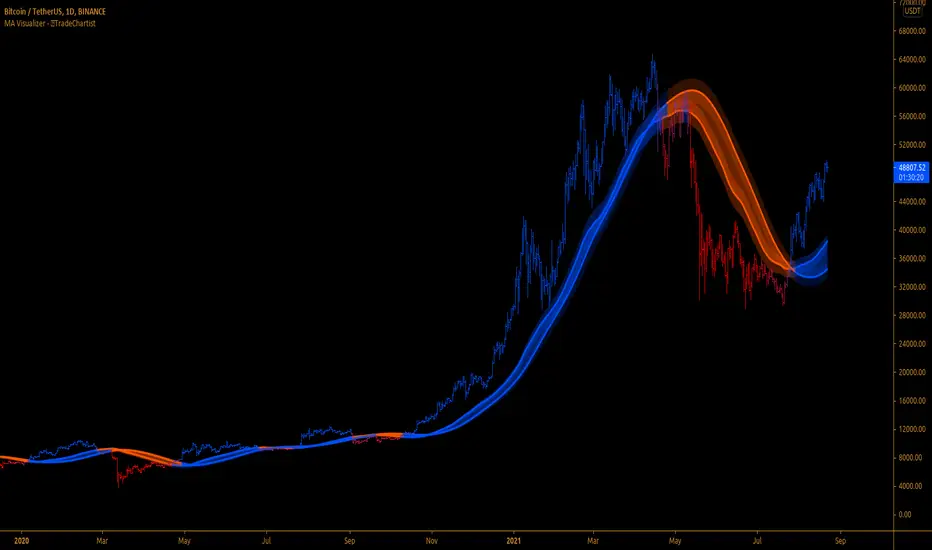
MA Visualizer™TradeChartist MA Visualizer is a Moving Average based indicator aimed to visualize price action in relation to the Moving Average in a visually engaging way.
===================================================================================================================
█ MA Visualizer Features
11 different Moving Averages to choose from the settings to visualize based on MA Visualizer Length (Default - 55 period SMA).
2 Smoothing options (default - 0, 0 uses MA length as Smoothing factor, 1 uses no Smoothing).
4 colour themes to choose from and option to adjust Visualizer Vibrance.
█ Example Charts
1. 1hr chart of OANDA:XAUUSD using 55 period WMA.
2. 15m chart of OANDA:EURUSD using 144 period Tillson T3 MA.
3. 4 hr chart of OANDA:US30USD using 55 period SMMA.
===================================================================================================================
Best Practice: Test with different settings first using Paper Trades before trading with real money
===================================================================================================================
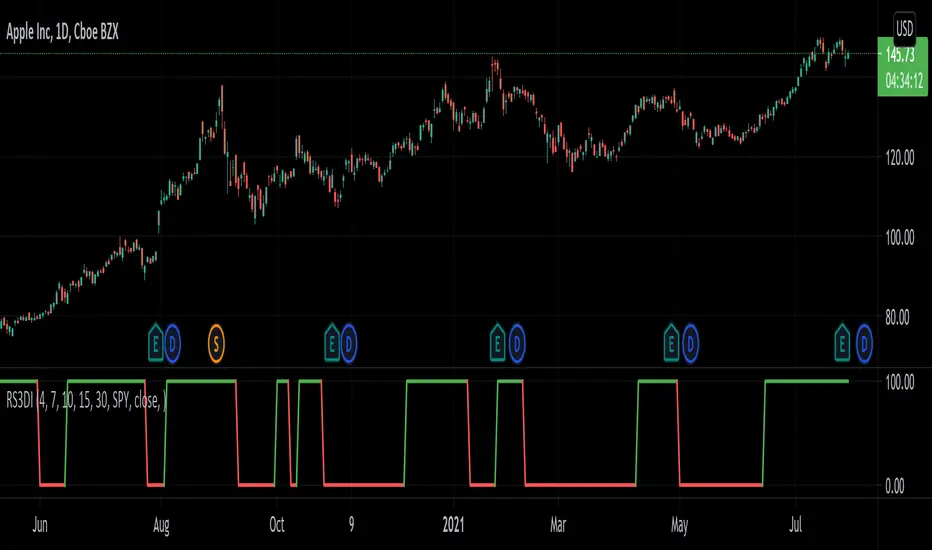
Relative Strength 3D Indicator [CC]This is a custom indicator of mine loosely based on the work by James Garofallou (Stocks and Commodities Sep 2020 pg 14) and this is meant for medium to long term trend confirmations. The idea behind this indicator is to capture 3 different dimensions of trend strength. The first dimension captures the overall strength of the underlying stock vs the market (in this case the S&P 500). The second dimension captures the overall trend strength by assigning a scoring system so when all faster moving averages are stronger than slower moving averages then it gets the max points. The final dimension is the strength of the overall strength of everything so far. Buy when the indicator line turns green and sell when it turns red.
Let me know if there are any other indicators or scripts you would like to see me publish!
Natural Directional Index [CC]The Natural Directional Index was created by Jim Sloman and this is another indicator that I'm publishing from the collection of Ocean indicators. I want to make sure his legacy is covered by as many eyes as possible. This is his version of the directional index indicator but he uses his weighting method to use the square root of time and you can see that the signals are very smooth. Big thanks of course to @altcoinz and @tmac87 for helping me get the full source code and files for all of his work. This indicator captures the current trend and I have used my strong buy and sell signals to let you know the strength of the current trend. Darker colors are for strong signals and lighter colors are for normal ones. Buy when the line turns green and sell when it turns red.
Let me know if there are any other indicators you would like to see me publish!

Natural Stochastic Indicator [CC]The Natural Stochastic Indicator was created by Jim Sloman and this is another indicator from his Ocean series which I will eventually publish all of them. Big thanks to @altcoinz and @tmac87 for giving me all of the source code in order to publish Jim's life work. This is another momentum indicator but unlike a traditional stochastic indicator, this one doesn't use overbought and oversold levels. Instead it becomes a sell signal when the indicator starts getting lower and vice versa. This takes the classic approach to a stochastic and combines it with the time factor from Jim's Ocean Theory to create this new indicator. I have included strong buy and sell signals as darker colors and normal buy and sell signals as lighter colors. Buy when the line turns green and sell when it turns red.
Let me know if there are any other indicators you would like to see me publish!

ExecuterExecuter helps to be a disciplined trader by providing the rules for execution.
1. Triangle down and up symbol : One can consider this as 1st point of confirmation. This considers the volume and momentum.
2. Moving average band ( To identify the trend ) : When the red line is above all the other lines means trend is up or positive, so buy only when trend is UP.
Red line is below all other line means Trend is negative or Down, consider always to sell when trend is negative.
When redline is between green and black then trend is sideways or you may expect a big move and risk to reward ratio will be better in this type of setup.
When the red line is up then black line acts as Stop loss point.
3. Horizontal lines : Dynamic horizontal lines acts as booster to the trend or safe buying or selling point. This analyze the trend, candle strength and momentum to give the buying point or selling point. Here 1st thin line shows the start of trend and thick line shows the strong trend. Lines get deleted when the buying or selling point is invalid or one may consider the fresh points.
This helps to eliminate lot of sideways trends.
This indicator is fully customizable based on your requirement.
Consider more signal option if you don't want to miss the opportunity. If you are safe trader then no need of that.

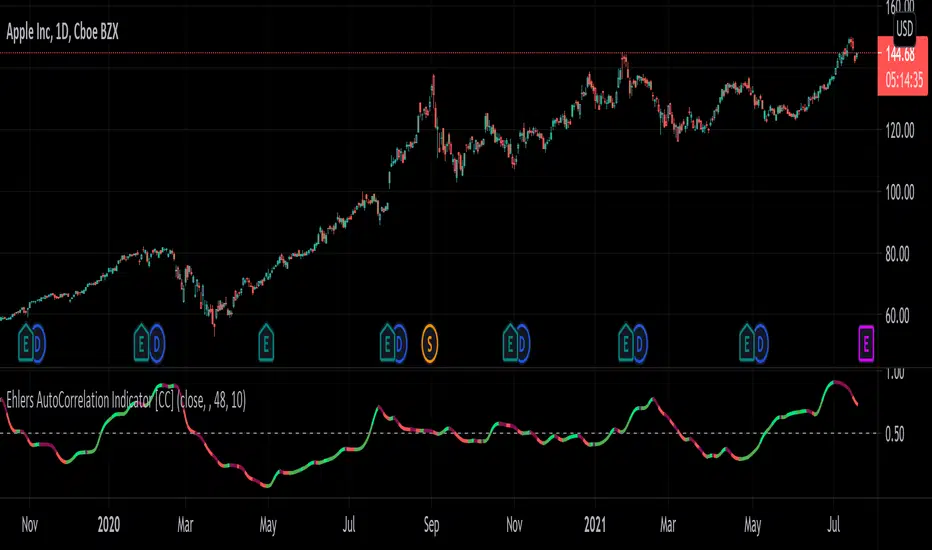
Ehlers AutoCorrelation Indicator [CC]The AutoCorrelation Indicator was created by John Ehlers (Cycle Analytics pgs 94-98) and this can be viewed as both a momentum indicator and a trend indicator. This was his basis for several other indicators that he created which I will be publishing soon but essentially as this indicator goes up then the stock is in an uptrend and also has upward momentum. You will notice that this indicator starts to go down even during an uptrend showing that the underlying trend is going to have an upcoming reversal. He also warns that the halfway mark is a possible reversal point so keep an eye out for that.
Generally speaking a good signal is to enter a long position when the indicator is under the midline and is starting to go up (or when the line is green) and to exit the position when the indicator goes over the midline. I have included strong buy and sell signals in addition to normal ones so darker colors mean strong signals and lighter colors mean normal signals.
Let me know if there are any other indicators you would like me to publish!
Volume Profile / Fixed RangeHello All,
This script calculates and shows Volume Profile for the fixed range . Recently we have box.new() feature in Pine Language and it's used in this script as an example. Thanks to Pine Team and Tradingview!..
Sell/Buy volumes are calculated approximately!.
Options:
"Number of Bars" : Number of the bars that volume profile will be calculated/shown
"Row Size" : Number of the Rows
"Value Area Volume % " : the percent for Value Area
and there are other options for coloring and POC line style
Enjoy!

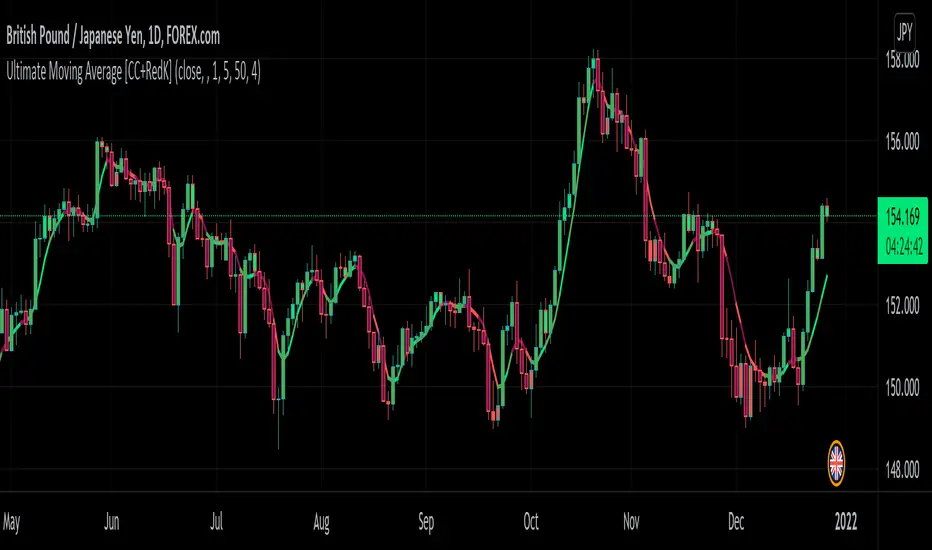
Ultimate Moving Average [CC+RedK]The Ultimate Moving Average was created by myself and @RedKTrader and I can proudly say that this is the holy grail of moving averages. Not only does this moving average react to the current price trends like a normal moving average but we have also included the ability to react to volume, momentum, and volatility. The only thing this moving average can't do is wash your car.
The Ultimate Moving Average doesn't even use a set length so it is fully adaptable to any type of market whether it is choppy or trending. It tightens during volatile markets and loosens during choppy markets. I have included 3 of the main moving averages of a fixed length of 20 days to show you just how much better our moving average is.
The overall concept of this moving average was to fully adapt to any and all changes of the underlying stock. We used my Variable Power Weighted Moving Average as a base and changed the script to adapt to momentum instead. The idea behind this was when momentum reaches an extreme in either direction we tighten the moving average to be able to react accordingly. We then used the idea behind my Variable Length Moving Average to be able to react to volatility and make the length itself into a separate variable.
All of this work combined to create the most reactive moving average out there and I guarantee you will be using this in your daily trading! Let me know if there are any other scripts you would like to see me publish.
Natural Moving Average [CC]The Natural Moving Average was created by Jim Sloman (Ocean Theory pgs 63-70) and this is the one of the best moving averages you will find! This is one of the most adaptive moving averages that I have ever seen that accounts for all types of volatility. I have included a default value of 40 for the length so you can see just how close this moving average sticks to the underlying price movements. Feel free to try out your own lengths to see what you like best. I have included strong buy and sell signals in addition to normal ones so darker colors mean strong signals and lighter colors mean normal ones. Buy when the line turns green and sell when it turns red.
Let me know if there are any other scripts you would like to see me publish!

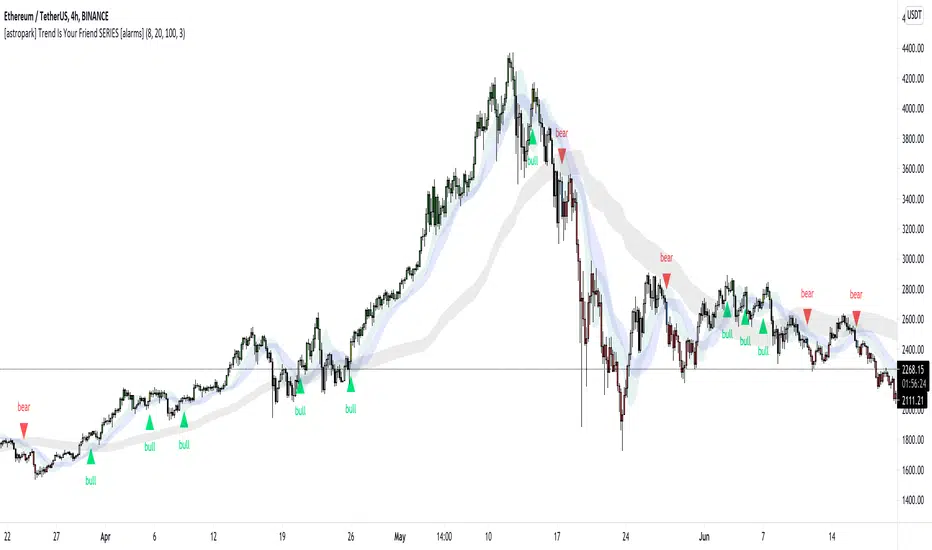
[astropark] Trend Is Your Friend SERIES [alarms]Dear Followers,
today I'm glad to present you an indicator which is a mix of three indicators of mine: Trend Is Your Friend Series !
As you may easily understand from the name, this indicator incorporates all 3 Trend is You Friend indicators I made in past.
This way you can control all of them just with one indicator.
Of course this comes with some useful integration features:
a bull green triangle appears when all trends are bullish (you can set an alert for this)
a bear purple triangle appears when all trends are bearish (you can set an alert for this)
bar coloring reflects the bullish/bearish integration too
you have an option to enable/disable all trends buy/sell signals
you have an option to hide trend clouds borders (chart will be way cleaner this way)
you can still customize each trend indicator settings and set alerts on each trend individually
you can enable/disable heikin ashi analysis
As per Trend is Your Friend V1/V2/V3, this indicator is for higher timeframe trading, from 4h and above is suggested.
This indicator is pretty good for both Swing and Scalping , you can run it over a bot or use it on Renko chart!
If you are a scalper, you will love suggested entries for fast profit. You can run it on 1h timeframe in this case (below is not suggested, there is "no-trend" below 1h!). If you are used to scalp trading, be sure to close each trade whenever you feel happy (a proper trailing stop strategy is suggested for example).
As I always say, all tools are great if you use them correctly: this is not the "Holy Grail", so always use proper money and risk management strategies.
For your reference, here you can see original basic indicators that were integrated here:
V1 backtesting strategy
V2 backtesting strategy
V3 backtesting strategy
This is a premium indicator , so send me a private message in order to get access to this script.
Cup FinderHello All,
This script finds the Cups and you can use it while analysing the symbols. it creates circle and channel for the potential Cups and checks the number of bars included by the channel, if included bars is equal or greater than the value you set then it shows the cup.
The Options:
"Number for Bars to search" : Maximum length of a Cup
"Channel Width of the Cup" : Tate by the channel width of highest/lowest levels in last 300 bars, by default it's 5%
"Check for Breakout" : if there is Cup then it checks Close or High/Low is used a source for breaokuts, usuful while cheking historical bars
"Contained Bar Rate %" : after channel is created the script checks number of bars included by the channel of the Cup, you can set rate of included bars by this option
"S how Channels of Cups ": if you enable this option then you can see the channels around the Cups and set it as you wish
and there are some other options for labeling/removing old Cups and for coloring
Here you can see how channel looks like:
Cup with different colors:
P.S. This is an experimental work and sorry for no explanation in the script.
in the future if I have time I will try to write a script for Cup&Handle
This script is also an example to calculate and draw circles :)
Enjoy!

EMAC - Exponential Moving Average Cross - StudyEMAC - Exponential Moving Average Cross - Study
This is the short Study version of EMAC that has been optimized for TradersPost alerts only
For the original full Strategy version with many editable inputs please see EMAC - Exponential Moving Average Cross
For the full Strategy version with the best currently known optimized inputs (average best settings across 26 tickers) please see EMAC - Exponential Moving Average Cross - Optimized


Breakout FinderHelo All,
I got many requests for a Breakout script and here it's. This script searches the breakouts/breakdowns and draw square if there is one.
The options:
"Period" is used to find Pivot Points
"Max Breakout Length" is the maximum length to search breakouts
"Threshold Rate %" is channel width of the breakout area. calculated using highest/lowest of last 300 bars.
"Minimum Number of Tests" is the minimum number of tests that the Price tried to break the S/R level
and some options for coloring and linestyle
Lets see some examples:
in this example "Minimum Number of Tests" is 2 so the Price must have tested to break resistance area 2 times and then it breaks it as seen in the screenshot:
in following example Threshold rate is %10, so the channel width is very big:
as you can see in followinf screenshot you can choose different colors and line styles:
Alerts added ;)
Enjoy!

Awesome Heikin Ashi [Morty]This indicator uses Heikin Ashi candles and two EMAs to help you follow the trend and enter the trade. Heikin Ashi candles help to smooth the price and EMAs are used to detect trend. The default parameter of EMA is EMA10 and EMA20. You can use it at any timeframe. You should always adjust the EMA length according to different timeframes.
Features:
- Highlight background based on two EMAs
- Adjustable EMA length
- Adjustable Label size
- Show entry and exit signal labels
- Show stoploss price
- You can choose Long only or Short only or both signals
- Alert functions for notification
NOTE: If you use this signal to enter a trade, make sure the candle is close and enter in the next candle.

Relative Difference Of Squares Oscillator [CC]The Relative Difference Of Squares Oscillator was created by Marco Alves (Stocks and Commodities Aug 2020 pg 10) and this is a heavily customized version of his indicator that works for single stocks instead of the entire market. I have included extra buy and sell signals to account for strong signals vs normal signals based on some user feedback I got. Buy when the line turns green and sell when it turns red. Keep in mind that this is a lagging indicator so good for trend confirmation.
Let me know if there are any other scripts you would like to see me publish!

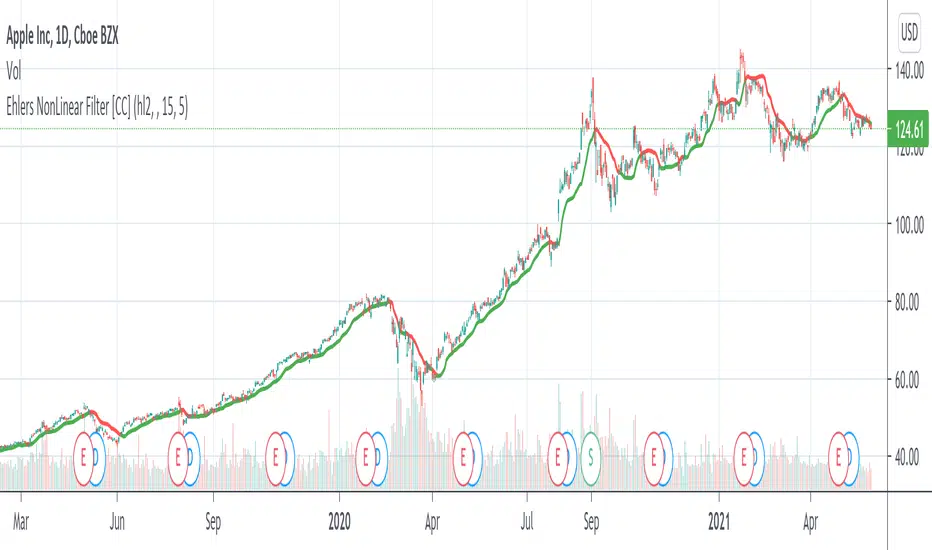
Ehlers NonLinear Filter [CC]The NonLinear Filter was created by John Ehlers and this one of his more unknown filters that work very well as a trendline and moving average. This is one of my favorites along with the instantenous trendlines that he created. Buy when the line turns green and sell when it turns red.
Let me know if there are any other indicators you would like to see me publish scripts for!
Indicator PanelHello All,
This script shows Indicator panel in a Table. Table.new() is a new feature and released today! Thanks a lot to Pine Team to add this new great feature! This new feature is a game changer!
The script shows indicator values for each symbol and changes background color of each cell by using current and last values of the indicators for each symbol. if current value is greater than last value then backgroung color is green, if lower than last value then red, if they are equals then gray.
You can choose the indicators to display. Number of columns in the table is dynamic and is changed by number of the indicators.
You can choose 5 different Symbols, 6 Indicators and 2 Simple or Exponential Moving averages, you can set type of moving averages and the lengths. You can also set the lengths for each Indicators.
Indicators:
- RSI
- MACD ( MACD and Signal and Histogram )
- DMI ( +DI and -DI + and ADX )
- CCI
- MFI
- Momentum
- MA with Length 50 (length can be set)
- MA with Length 200 (length can be set)
In this example RSI, MACD and MA 200 were chosen, you can see how table size changes dynamically:
Enjoy!

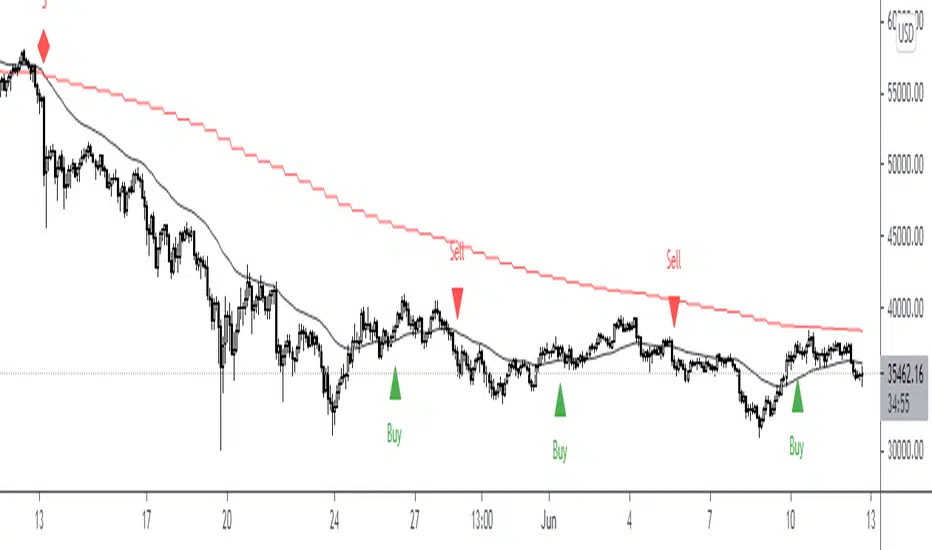
RP trend readerThis tool is a momentum reader
You can use this tools at any timeframe
When the momentum is meet the condition then it will show the signal
The signal are "Buy" and "Sell"
Buy means that you Long or exit your Short at the price
Sell means that you Short or exit your Long at the price
There's pivot line at there
Pivot line is showing how strong the momentum right now
If the price above or way above the pivot line then the uptrend is strong (very bullish)
If the price below or way below the pivot line then the downtrend is strong (very bearish)
Don't blindly Buy or Sell just because the signal is coming out
Combine it with the market structure, look at the big picture instead lower TF and the edge is yours
The best entry is when the price bounce close to the pivot point
Be carefull with the sideway or choppy market. You can see that the price is going up and down at the pivot line and the signals come out quite often
Follow your trading plan, be patience (don't FOMO) and be discipline with your plan... Cheers...
Gann HiLo Activator [CC]The HiLo Activator was created by W.D. Gann and I was surprised to not see more of his technical indicators on here. I will start adding more of his indicators on here if I get more interest. This is the original version of the indicator that performs like a trailing stop that also works well as a trend line. Buy when the line turns green and sell when it turns red.
Let me know if there are any other indicators you want me to publish!

LTB Zigzag CirclesHello All,
Today I am here with a new idea and script, " LTB Zigzag Circles ". The idea is to create Circles using last 2 zigzag waves and to catch the breakouts earlier than horizontal lines. if a circle is broken then the script shows entry for Long/Short positions. and if broken circle reappears again then the position is closed. You can change Zigzag period as you wish and see the different results.
Here you can see how the script calculates and draws the Circles:
Below you can see how the script draws part of the circle on each bar:
Optionally the script can show levels:
P.S. I haven't tested it as a strategy, Result and Performance may change by Zigzag period, you need to find best Zigzag period according to your strategy. By the way, my Zigzag Circles idea can be improved, if you have any recommendation let me know please ;)
Enjoy!

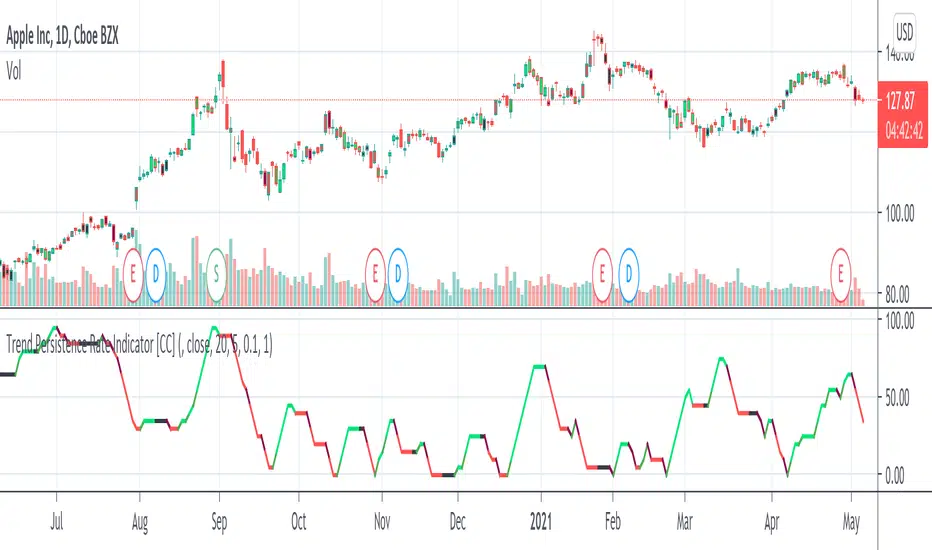
Trend Persistence Rate Indicator [CC]The Trend Persistence Rate Indicator was created by Richard Poster (Stocks and Commodities Feb 2021 pg 12) and this indicator is a good trend strength indicator similar to ADX. A good strategy with this indicator according to the author is to combine this with a moving average crossover strategy and a volatility indicator. Buy when the price crosses over the moving average and when the volatility and this indicator are over a selected minimum. I think 30-40 as a minimum for this indicator works well. Exit that position when this indicator peaks and starts to go down and it should be very profitable for you. I have included general buy and sell signals with this indicator as well.
Let me know if there are any other indicators you would like to see me publish!