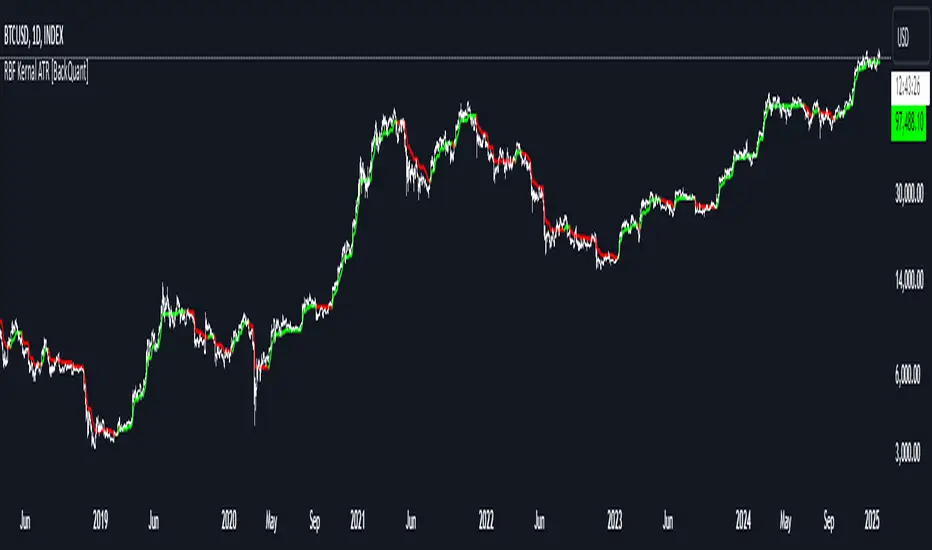
VDUB Bands - MTF WMA+ATR Volatility Lanes (6 Alerts)VDUB Bands draws volatility-scaled “trend lanes” around a Weighted Moving Average (WMA) using ATR (or a WMA of True Range). It can display up to four tiers (L1–L4), with higher tiers sourced from higher timeframes to show local structure → higher-timeframe structure on a single chart.
────────────────────────────────────────
1. What it does (plain English)
────────────────────────────────────────
Think of each tier as a lane system around the trend:
• Inner rails = “normal volatility lane” around the WMA
• Outer rails = “extension / extreme zone” for that tier
• Higher tiers (L3/L4) show bigger structure
• Lower tiers (L1/L2) show active lane behavior
Typical interpretation:
• Price inside inner rails → normal variance around the trend lane
• Between inner and outer → stretched, but not extreme
• Outside outer rails → extended vs that tier’s volatility band
────────────────────────────────────────
2) Why it’s useful (and why it’s not a mashup)
────────────────────────────────────────
This is not a bundle of unrelated indicators. Everything serves one cohesive purpose:
• Visualize trend + volatility lanes across multiple time horizons
• Keep rails consistent and readable (levels, fills, outlines)
• Optional multi-timeframe aggregation for structure context
• A compact 6-alert set to catch key transitions without alert spam
────────────────────────────────────────
3) What you see on the chart
────────────────────────────────────────
For each level (L1–L4), you can show:
• Upper/Lower Inner rails
• Upper/Lower Outer rails
• Optional center fill (between outer rails) = operating range
• Optional MA line per tier (off by default to reduce clutter)
• Base WMA line (L1 MA) if enabled
Suggested workflow:
• Start with L1 + L2 only
• Add L3/L4 once you like the structure view
• Use Dynamic Opacity if the chart feels crowded
────────────────────────────────────────
4) How it works (transparent formula)
────────────────────────────────────────
For each tier:
• MA = WMA(source, baseLen × levelMultiplier)
• ATR_like = Wilder ATR (default)
OR WMA(TrueRange, atrLen × levelMultiplier)
Inner rails:
• upperInner = MA + ATR_like × innerMult
• lowerInner = MA - ATR_like × innerMult
Outer rails:
• upperOuter = MA + ATR_like × outerMult
• lowerOuter = MA - ATR_like × outerMult
Tier behavior:
• L1 uses the chart timeframe
• L2–L4 can use user-selected HTFs (defaults: 4H / D / W)
or optional auto-selection
────────────────────────────────────────
5) Multi-timeframe behavior + interpolation
────────────────────────────────────────
• L2–L4 use request.security() with lookahead OFF (no future data).
• HTF bands naturally “step” when the HTF candle confirms.
• Interpolate HTF Bands (optional): visually blends from the prior confirmed HTF value to the current confirmed HTF value to reduce stepping. This is display smoothing, not prediction.
Repaint note:
• If Live Interp (Repaints) is enabled, the HTF lines can update intrabar and may repaint. Keep it OFF for strict non-repainting behavior.
────────────────────────────────────────
6) Auto-select L2/L3/L4 (optional)
────────────────────────────────────────
Two modes:
A) Ladder (deterministic)
• Picks “bigger” timeframes relative to the chart (simple and fast).
B) Score (data-driven)
• Tests candidate timeframes and scores them using:
• Coverage: % of closes inside the OUTER band over Score Lookback
• Width: average outer-band width as a fraction of MA
• Targets: Target Coverage + Target Width
• Weights: Coverage Weight + Width Weight
Performance notes:
• Score mode is heavier (many candidates).
• “Lock auto-select after first pick” is recommended to reduce load and avoid platform limits.
────────────────────────────────────────
7) Alerts (6 total, aggregated across L1–L4)
────────────────────────────────────────
Alerts trigger if ANY tier meets the condition:
• Cross ABOVE an OUTER band
• Cross BELOW an OUTER band
• Cross ABOVE an INNER band
• Cross BELOW an INNER band
• Price is OUTSIDE ABOVE an OUTER band
• Price is OUTSIDE BELOW an OUTER band
These are intentionally aggregated to keep the alert count small while catching meaningful transitions.
────────────────────────────────────────
8) Limitations & transparency
────────────────────────────────────────
• Indicator only (not a strategy). No performance claims.
• MTF values update when the higher timeframe candle confirms.
• Interpolation is visual smoothing; it does not forecast.
• Non-standard chart types (Heikin Ashi/Renko/etc) may behave differently from standard candles.
• If you enable repainting options, signals/levels may change intrabar.
────────────────────────────────────────
9) Credits/reuse disclosure
────────────────────────────────────────
• Conceptual inspiration: VDUB and the community “VDUB_BINARY_PRO_3_V2” idea of WMA ± TR/ATR × multipliers.
• This version is a reimplementation + extension, adding:
o Multi-tier architecture (L1–L4)
o Higher-timeframe sourcing + optional interpolation
o Optional scoring-based timeframe selection
o Dynamic opacity + streamlined plotting
o Aggregated 6-alert set
No code was copied directly from the older script; this is a rewritten implementation with additional features and different structure.
www.tradingview.com
Pine Script®指標