AVWAP+RSI Confluence — 1R TesterRSI + 1R ATR - Monthly P\&L (v4)
WHAT THIS STRATEGY DOES (OVERVIEW)
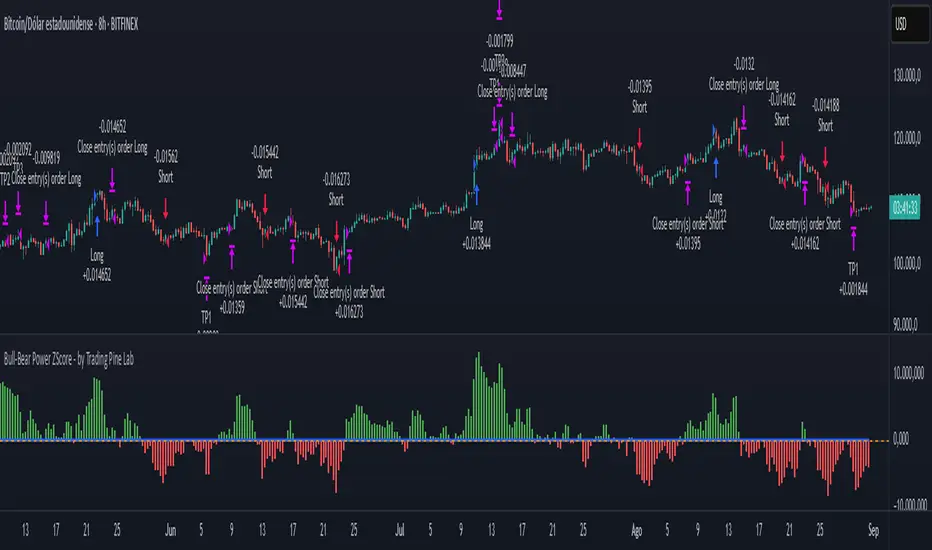
* Pine strategy (v4) that combines a simple momentum trigger with a symmetric 1R ATR risk model and an on-chart Monthly/Yearly P\&L table.
* Momentum filter: trades only when RSI crosses its own SMA in the direction of the trend (price vs Trend EMA).
* Risk engine: exits use fixed 1R ATR brackets captured at entry (no drifting targets/stops).
* Accounting: the table aggregates percentage returns by month and year using strategy equity.
ENTRY LOGIC (LONGS & OPTIONAL SHORTS)
Indicators used:
* RSI(rsiLen) and its SMA: SMA(RSI, rsiMaLen)
* Trend filter: EMA(emaTrendLen) on price
Longs:
1. RSI crosses above its RSI SMA
2. RSI > rsiBuyThr (filters weak momentum)
3. Close > EMA(emaTrendLen)
Shorts (optional via enableShort):
1. RSI crosses below its RSI SMA
2. RSI < rsiSellThr
3. Close < EMA(emaTrendLen)
EXIT LOGIC AND RISK MODEL (1R ATR)
* On entry, snapshot ATR(atrLen) into atrAtEntry and the average fill price into entryPx.
* Longs: stop = entryPx - ATR \* atrMult; target = entryPx + ATR \* atrMult
* Shorts: mirrored.
* Stops and targets are posted immediately and remain fixed for the life of the trade.
POSITION SIZING AND COSTS
* Default position size: 25% of equity per trade (adjustable in Properties/inputs).
* Commission percent and a small slippage are set in strategy() so backtests include friction by default.
MONTHLY / YEARLY P\&L TABLE (HOW IT WORKS)
* Uses strategy equity to compute bar returns: equity / equity\ - 1.
* Compounds bar returns into current month and current year; commits each finished period at month/year change (or last bar).
* Renders rows as years; columns Jan..Dec plus a Year total column.
* Cells colored by sign; precision and maximum rows are controlled by inputs.
* Values represent percentage returns, not currency P\&L.
VISUAL AIDS
* Two pivot trails (pivot high/low) are plotted for context only; they do not affect entries or exits.
CUSTOMIZATION TIPS
* Raise rsiBuyThr (long) or lower rsiSellThr (short) to filter weak momentum.
* Increase emaTrendLen to tighten trend alignment.
* Adjust atrLen and atrMult to fit your timeframe/instrument volatility.
* Leave enableShort = false if you prefer long-only behavior or shorting is constrained.
NON-REPAINTING AND BACKTEST NOTES
* Signals use bar-close crosses of built-in indicators (RSI, EMA, ATR); no future bars are referenced.
* calc\_on\_every\_tick = true for responsive visuals; Strategy Tester evaluates on bar close in history.
* Backtest stop/limit fills are simulated and may differ from live execution/liquidity.
DISCLAIMERS
* Educational use only. This is not financial advice. Markets involve risk. Past performance does not guarantee future results.
INPUTS (QUICK REFERENCE)
* rsiLen, rsiMaLen, rsiBuyThr, rsiSellThr
* emaTrendLen
* atrLen, atrMult, enableShort
* leftBars, rightBars, prec, showTable, maxYearsRows
SHORT TAGLINE
RSI momentum with 1R ATR brackets and a built-in Monthly/Yearly P\&L table.
TAGS
strategy, RSI, ATR, trend, risk-management, backtest, Pine-v4
Pine Script®策略