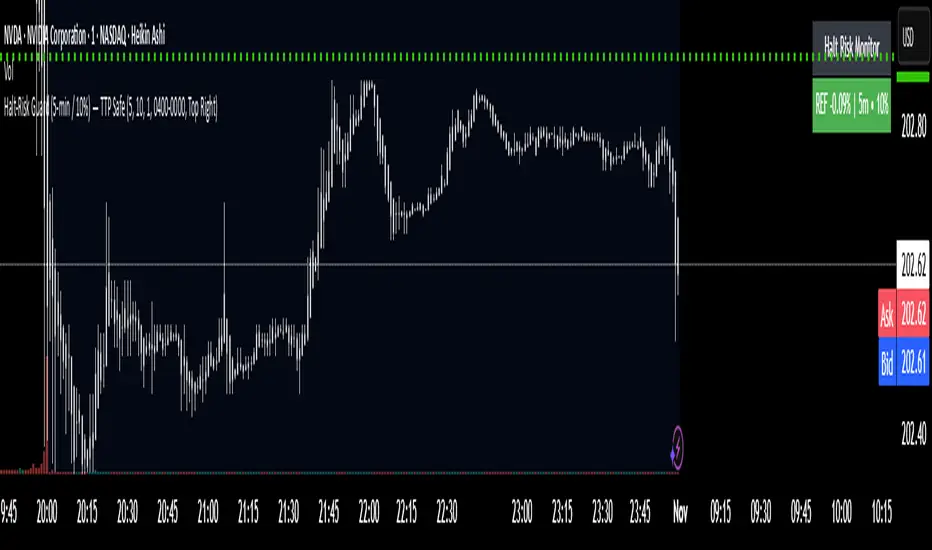
Volatility vs ATRVolatility vs ATR Indicator Description for TradingView
Volatility vs ATR is a powerful custom indicator designed to help traders analyze and compare market volatility with the Average True Range (ATR). This indicator provides valuable insights into the dynamic behavior of asset prices, enabling traders to make informed decisions about market trends, potential reversals, and risk management.
What Does It Measure?
Volatility: Represents the degree of price variation over a given period. Calculated using standard deviation or other measures, it highlights periods of heightened or reduced market activity.
Average True Range (ATR): Measures the average range of price movement over a specific period, providing a sense of the asset's price fluctuations and market activity.
How It Works
The indicator plots both Volatility and ATR on the same chart, making it easy to visualize how these metrics interact.
Rising Volatility often signals increased market uncertainty or the beginning of strong trends.
ATR Spikes typically accompany high volatility, helping identify potential breakout or breakdown scenarios.
By tracking the interplay between these metrics, traders can anticipate shifts in momentum, recognize consolidation phases, and plan trades more effectively.
Key Features
Dual-Line Display: Clearly plots both Volatility (red) and ATR (blue) for easy comparison.
Customizable Periods: Allows you to adjust the lookback period for both metrics to match your trading style.
Versatile Application: Works across all asset classes, including stocks, forex, crypto, and commodities.
Why Use Volatility vs ATR?
Trend Analysis: Identify trending vs. ranging markets by observing the relationship between Volatility and ATR.
Breakout Confirmation: Use Volatility and ATR spikes as confirmation signals for potential breakouts.
Risk Management: Plan stop-loss levels and position sizing based on ATR values.
How to Use It
Add the indicator to your chart.
Look for periods where Volatility diverges from ATR to spot potential market shifts.
Use the indicator in conjunction with price action and other technical tools for a comprehensive analysis.
This indicator is ideal for traders looking to enhance their strategies by understanding market dynamics through the lens of volatility and average price movement.
Let me know if you’d like further refinement!
波動率
Breakaway Fair Value Gaps [LuxAlgo]The Breakaway Fair Value Gap (FVG) is a typical FVG located at a point where the price is breaking new Highs or Lows.
🔶 USAGE
In the screenshot above, the price range is visualized by Donchian Channels.
In theory, the Breakaway FVGs should generally be a good indication of market participation, showing favor in the FVG's breaking direction. This is a combination of buyers or sellers pushing markets quickly while already at the highest high or lowest low in recent history.
While this described reasoning seems conventional, looking into it inversely seems to reveal a more effective use of these formations.
When the price is pushed to the extremities of the current range, the price is already potentially off balance and over-extended. Then an FVG is created, extending the price further out of balance.
With this in consideration, After identifying a Breakaway FVG, we could logically look for a reversion to re-balance the gap.
However, it would be illogical to believe that the FVG will immediately mitigate after formation. Because of this, the dashboard display for this indicator shows the analysis for the mitigation likelihood and timeliness.
In the example above, the information in the dashboard would read as follows (Bearish example):
Out of 949 Bearish Breakaway FVGs, 80.19% are shown to be mitigated within 60 bars, with the average mitigation time being 13 bars.
The other 19.81% are not mitigated within 60 bars. This could mean the FVG was mitigated after 60 bars, or it was never mitigated.
The unmitigated FVGs within the analysis window will extend their mitigation level to the current bar. We can see the number of bars since the formation is represented to the right of the live mitigation level.
Utilizing the current distance readout helps to better judge the likelihood of a level being mitigated.
Additionally, when considering these mitigation levels as targets, an additional indicator or analysis can be used to identify specific entries, which would further aid in a system's reliability.
🔶 SETTINGS
Trend Length: Sets the (DC) Trend length to use for Identifying Breakaway FVGs.
Show Mitigation Levels: Optionally hide mitigation levels if you would prefer only to see the Breakaway FVGs.
Maximum Duration: Sets the analysis duration for FVGs, Past this length in bars, the FVG is counted as "Un-Mitigated".
Show Dashboard: Optionally hide the dashboard.
Use Median Duration: Display the Median of the Bar Length data set rather than the Average.
Session High/Low Average & Range [1CG]The Session High/Low Average & Range indicator independently measures the average price movement from the opening price in each direction. It also displays the maximum high and low distance, called Range. Separating the averages and range into highs and lows helps analyze the volatility of the market as well as the direction.
USE EXAMPLES
Session Open
Session Close
Customization
Minimal - 1x and 2x Averages are replaced with custom lines, in order to show distance to3x.
Calculations
Average High: (high price of session - session opening price) / (session period)
Average Low: (session opening price - low price of session) / (session period)
Range High: The highest price of the last (session period)
Range Low: The lowest price of the last (session period)
INPUTS
Session
Here you can choose the hours for your session and time zone. The default is London session in New York time. Next, the session period determines how many sessions to sample from for the average and range lines, the default is 20. Lastly, you can choose the number of sessions to appear on the chart not including the current session if you are in one, 5 by default.
Lines
All of the lines allow you to change the color, width, and style. They also have a label option to choose to display the price. The bottom of the section allows you to change the location and size of the label text.
**Open Line** -Displays the opening price for the length of the session.
**Average Lines** - Displays the 1x, 2x, and 3x the average distance from open in each direction. Additionally, you can toggle a background color to highlight the area.
**Custom Lines** - Displays a customizable multiple of either the average or range. By default the first custom line displays the Range at a 1x multiplier and the second line displays an Average at a 1.5x multiplier
Display Distance
Here you can choose to display the distance from the lines to the open. This data is marked with a “Δ”. For the three Average lines this will display in the area between the line and the open in the position and size of your choice. The custom lines will have the distance information displayed on the line itself. This helps keep the data organized.
True Range Trend StrengthThis script is designed to analyze trend strength using True Range calculations alongside Donchian Channels and smoothed moving averages. It provides a dynamic way to interpret market momentum, trend reversals, and anticipate potential entry points for trades.
Key Functionalities:
Trend Strength Oscillator:
Calculates trend strength based on the difference between long and short momentum derived from ATR (Average True Range) adjusted stop levels.
Smooths the trend strength using a simple moving average for better readability.
Donchian Channels on Trend Strength Oscillator:
Plots upper and lower Donchian Channels on the smoothed trend strength oscillator.
Traders can use these levels to anticipate breakout points and determine the strength of a trend.
Zero-Cross Shading:
Highlights bullish and bearish zones with shaded backgrounds:
Green for bullish zones where smoothed trend strength is above zero.
Red for bearish zones where smoothed trend strength is below zero.
Moving Averages for Oscillator:
Overlays fast and slow moving averages on the oscillator to provide crossover signals:
Fast MA Cross Above Slow MA: Indicates bullish momentum.
Fast MA Cross Below Slow MA: Indicates bearish momentum.
Alerts:
Alerts are available for MA crossovers, allowing traders to receive timely notifications about potential trend reversals or continuation signals.
Anticipating Entries with Donchian Channels:
The integration of Donchian Channels offers an edge in anticipating excellent trade entries.
Traders can use the oscillator's position relative to the channels to gauge oversold/overbought conditions or potential breakouts.
Use Case:
This script is particularly useful for traders looking to:
Identify the strength and direction of market trends.
Time entries and exits based on dynamic Donchian Channel levels and trend strength analysis.
Incorporate moving averages and visual cues for better decision-making.
UVR Crypto TrendINDICATOR OVERVIEW: UVR CRYPTO TREND
The UVR Crypto Trend indicator is a custom-built tool designed specifically for cryptocurrency markets, utilizing advanced volatility, momentum, and trend-following techniques. It aims to identify trend reversals and provide buy and sell signals by analyzing multiple factors, such as price volatility(UVR), RSI (Relative Strength Index), CMF (Chaikin Money Flow), and EMA (Exponential Moving Average). The indicator is optimized for CRYPTO MARKETS only.
KEY FEATURES AND HOW IT WORKS
Volatility Analysis with UVR
The UVR (Ultimate Volatility Rate) is a proprietary calculation that measures market volatility by comparing significant price extremes and smoothing the data over time.
Purpose: UVR aims to reduce noise in low-volatility environments and highlight significant movements during higher-volatility periods. While it strives to improve filtering in low-volatility conditions, it does not guarantee perfect performance, making it a balanced and adaptable tool for dynamic markets like cryptocurrency.
HOW UVR (ULTIMATE VOLATILITY RATE) IS CALCULATED
UVR is calculated using a method that ensures precise measurement of market volatility by comparing price extremes across consecutive candles:
Volatility Components:
Two values are calculated to represent potential price fluctuations:
The absolute difference between the current candle's high and the previous candle's low:
Volatility Component 1=∣High−Low ∣
The absolute difference between the previous candle's high and the current candle's low:
Volatility Component 2=∣High −Low∣
Volatility Ratio:
The larger of the two components is selected as the Volatility Ratio, ensuring UVR captures the most significant movement:
Volatility Ratio=max(Volatility Component 1,Volatility Component 2)
Smoothing with SMMA:
To stabilize the volatility calculation, the Volatility Ratio is smoothed using a Smoothed Moving Average (SMMA) over a user-defined period (e.g., 14 candles):
UVR=(UVR(Previous)×(Period−1)+Volatility Ratio)/Period
This calculation ensures UVR adapts dynamically to market conditions, focusing on significant price movements while filtering out noise.
RSI FOR MOMENTUM DETECTION
RSI (Relative Strength Index) identifies overbought and oversold conditions.
Trend Confirmation at the 50 Level
RSI values crossing above 50 signal the potential start of an upward trend.
RSI values crossing below 50 indicate the potential start of a downward trend.
Key Reversals at Extreme Levels
RSI detects trend reversals at overbought (>70) and oversold (<30) levels.
For example:
Overbought Trend Reversal: RSI >70 followed by bearish price action signals a potential downtrend.
Oversold Trend Reversal: RSI <30 with bullish confirmation signals a potential uptrend.
Rare Extreme RSI Readings
Extreme levels, such as RSI <12 (oversold) or RSI >88 (overbought), are used to identify rare yet powerful reversals.
---HOW IT DIFFERS FROM OTHER INDICATORS---
Using UVR High and Low Values
The Ultimate Volatility Rate (UVR) focuses on analyzing the high and low price ranges of the market to measure volatility.
Unlike traditional trend indicators that rely primarily on momentum or moving average crossovers, UVR leverages price extremes to better identify trend reversals.
This approach ensures fewer false signals during low-volatility phases and more accurate trend detection during high-volatility conditions.
UVR as the Core Component
The indicator is fundamentally built around UVR as the primary filter, while supporting tools like RSI (momentum detection), CMF (volume confirmation), and EMA (trend validation) complement its functionality.
By integrating these additional components, the indicator provides a multidimensional analysis rather than relying solely on a single approach.
Dynamic Adaptation to Volatility
UVR dynamically adjusts to market conditions, striving to improve filtering in low-volatility phases. While not flawless, this approach minimizes false signals and adapts more effectively to varying levels of market activity.
Trend Clouds for Visual Guidance
UVR-based dynamic clouds visually mark high and low price areas, highlighting potential consolidation or retracement zones.
These clouds serve as guides for setting stop-loss or take-profit levels, offering clear risk management strategies.
BUY AND SELL SIGNAL LOGIC
BUY CONDITIONS
Momentum-Based Buy-Entry
RSI >50, CMF >0, and the close price is above EMA50.
The price difference between open and close exceeds a threshold based on UVR.
Oversold Reversal
RSI <30 and CMF >0 with a strong bullish candle (close > open and UVR-based sensitivity filter).
Breakout Confirmation
The price breaks above a previously identified resistance, with conditions for RSI and CMF supporting the breakout.
Reversal from Oversold RSI Extreme
RSI <12 on the previous candle with a strong rebound on the current candle with UVR confirmation filter.
SELL CONDITIONS
Momentum-Based Sell-Entry
RSI <50, CMF <0, and the close price is below EMA50.
The price difference between open and close exceeds the UVR threshold.
Overbought Reversal
RSI >70 with bearish price action (open > close and UVR-based sensitivity filter).
Breakdown Confirmation
The price breaks below a previously identified support, with RSI and CMF supporting the breakdown.
Reversal from Overbought RSI Extreme
RSI >88 on the previous candle with a bearish confirmation on the current candle with UVR confirmation filter.
BUY AND SELL SIGNALS VISUALIZATION
The UVR Crypto Trend Indicator visually represents buy and sell conditions using dynamic plots, making it easier for traders to interpret and act on the signals. Below is an explanation of the visual representation:
Buy Signals and Visualization
Signal Trigger:
A buy signal is generated when one of the defined Buy Conditions is met (e.g., RSI >50, CMF >0, price above EMA50).
Visual Representation:
A blue upward arrow appears at the candle where the buy condition is triggered.
A blue cloud forms above the price candles, representing the strength of the bullish trend. The cloud dynamically adapts to market volatility, using the UVR calculation to mark support zones or consolidation levels.
Purpose of the Blue Cloud:
It acts as a visual guide for price movements and stay horizontal when the trend is not moving up
Sell Signals and Visualization
Signal Trigger:
A sell signal is generated when one of the defined Sell Conditions is met (e.g., RSI <50, CMF <0, price below EMA50).
Visual Representation:
A red downward arrow appears at the candle where the sell condition is triggered.
A red cloud forms below the price candles, representing the strength of the bearish trend. Like the blue cloud, it uses the UVR calculation to dynamically mark resistance zones or potential retracement levels.
Purpose of the Red Cloud:
It acts as a visual guide for price movements and stay horizontal when the trend is not moving down.
CONCLUSION
The UVR Crypto Trend indicator provides a powerful tool for trend reversal detection by combining volatility analysis, momentum confirmation, and trend-following techniques. Its unique use of the Ultimate Volatility Rate (UVR) as a core element, supported by proven indicators like RSI, CMF, and EMA, ensures reliable and actionable signals tailored for the crypto market's dynamic nature. By leveraging UVR’s high and low price range analysis, it achieves a level of precision that traditional indicators lack, making it a high-performing system for cryptocurrency traders.
Sigma ScoreFunction and Purpose
The Sigma Score indicator is a tool for analyzing volatility and identifying unusual price movements of a financial instrument over a specified timeframe. It calculates the "Sigma Score," which measures how far the current price change deviates from its historical average in terms of standard deviations. This helps identify potential extremes and unusual market conditions.
Features
Timeframe Control
Users can select the desired timeframe for analysis (e.g., minutes, hours, days). This makes the indicator adaptable to various trading styles:
Supported timeframes: Minutes (M1, M5, M10, M15), Hours (H1, H4, H12), Days (D), Weeks (W), Months (M).
Sigma Score Calculation
The indicator computes the logarithmic return between consecutive price values.
It calculates a simple moving average (SMA) and the standard deviation (StDev) of these returns.
The Sigma Score is derived as the difference between the current return and the average, divided by the standard deviation.
Visual Representation
Sigma Score Plot: The Sigma Score is displayed as a line.
Horizontal Threshold Lines:
A middle line (0) for reference.
Upper and lower threshold lines (default: 2.0 and -2.0) for highlighting extremes.
Background Highlighting:
Green for values above the upper threshold (positive deviations).
Red for values below the lower threshold (negative deviations).
Custom Settings
Timeframe
Select the timeframe for analysis using a dropdown menu (default: D for daily).
Thresholds
Upper Threshold: Default = 2.0 (positive extreme area).
Lower Threshold: Default = -2.0 (negative extreme area).
Both values can be adjusted to modify the indicator's sensitivity.
Use Cases
Identifying Extremes: Values above or below the thresholds can signal unusual market conditions, such as overbought or oversold areas.
Analyzing Market Anomalies: The Sigma Score quantifies how unusual a price movement is based on historical data.
Visual Aid: Threshold lines and background highlighting simplify the interpretation of boundary conditions.
Notes and Limitations
Timeframe Dependency: Results may vary depending on the selected timeframe. Shorter timeframes highlight short-term movements, while longer timeframes capture broader trends.
Volatility Sensitivity: The indicator is sensitive to changes in market volatility. Sudden price swings may produce extreme Sigma values.
Summary
The Sigma Score indicator is a powerful tool for traders and analysts to quickly identify unusual market conditions and make informed decisions. Its flexibility in adjusting timeframes and thresholds makes it a versatile addition to any trading strategy.
UVR ChannelsUVR CHANNELS: A VOLATILITY-BASED TREND ANALYSIS TOOL
PURPOSE
UVR Channels are designed to dynamically measure market volatility and identify key price levels for potential trend reversals. The channels are calculated using a unique volatility formula(UVR) combined with an EMA as the central reference point. This approach provides traders with a tool for evaluating trends, reversals, and market conditions such as breakouts or consolidations.
CALCULATION MECHANISM
1. Ultimate Volatility Rate (UVR) Calculation:
The UVR is a custom measure of volatility that highlights significant price movements by comparing the extremes of current and previous candles.
Volatility Components:
Two values are calculated to represent potential price fluctuations:
The absolute difference between the current candle's high and the previous candle's low:
Volatility Component 1=∣high−low ∣
The absolute difference between the previous candle's high and the current candle's low:
Volatility Component 2=∣high −low∣
Volatility Ratio:
The larger of the two components is selected as the Volatility Ratio, ensuring the UVR captures the most significant movement:
Volatility Ratio=max(Volatility Component 1,Volatility Component 2)
Smoothing with SMMA:
To stabilize the volatility calculation, the Volatility Ratio is smoothed using a Smoothed Moving Average (SMMA) over a user-defined period (e.g., 14 candles):
UVR= (UVR(Previous) × (Period−1))+Volatility Ratio)/Period
2. Band Construction:
The UVR is integrated into the band calculations by using the Exponential Moving Average (EMA) as the central line:
Central Line (EMA):
The EMA is calculated based on closing prices over a user-defined period (e.g., 20 candles).
Upper Band:
The upper band represents a dynamic resistance level, calculated as:
Upper Band=EMA+(UVR × Multiplier)
Lower Band:
The lower band serves as a dynamic support level, calculated as:
Lower Band=EMA−(UVR × Multiplier)
3. Role of the Multiplier:
The Multiplier adjusts the width of the bands based on trader preferences:
Higher Multiplier: Wider bands to capture larger price swings.
Lower Multiplier: Narrower bands for tighter market analysis.
FEATURES AND USAGE
Dynamic Volatility Analysis:
The UVR Channels expand and contract based on real-time market volatility, offering a dynamic framework for identifying potential price trends.
Expanding Bands: High market volatility.
Contracting Bands: Low volatility or consolidation.
Trend Identification:
Price consistently near the upper band indicates a strong bullish trend.
Price near the lower band signals a bearish trend.
Trend Reversal Signals:
Price reaching the upper band may signal overbought conditions, while price touching the lower band may signal oversold conditions.
Breakout Potential:
Narrow bands often precede significant price breakouts, making UVR Channels a useful tool for spotting early breakout conditions.
DIFFERENCES FROM BOLLINGER BANDS
Unlike Bollinger Bands, which rely on standard deviation to measure volatility, the UVR Channels use a custom volatility formula based on price extremes (highs and lows). This approach adapts to market behaviour in a unique way, providing traders with an alternative and accurate view of volatility and trends.
INPUT PARAMETERS
Volatility Period:
Determines the number of periods used to smooth the volatility ratio. A higher value results in smoother bands but may lag behind sudden market changes.
EMA Period:
Controls the calculation of the central reference line.
Multiplier:
Adjusts the width of the bands. Increasing the multiplier widens the bands, capturing larger price movements, while decreasing it narrows the bands for tighter analysis.
VISUALIZATION
Purple Line: The EMA (central line).
Red Line: Upper band (dynamic resistance).
Green Line: Lower band (dynamic support).
Shaded Area: Fills the space between the upper and lower bands, visually highlighting the channel.
[Venturose] MACD x BB x STDEV x RVIDescription:
The MACD x BB x STDEV x RVI combines MACD, Bollinger Bands, Standard Deviation, and Relative Volatility Index into a single tool. This indicator is designed to provide insights into market trends, momentum, and volatility. It generates buy and sell signals, by analyzing the interactions between these components. These buy and sell signals are not literal, and should be used in combination with the current trend.
How It Works:
MACD: Tracks momentum and trend direction using customizable fast and slow EMA periods.
Bollinger Bands: Adds volatility bands to MACD to identify overextension zones.
Standard Deviation: Dynamically adjusts the Bollinger Band width based on MACD volatility.
RVI (Relative Volatility Index): Confirms momentum extremes with upper and lower threshold markers.
Custom Logic: Includes a trigger system ("inside" or "flipped") to adapt signals to various market conditions and an optional filter to reduce noise.
Key Features:
Combines MACD and Bollinger Bands with volatility and momentum confirmations from RVI.
Dynamic color-coded plots for identifying bullish, bearish, and neutral trends.
Customizable parameters for tailoring the indicator to different strategies.
Optional signal filtering to refine buy and sell triggers.
Alerts for buy and sell signals based on signal logic.
Why It’s Unique:
This indicator combines momentum (MACD), volatility (Bollinger Bands and Standard Deviation), and confirmation signals (RVI thresholds) into a unified system. It introduces custom "inside" and "flipped" triggers for adaptable signal generation and includes signal filtering to reduce noise. The addition of RVI-based hints helps identify early overbought or oversold conditions, providing an extra layer of insight for decision-making. The dynamic integration of these components ensures a comprehensive yet straightforward analysis tool for various market conditions.
IU Price Density(Market Noise)This Price density Indicator will help you understand what and how market noise is calculated and treated.
Market noise = when the market is moving up and down without any clear direction
The Price Density Indicator is a technical analysis tool used to measure the concentration or "density" of price movements within a specific range. It helps traders differentiate between noisy, choppy markets and trending ones.
I’ve developed a custom Pine Script indicator, "IU Price Density," designed to help traders distinguish between noisy, indecisive markets and clear trading opportunities. It can be applied across multiple markets.
How this work:
Formula = (Σ (High𝑖 - Low𝑖)) / (Max(High) - Min(Low))
Where,
High𝑖 = the high price at the 𝑖 data point.
Low𝑖 = the low price at the 𝑖 data point.
Max(High) = highest price over the data set.
Max(Low) = Lowest price over the data set.
How to use it :
This indicator ranges from 0 to 10
Green(0-3) = Trending Market
Orange(3-6) = Market is normal
Red(6-10) = Noise market
💡 Key Features:
Dynamic Visuals: The indicator uses color-coded signals—green for trending markets and red for noisy, volatile conditions—making it easy to identify optimal trading periods at a glance.
Background Shading: With background colors highlighting significant market conditions, traders can quickly assess when to engage or avoid certain trades.
Customizable Parameters: The length and smoothing factors allow for flexibility in adapting the indicator to various assets and timeframes.
Whether you're a swing trader or an intraday strategist, this tool provides valuable insights to improve your market analysis. I’m excited to bring this indicator to the community!
ATR% Multiple from Key Moving AverageThis script gives signal when the ATR% multiple from any chosen moving average is beyond the configurable threshold value. This indicator quantifies how extended the stock is from a given key moving average.
A lot of traders use ATR% multiple from 10DMA, 21EMA, 50SMA or 200SMA to determine how extended a stock is and accordingly sell partials or exit. By default the indicator takes 50SMA and when the ATR% multiple is greater than 7 then it gives the signal to take partials. You can back test this indicator with previous trades and determine the ideal threshold for the signal. For small and midcaps a threshold of 7 to 10 ATR% multiples from 50SMA is where partials can be taken while large caps can revert to mean even earlier at 3 to 5 ATR% multiples from 50SMA.
You can modify this script and use it anyway you please as long as you make it opensource on TradingView.
Z The Good Stuff +I created this script to have a couple datapoints that I want to look at when going through charts to find trade ideas. Qullamaggie is one of my biggest inspirations and I built in a couple of his concepts with a touch to help me with sizing properly, all explained below:
Box 1: ADR %, Average Daily Range, gives and indication of how volatile the stock is. It uses the 20 day average % move of the current stock on the chart.
Box 2: LOD Distance, low of day distance is a quality of life element I created. It calculates the low for the current candle and color codes it red or green depending on if it's higher or lower than the daily ADR. The logic is that if a stock has an average speed, buying on a setup it is preferred if the stop distance (assuming a low of day stop) should be less than the ADR to improve the odds of more upside.
Box 3: Todays DV, this shows a rough estimate of how much money was traded on the particular day.
Box 4: ADV 20 days, similar to above this shows the 20 day $ traded average. The point to look at it is to have a better idea what position size is possible to not get stuck in something too illiquid.
Box 5: Market cap, just shows the market cap of the stock to know what size the company is.
Box 6: Number of shares, this is an additional quality of life aspect. If using low of day stops, this part calculates based on the users' inputted portfolio size and portfolio risk preference and then calculates how many stocks to buy to stay within the risk parameters. It is obviously not a sole decision making parameter nor does it guarantee any execution, but if a stock is showing an entry you want to take you can use the number of shares to help you know how many to buy. The preset is a portfolio of 10000 and a risk of 0.25%. This means that the number of shares to buy will be at the current price with lod stop that would result in a 0.25% portfolio loss. OF COURSE the actual loss depends on the execution and if the user places a stop loss order.
Hope you find it useful and feel free to give feedback! Cheers!
Position Sizing Calculator (Real-Time)█ SUMMARY
The following indicator is a Position Sizing Calculator based on Average True Range (ATR), originally developed by market technician J. Welles Wilder Jr., intended for real-time trading.
This script utilizes the user's account size, acceptable risk percentage, and a stop-loss distance based on ATR to dynamically calculate the appropriate position size for each trade in real time.
█ BACKGROUND
Developed for use on the 5-minute timeframe, this script provides traders with continuously updated, dynamic position sizes. It enables traders to instantly determine the exact number of shares and dollar amount to use for entering a trade within their acceptable risk tolerance whenever a trade opportunity arises.
This real-time position sizing tool helps traders make well-informed decisions when planning trade entries and calculating maximum stop-loss levels, ultimately enhancing risk management.
█ USER INPUTS
Trading Account Size: Total dollar value of the user's trading account.
Acceptable Risk (%): Maximum percentage of the trading account that the user is willing to risk per trade.
ATR Multiplier for Stop-Loss: Multiplier used to determine the distance of the stop-loss from the current price, based on the ATR value.
ATR Length: The length of the lookback period used to calculate the ATR value.
ImbalancesThis Pine Script is a trading indicator designed to identify imbalances in the market, specifically on candlestick charts. An imbalance refers to situations where there is a significant difference between buyers and sellers, which can create gaps or areas of inefficiency in the price. These imbalances often act as zones where price may return to "fill" or correct these inefficiencies.
1. Identifying Imbalances
The script analyzes candlestick patterns to detect imbalances based on the relationship between the highs, lows, and closes of consecutive candles. Specifically, it looks for:
Top Imbalances (Bearish): Areas where selling pressure has dominated, causing inefficiencies in the price. These are represented by patterns like multiple consecutive bearish candles or bearish gaps.
Bottom Imbalances (Bullish): Areas where buying pressure has dominated, leading to bullish gaps or inefficiencies.
When an imbalance is detected, the script highlights the area using visual boxes on the chart.
2. Visual Representation
The indicator uses colored boxes to show imbalances directly on the chart:
Top (Bearish) Imbalances: Highlighted using shades of red.
Bottom (Bullish) Imbalances: Highlighted using shades of green.
The boxes are further categorized into three states based on their level of mitigation:
Unmitigated: The imbalance has not been "filled" by price yet.
Partially Mitigated: Price has entered the imbalance zone but not completely filled it.
Fully Mitigated: Price has completely filled the imbalance zone.
3. Mitigation Logic
The concept of mitigation refers to the price revisiting an imbalance zone to correct the inefficiency:
If price fully or partially revisits an imbalance zone, the box's color changes to indicate the mitigation level (e.g., from unmitigated to partially/fully mitigated).
Fully mitigated boxes may be removed or recolored, depending on user preferences.
4. User Customization
The script provides several inputs to customize its behavior:
Enable or disable top and bottom imbalance detection.
Color settings: Users can define different colors for unmitigated, partially mitigated, and fully mitigated imbalances.
Mitigation display options: Users can choose whether to show fully mitigated imbalances on the chart or remove them.
5. Key Calculations
Imbalance Size: The size of the imbalance is calculated as the price difference between a candle's high and low across the relevant pattern.
Pattern Detection: The script checks for specific candlestick patterns (e.g., three consecutive bearish candles) to identify potential imbalances.
6. Practical Use Case
This indicator is useful for traders who:
Rely on supply and demand zones for their trading strategies.
Look for areas where price is likely to return (retesting unmitigated imbalances can signal potential trade setups).
Want to visually track market inefficiencies over time.
In Summary
The "Imbalances" indicator highlights and tracks price inefficiencies on candlestick charts. It marks zones where buying or selling pressure was dominant, and it dynamically updates these zones based on price action to indicate their mitigation status. This tool is particularly helpful for traders who use price action and market structure in their strategies.
Ultimate Volatility RateUltimate Volatility Rate
This indicator measures the volatility of price movements.
Support and Resistance Identification:
High volatility periods indicate larger price movements, which can be useful in assessing the potential for support and resistance levels to be broken.
Stop Loss (SL) and Take Profit (TP) Calculations:
The average volatility can be used to calculate dynamic Stop Loss (SL) and Take Profit (TP) levels:
SL: Placing it at a certain volatility multiplier below/above the entry price.
TP: Setting it at a certain volatility multiplier below/above the entry price.
For example:
SL: Entry price +/- (UVR × 1.5)
TP: Entry price +/- (UVR × 2)
Market Condition Analysis:
When the indicator value is high, it suggests that the market is volatile (active).
When the value is low, it indicates the market is in consolidation (sideways movement).
This information helps traders decide whether to take trend-following or consolidation-based positions.
Trend Reversal Monitoring:
A sudden increase in volatility often signals the start of a strong trend.
Conversely, a decrease in volatility can signal the slowing down or end of a trend.
BTCUSD Momentum After Abnormal DaysThis indicator identifies abnormal days in the Bitcoin market (BTCUSD) based on daily returns exceeding specific thresholds defined by a statistical approach. It is inspired by the findings of Caporale and Plastun (2020), who analyzed the cryptocurrency market's inefficiencies and identified exploitable patterns, particularly around abnormal returns.
Key Concept:
Abnormal Days:
Days where the daily return significantly deviates (positively or negatively) from the historical average.
Positive abnormal days: Returns exceed the mean return plus k times the standard deviation.
Negative abnormal days: Returns fall below the mean return minus k times the standard deviation.
Momentum Effect:
As described in the academic paper, on abnormal days, prices tend to move in the direction of the abnormal return until the end of the trading day, creating momentum effects. This can be leveraged by traders for profit opportunities.
How It Works:
Calculation:
The script calculates the daily return as the percentage difference between the open and close prices. It then derives the mean and standard deviation of returns over a configurable lookback period.
Thresholds:
The script dynamically computes upper and lower thresholds for abnormal days using the mean and standard deviation. Days exceeding these thresholds are flagged as abnormal.
Visualization:
The mean return and thresholds are plotted as dynamic lines.
Abnormal days are visually highlighted with transparent green (positive) or red (negative) backgrounds on the chart.
References:
This indicator is based on the methodology discussed in "Momentum Effects in the Cryptocurrency Market After One-Day Abnormal Returns" by Caporale and Plastun (2020). Their research demonstrates that hourly returns during abnormal days exhibit a strong momentum effect, moving in the same direction as the abnormal return. This behavior contradicts the efficient market hypothesis and suggests profitable trading opportunities.
"Prices tend to move in the direction of abnormal returns till the end of the day, which implies the existence of a momentum effect on that day giving rise to exploitable profit opportunities" (Caporale & Plastun, 2020).
Custom ATR with Paranormal Bar FilterCustom ATR with Paranormal Bar Filter
Description:
This indicator calculates a custom ATR (Average True Range) by filtering out bars with unusually large or small price ranges. It helps provide a more accurate measure of market volatility by ignoring outliers.
How it works:
True Range Calculation:
The price range for each bar is calculated.
Bars with ranges much larger or smaller than typical are excluded.
Filtered ATR:
The ATR is calculated using only the bars that pass the filter.
Current Bar Progress:
Measures how much the current bar has moved compared to the filtered ATR, based on the difference between its opening and closing prices.
Display:
A line represents the filtered ATR.
A table shows the filtered ATR, the current bar's range, and its progress relative to the ATR.
Input Settings:
ATR Period: Number of bars used to calculate the ATR.
Filter Window: Number of recent bars used to determine the typical range.
Filter Threshold: Sensitivity of the filter. A higher value allows more bars to pass.
How to Use:
Monitor Volatility:
Use the filtered ATR to understand market volatility while ignoring unusual price movements.
Track Current Bar Progress:
See how much of the ATR the current bar has completed.
Adjust Filter Settings:
Fine-tune the filter to match your trading timeframe and strategy.
This indicator is designed for traders who want to track market volatility without being misled by extreme outlier bars.