Volatility Trigger IndexThe script allows to assess the volatility of an asset.
It works by calculating the rate of change and the standard deviation.
The index is useful to determine the lowest volatility periods (could be useful to look strategies) and also it determine the highest volatility periods (maybe for exits or partial closes).
It has 3 iputs:
Lenght.
Low volatility value.
High volatility value.
The low and high values are set after a visual inspection. The values changes in each time frame. Usually when the timeframe is higher the value of the index is higher as well. So the low and high levels must be changed after each time frame set.
As an idea could be used in combination with any moving average to determine the market direction and the index used as a trigger.
Volatilityindicator

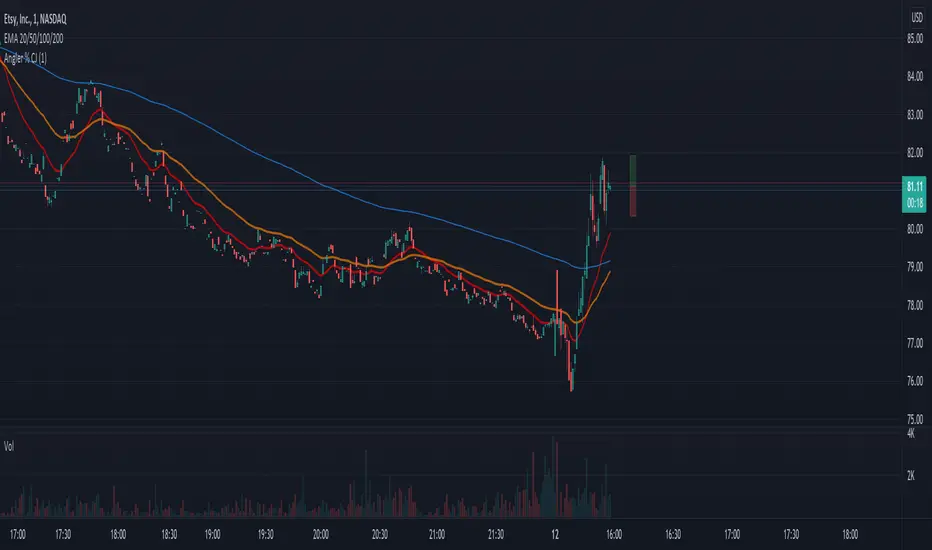
Front Angler Percent CJA nice little gadget.
Can be used to visually hint on volatility.
Will show a leading vertical bar which shows percentage of price, both up and down, in relation to current price.
Musashi_Slasher (Mometum+Volatility)--- Musashi Slasher (Momentum + Volatility ) ---
This tool was designed to fit my particular trading style and personal theories about the "Alchemy of the markets".
Velocity
This concept will be represented by the light blue and gray lines, a fast RSI (11 periods Relative Strength Index ), and a slow one ( RSI 14 periods as Wilder's half-cycle recommendation).
Note: Regular and hidden divergences will be plotted to help spot interesting spots and help with timing.
- Regular divergences will hint at a slowdown in price action.
- Hidden divergences will hint at a continuation as energy stored as some type of potential energy ready to be released violently. It is also referred ad 'The Slingshot'
Momentum
To understand Momentum, we must know that in physics Momentum = mass * velocity
We will understand mass as the mass of money of the market, which is found in the volume. To represent this concept a colored cloud will be plotted, this area will be given by MFI (13 periods Money Flow Index) and VRSI (Volume RSI ), when MFI is above VRSI will be colored dark blue, else red.
Note: Regular and hidden divergences on MFI will be plotted.
Volatility
The key to making this Alchemic theory work is to understand the "Transmutation" of the volatility which will be plotted by a multicolor line which will be blue in periods of low volatility and Red in periods of high volatility. I like to see these states as 'Ice' and 'Magma', as some periods the volatility just freezes, giving you hints that maybe a big move can be approaching, and at some points is just burning hot. Something I like about this indicator is that is trend agnostic. The line is named BBWP ( Bollinger Bands Width Percentile), as it calculates the width of the Bollinger bands (13 periods) and plot it as a percentile.
Finally, we will study the volatility of the volume, plotted as the red and purple mountains at the bottom of the indicator. This will complement and confirm the information provided by the Velocity-Momentum concepts.
Final Note
This indicator will only help identify interesting moments in the market, it's very powerful if used correctly, but it might be difficult to read in the beginning. It won't give "signals", as it is for understanding different dimensions in the market, I use it as it fits perfectly my trading strategies and tactics.
Best!
Musashi Alchemist
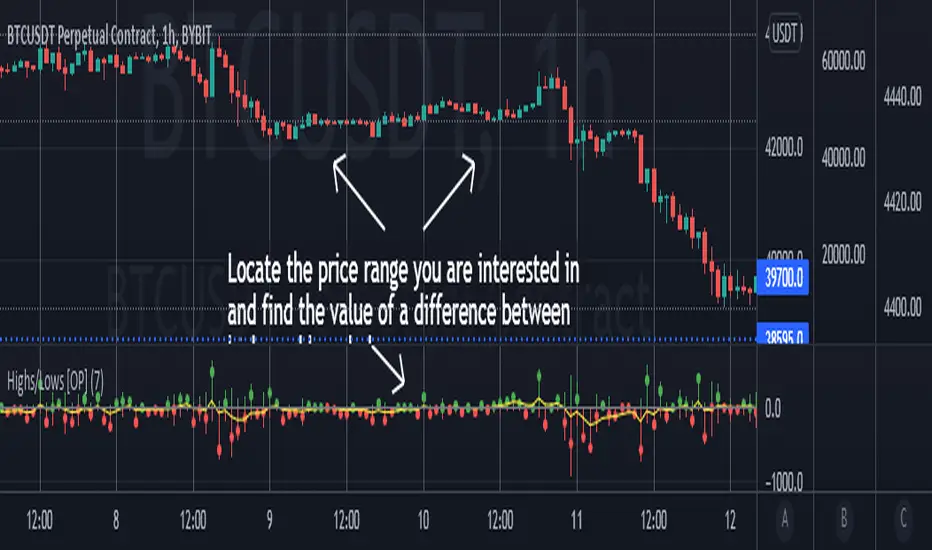
Highs/Lows difference [OrganicPunch]Highs/Lows difference indicator
To visually evaluate the difference between highs and lows of a price range.
This handsome indicator shows:
difference between highs of 2 candles by displaying it in green histogram
difference between lows of 2 candles by displaying it in red histogram
difference between both highs and lows by displaying a circle at the level of the difference
To read the numerical value, point at the circle of the relevant bar you are interested in, and see the scale.
Indicator is useful in creating strategies where you want to filter out consolidations/ranges (or to locate them), e.g. "Open trade when H/L difference is larger than 200", or "Look for candles with H/L difference lesser than 50".
The exact value of needed H/L difference can be found using this indicator.
LS Volatility Index█ OVERVIEW
This indicator serves to measure the volatility of the price in relation to the average.
It serves four purposes:
1. Identify abnormal prices, extremely stretched in relation to an average;
2. Identify acceptable prices in the context of the main trend;
3. Identify market crashes;
4. Identify divergences.
█ CONCEPTS
The LS Volatility Index was originally described by Brazilian traders Alexandre Wolwacz (Stormer) , Fabrício Lorenz , and Fábio Figueiredo (Vlad)
Basically, this indicator can be used in two ways:
1. In a mean reversion strategy , when there is an unusual distance from it;
2. In a trend following strategy , when the price is in an acceptable region.
Perhaps the version presented here may have some slight differences, but the core is the same.
The original indicator is presented with a 21-period moving average, but here this value is customizable.
I made some fine tuning available, namely:
1. The possibility of smoothing the indicator;
2. Choose the type of moving average;
3. Customizable period;
4. Possibility to show a moving average of the indicator;
5. Color customization.
█ CALCULATION
First, the distance of the price from a given average in percentage terms is measured.
Then, the historical average volatility is obtained.
Finally the indicator is calculated through the ratio between the distance and the historical volatility.
To facilitate visualization, the result is normalized in a range from 0 to 100.
When it reaches 0, it means the price is on average.
When it hits 100, it means the price is way off average (stretched).
█ HOW TO USE IT
Here are some examples:
1. In a return-to-average strategy
2. In a trend following strategy
3. Identification of crashes and divergences
█ THANKS AND CREDITS
- Alexandre Wolwacz (Stormer), Fabrício Lorenz, Fábio Figueiredo (Vlad)
- Feature scaler (for normalization)
- HPotter (for calc of Historical Volatility)

3EMA + Boullinger + PIVOTTRES EMAS + BANDAS DE BOLLINGER + PIVOTE
INDICADOR 1: TRES EMAS (MEDIA MOVIL EXPONENCIAL)
Con este indicador puede visualizar el promedio de precios con mayor peso a los datos mas recientes.
Se calculan y dibujan tres medias móviles exponenciales: 8, 20 y 200 últimas velas.
-Rápida EMA1 = 8
-Media EMA2 = 20
-Lenta EMA 3 = 200
INDICADOR 2: BANDAS DE BOLLINGER
Con este indicador podrá ver la fuerza y la tendencia del mercado, es decir la mide la volatilidad del precio del activo.
Si el precio sobrepasa la banda superior, el activo está sobrecomprado.
Si el precio sobrepasa la banda inferior, el activo está sobrevendido.
Longitud tendencia - BASE = 20, paso = 1
Desviación Estándar - Multiplicador = 2, paso = 0.2
INDICADOR 3: PIVOTE
Este indicador etiqueta los puntos donde el precio es mínimo y máximo, en un rango de velas determinado en el parámetro "Distancia para el Pivote".
Estos 3 indicadores sirven para todo tipo de activos: FOREX, CRIPTO, CFD´s, ETC.
------------------------------------------------------------------------------------------------------------------
THREE EMAS + BOLLINGER BANDS + PIVOT
INDICATOR 1: THREE EMAS ( EXPONENTIAL MOVING AVERAGE )
With this indicator you can visualize the average of prices with greater weight to the most recent data.
Three exponential moving averages are calculated and drawn: 4, 20 and 200 last candles.
-Fast EMA1 = 8
-Average EMA2 = 20
-Slow EMA 3 = 200
INDICATOR 2: BOLLINGER BANDS
With this indicator you can see the strength and trend of the market, that is, it is measured by the volatility of the asset price.
If the price goes above the upper band, the asset is overbought.
If the price goes above the lower band, the asset is oversold.
Trend length - BASE = 20, step = 1
Standard Deviation - Multiplier = 2, step = 0.2
INDICATOR 3: PIVOT
This indicator labels the points where the price is minimum and maximum, in a range of candles determined in the parameter "Distance to Pivot".
These 3 indicators are used for all types of assets: FOREX, CRYPT, CFD's, ETC.

Volatility Risk Premium GOLD & SILVER 1.0ENGLISH
This indicator (V-R-P) calculates the (one month) Volatility Risk Premium for GOLD and SILVER.
V-R-P is the premium hedgers pay for over Realized Volatility for GOLD and SILVER options.
The premium stems from hedgers paying to insure their portfolios, and manifests itself in the differential between the price at which options are sold (Implied Volatility) and the volatility GOLD and SILVER ultimately realize (Realized Volatility).
I am using 30-day Implied Volatility (IV) and 21-day Realized Volatility (HV) as the basis for my calculation, as one month of IV is based on 30 calendaristic days and one month of HV is based on 21 trading days.
At first, the indicator appears blank and a label instructs you to choose which index you want the V-R-P to plot on the chart. Use the indicator settings (the sprocket) to choose one of the precious metals (or both).
Together with the V-R-P line, the indicator will show its one year moving average within a range of +/- 15% (which you can change) for benchmarking purposes. We should consider this range the “normalized” V-R-P for the actual period.
The Zero Line is also marked on the indicator.
Interpretation
When V-R-P is within the “normalized” range, … well... volatility and uncertainty, as it’s seen by the option market, is “normal”. We have a “premium” of volatility which should be considered normal.
When V-R-P is above the “normalized” range, the volatility premium is high. This means that investors are willing to pay more for options because they see an increasing uncertainty in markets.
When V-R-P is below the “normalized” range but positive (above the Zero line), the premium investors are willing to pay for risk is low, meaning they see decreasing uncertainty and risks in the market, but not by much.
When V-R-P is negative (below the Zero line), we have COMPLACENCY. This means investors see upcoming risk as being lower than what happened in the market in the recent past (within the last 30 days).
CONCEPTS :
Volatility Risk Premium
The volatility risk premium (V-R-P) is the notion that implied volatility (IV) tends to be higher than realized volatility (HV) as market participants tend to overestimate the likelihood of a significant market crash.
This overestimation may account for an increase in demand for options as protection against an equity portfolio. Basically, this heightened perception of risk may lead to a higher willingness to pay for these options to hedge a portfolio.
In other words, investors are willing to pay a premium for options to have protection against significant market crashes even if statistically the probability of these crashes is lesser or even negligible.
Therefore, the tendency of implied volatility is to be higher than realized volatility, thus V-R-P being positive.
Realized/Historical Volatility
Historical Volatility (HV) is the statistical measure of the dispersion of returns for an index over a given period of time.
Historical volatility is a well-known concept in finance, but there is confusion in how exactly it is calculated. Different sources may use slightly different historical volatility formulas.
For calculating Historical Volatility I am using the most common approach: annualized standard deviation of logarithmic returns, based on daily closing prices.
Implied Volatility
Implied Volatility (IV) is the market's forecast of a likely movement in the price of the index and it is expressed annualized, using percentages and standard deviations over a specified time horizon (usually 30 days).
IV is used to price options contracts where high implied volatility results in options with higher premiums and vice versa. Also, options supply and demand and time value are major determining factors for calculating Implied Volatility.
Implied Volatility usually increases in bearish markets and decreases when the market is bullish.
For determining GOLD and SILVER implied volatility I used their volatility indices: GVZ and VXSLV (30-day IV) provided by CBOE.
Warning
Please be aware that because CBOE doesn’t provide real-time data in Tradingview, my V-R-P calculation is also delayed, so you shouldn’t use it in the first 15 minutes after the opening.
This indicator is calibrated for a daily time frame.
----------------------------------------------------------------------
ESPAŇOL
Este indicador (V-R-P) calcula la Prima de Riesgo de Volatilidad (de un mes) para GOLD y SILVER.
V-R-P es la prima que pagan los hedgers sobre la Volatilidad Realizada para las opciones de GOLD y SILVER.
La prima proviene de los hedgers que pagan para asegurar sus carteras y se manifiesta en el diferencial entre el precio al que se venden las opciones (Volatilidad Implícita) y la volatilidad que finalmente se realiza en el ORO y la PLATA (Volatilidad Realizada).
Estoy utilizando la Volatilidad Implícita (IV) de 30 días y la Volatilidad Realizada (HV) de 21 días como base para mi cálculo, ya que un mes de IV se basa en 30 días calendario y un mes de HV se basa en 21 días de negociación.
Al principio, el indicador aparece en blanco y una etiqueta le indica que elija qué índice desea que el V-R-P represente en el gráfico. Use la configuración del indicador (la rueda dentada) para elegir uno de los metales preciosos (o ambos).
Junto con la línea V-R-P, el indicador mostrará su promedio móvil de un año dentro de un rango de +/- 15% (que puede cambiar) con fines de evaluación comparativa. Deberíamos considerar este rango como el V-R-P "normalizado" para el período real.
La línea Cero también está marcada en el indicador.
Interpretación
Cuando el V-R-P está dentro del rango "normalizado",... bueno... la volatilidad y la incertidumbre, como las ve el mercado de opciones, es "normal". Tenemos una “prima” de volatilidad que debería considerarse normal.
Cuando V-R-P está por encima del rango "normalizado", la prima de volatilidad es alta. Esto significa que los inversores están dispuestos a pagar más por las opciones porque ven una creciente incertidumbre en los mercados.
Cuando el V-R-P está por debajo del rango "normalizado" pero es positivo (por encima de la línea Cero), la prima que los inversores están dispuestos a pagar por el riesgo es baja, lo que significa que ven una disminución, pero no pronunciada, de la incertidumbre y los riesgos en el mercado.
Cuando V-R-P es negativo (por debajo de la línea Cero), tenemos COMPLACENCIA. Esto significa que los inversores ven el riesgo próximo como menor que lo que sucedió en el mercado en el pasado reciente (en los últimos 30 días).
CONCEPTOS :
Prima de Riesgo de Volatilidad
La Prima de Riesgo de Volatilidad (V-R-P) es la noción de que la Volatilidad Implícita (IV) tiende a ser más alta que la Volatilidad Realizada (HV) ya que los participantes del mercado tienden a sobrestimar la probabilidad de una caída significativa del mercado.
Esta sobreestimación puede explicar un aumento en la demanda de opciones como protección contra una cartera de acciones. Básicamente, esta mayor percepción de riesgo puede conducir a una mayor disposición a pagar por estas opciones para cubrir una cartera.
En otras palabras, los inversores están dispuestos a pagar una prima por las opciones para tener protección contra caídas significativas del mercado, incluso si estadísticamente la probabilidad de estas caídas es menor o insignificante.
Por lo tanto, la tendencia de la Volatilidad Implícita es de ser mayor que la Volatilidad Realizada, por lo cual el V-R-P es positivo.
Volatilidad Realizada/Histórica
La Volatilidad Histórica (HV) es la medida estadística de la dispersión de los rendimientos de un índice durante un período de tiempo determinado.
La Volatilidad Histórica es un concepto bien conocido en finanzas, pero existe confusión sobre cómo se calcula exactamente. Varias fuentes pueden usar fórmulas de Volatilidad Histórica ligeramente diferentes.
Para calcular la Volatilidad Histórica, utilicé el enfoque más común: desviación estándar anualizada de rendimientos logarítmicos, basada en los precios de cierre diarios.
Volatilidad Implícita
La Volatilidad Implícita (IV) es la previsión del mercado de un posible movimiento en el precio del índice y se expresa anualizada, utilizando porcentajes y desviaciones estándar en un horizonte de tiempo específico (generalmente 30 días).
IV se utiliza para cotizar contratos de opciones donde la alta Volatilidad Implícita da como resultado opciones con primas más altas y viceversa. Además, la oferta y la demanda de opciones y el valor temporal son factores determinantes importantes para calcular la Volatilidad Implícita.
La Volatilidad Implícita generalmente aumenta en los mercados bajistas y disminuye cuando el mercado es alcista.
Para determinar la Volatilidad Implícita de GOLD y SILVER utilicé sus índices de volatilidad: GVZ y VXSLV (30 días IV) proporcionados por CBOE.
Precaución
Tenga en cuenta que debido a que CBOE no proporciona datos en tiempo real en Tradingview, mi cálculo de V-R-P también se retrasa, y por este motivo no se recomienda usar en los primeros 15 minutos desde la apertura.
Este indicador está calibrado para un marco de tiempo diario.

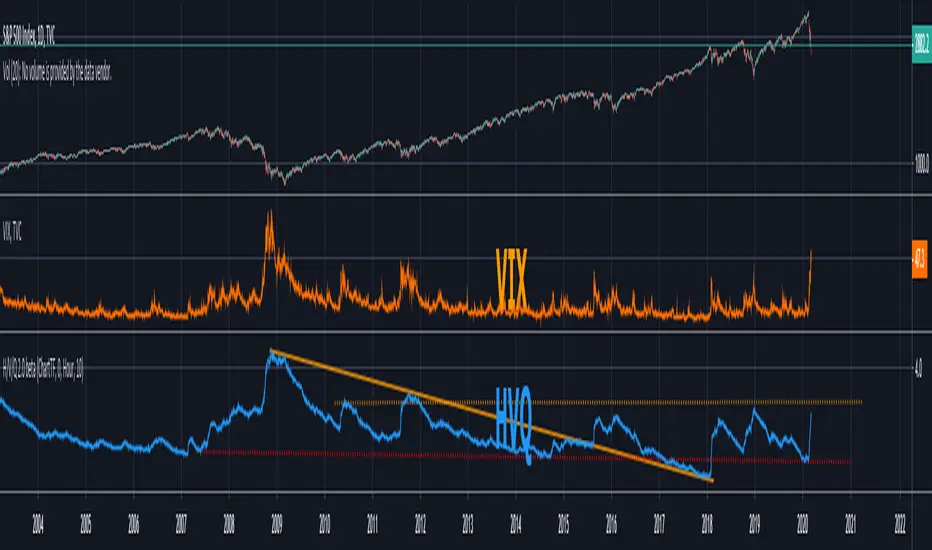
Volatility Risk Premium (VRP) 1.0ENGLISH
This indicator (V-R-P) calculates the (one month) Volatility Risk Premium for S&P500 and Nasdaq-100.
V-R-P is the premium hedgers pay for over Realized Volatility for S&P500 and Nasdaq-100 index options.
The premium stems from hedgers paying to insure their portfolios, and manifests itself in the differential between the price at which options are sold (Implied Volatility) and the volatility the S&P500 and Nasdaq-100 ultimately realize (Realized Volatility).
I am using 30-day Implied Volatility (IV) and 21-day Realized Volatility (HV) as the basis for my calculation, as one month of IV is based on 30 calendaristic days and one month of HV is based on 21 trading days.
At first, the indicator appears blank and a label instructs you to choose which index you want the V-R-P to plot on the chart. Use the indicator settings (the sprocket) to choose one of the indices (or both).
Together with the V-R-P line, the indicator will show its one year moving average within a range of +/- 15% (which you can change) for benchmarking purposes. We should consider this range the “normalized” V-R-P for the actual period.
The Zero Line is also marked on the indicator.
Interpretation
When V-R-P is within the “normalized” range, … well... volatility and uncertainty, as it’s seen by the option market, is “normal”. We have a “premium” of volatility which should be considered normal.
When V-R-P is above the “normalized” range, the volatility premium is high. This means that investors are willing to pay more for options because they see an increasing uncertainty in markets.
When V-R-P is below the “normalized” range but positive (above the Zero line), the premium investors are willing to pay for risk is low, meaning they see decreasing uncertainty and risks in the market, but not by much.
When V-R-P is negative (below the Zero line), we have COMPLACENCY. This means investors see upcoming risk as being lower than what happened in the market in the recent past (within the last 30 days).
CONCEPTS:
Volatility Risk Premium
The volatility risk premium (V-R-P) is the notion that implied volatility (IV) tends to be higher than realized volatility (HV) as market participants tend to overestimate the likelihood of a significant market crash.
This overestimation may account for an increase in demand for options as protection against an equity portfolio. Basically, this heightened perception of risk may lead to a higher willingness to pay for these options to hedge a portfolio.
In other words, investors are willing to pay a premium for options to have protection against significant market crashes even if statistically the probability of these crashes is lesser or even negligible.
Therefore, the tendency of implied volatility is to be higher than realized volatility, thus V-R-P being positive.
Realized/Historical Volatility
Historical Volatility (HV) is the statistical measure of the dispersion of returns for an index over a given period of time.
Historical volatility is a well-known concept in finance, but there is confusion in how exactly it is calculated. Different sources may use slightly different historical volatility formulas.
For calculating Historical Volatility I am using the most common approach: annualized standard deviation of logarithmic returns, based on daily closing prices.
Implied Volatility
Implied Volatility (IV) is the market's forecast of a likely movement in the price of the index and it is expressed annualized, using percentages and standard deviations over a specified time horizon (usually 30 days).
IV is used to price options contracts where high implied volatility results in options with higher premiums and vice versa. Also, options supply and demand and time value are major determining factors for calculating Implied Volatility.
Implied Volatility usually increases in bearish markets and decreases when the market is bullish.
For determining S&P500 and Nasdaq-100 implied volatility I used their volatility indices: VIX and VXN (30-day IV) provided by CBOE.
Warning
Please be aware that because CBOE doesn’t provide real-time data in Tradingview, my V-R-P calculation is also delayed, so you shouldn’t use it in the first 15 minutes after the opening.
This indicator is calibrated for a daily time frame.
ESPAŇOL
Este indicador (V-R-P) calcula la Prima de Riesgo de Volatilidad (de un mes) para S&P500 y Nasdaq-100.
V-R-P es la prima que pagan los hedgers sobre la Volatilidad Realizada para las opciones de los índices S&P500 y Nasdaq-100.
La prima proviene de los hedgers que pagan para asegurar sus carteras y se manifiesta en el diferencial entre el precio al que se venden las opciones (Volatilidad Implícita) y la volatilidad que finalmente se realiza en el S&P500 y el Nasdaq-100 (Volatilidad Realizada).
Estoy utilizando la Volatilidad Implícita (IV) de 30 días y la Volatilidad Realizada (HV) de 21 días como base para mi cálculo, ya que un mes de IV se basa en 30 días calendario y un mes de HV se basa en 21 días de negociación.
Al principio, el indicador aparece en blanco y una etiqueta le indica que elija qué índice desea que el V-R-P represente en el gráfico. Use la configuración del indicador (la rueda dentada) para elegir uno de los índices (o ambos).
Junto con la línea V-R-P, el indicador mostrará su promedio móvil de un año dentro de un rango de +/- 15% (que puede cambiar) con fines de evaluación comparativa. Deberíamos considerar este rango como el V-R-P "normalizado" para el período real.
La línea Cero también está marcada en el indicador.
Interpretación
Cuando el V-R-P está dentro del rango "normalizado",... bueno... la volatilidad y la incertidumbre, como las ve el mercado de opciones, es "normal". Tenemos una “prima” de volatilidad que debería considerarse normal.
Cuando V-R-P está por encima del rango "normalizado", la prima de volatilidad es alta. Esto significa que los inversores están dispuestos a pagar más por las opciones porque ven una creciente incertidumbre en los mercados.
Cuando el V-R-P está por debajo del rango "normalizado" pero es positivo (por encima de la línea Cero), la prima que los inversores están dispuestos a pagar por el riesgo es baja, lo que significa que ven una disminución, pero no pronunciada, de la incertidumbre y los riesgos en el mercado.
Cuando V-R-P es negativo (por debajo de la línea Cero), tenemos COMPLACENCIA. Esto significa que los inversores ven el riesgo próximo como menor que lo que sucedió en el mercado en el pasado reciente (en los últimos 30 días).
CONCEPTOS:
Prima de Riesgo de Volatilidad
La Prima de Riesgo de Volatilidad (V-R-P) es la noción de que la Volatilidad Implícita (IV) tiende a ser más alta que la Volatilidad Realizada (HV) ya que los participantes del mercado tienden a sobrestimar la probabilidad de una caída significativa del mercado.
Esta sobreestimación puede explicar un aumento en la demanda de opciones como protección contra una cartera de acciones. Básicamente, esta mayor percepción de riesgo puede conducir a una mayor disposición a pagar por estas opciones para cubrir una cartera.
En otras palabras, los inversores están dispuestos a pagar una prima por las opciones para tener protección contra caídas significativas del mercado, incluso si estadísticamente la probabilidad de estas caídas es menor o insignificante.
Por lo tanto, la tendencia de la Volatilidad Implícita es de ser mayor que la Volatilidad Realizada, por lo cual el V-R-P es positivo.
Volatilidad Realizada/Histórica
La Volatilidad Histórica (HV) es la medida estadística de la dispersión de los rendimientos de un índice durante un período de tiempo determinado.
La Volatilidad Histórica es un concepto bien conocido en finanzas, pero existe confusión sobre cómo se calcula exactamente. Varias fuentes pueden usar fórmulas de Volatilidad Histórica ligeramente diferentes.
Para calcular la Volatilidad Histórica, utilicé el enfoque más común: desviación estándar anualizada de rendimientos logarítmicos, basada en los precios de cierre diarios.
Volatilidad Implícita
La Volatilidad Implícita (IV) es la previsión del mercado de un posible movimiento en el precio del índice y se expresa anualizada, utilizando porcentajes y desviaciones estándar en un horizonte de tiempo específico (generalmente 30 días).
IV se utiliza para cotizar contratos de opciones donde la alta Volatilidad Implícita da como resultado opciones con primas más altas y viceversa. Además, la oferta y la demanda de opciones y el valor temporal son factores determinantes importantes para calcular la Volatilidad Implícita.
La Volatilidad Implícita generalmente aumenta en los mercados bajistas y disminuye cuando el mercado es alcista.
Para determinar la Volatilidad Implícita de S&P500 y Nasdaq-100 utilicé sus índices de volatilidad: VIX y VXN (30 días IV) proporcionados por CBOE.
Precaución
Tenga en cuenta que debido a que CBOE no proporciona datos en tiempo real en Tradingview, mi cálculo de V-R-P también se retrasa, y por este motivo no se recomienda usar en los primeros 15 minutos desde la apertura.
Este indicador está calibrado para un marco de tiempo diario.

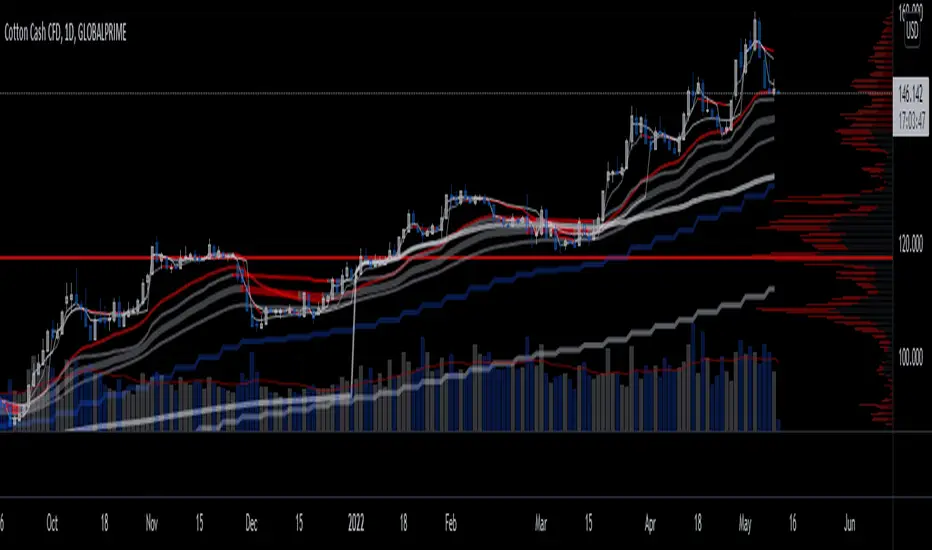
+ Magic Carpet BandsFun name for an indicator, eh? Well, it is true, I think; they look like magic carpets. They're actually pretty simple actually. They're Keltner Channels smoothed with a moving average. If you go down to the lookback period for the bands and set it to 1, you'll recognize them immediately.
Digging a bit deeper you see there are four magic carpets on the chart. The inner ones are set to a multiplier of 2, and the outer to a multiplier of 4. Each "carpet" is composed of two smoothed upper or lower Keltner Channels bounds, both with an optional offset, one of which is set to 13, and the other to 0 by default; and an optional color fill between these. There is also a color fill between the outer and inner carpets which gives them an interesting 3-dimensional aspect at times. They can look a bit like tunnels by default.
My thinking around the idea of using an offset with the bands is that if we assume these things to provide a dynamic support and resistance, and previous support and resistance maintains status as support and resistance until proven otherwise, then by putting an offset to past data we are creating a more obvious visual indication of that support or resistance in the present. The default offset is set to 13 bars back, so if price found resistance at some point around 13 bars ago, and price is currently revisiting it we assume it is still resistance, and that offset band is there to give us a strong visual aid. Obviously it's not foolproof, but nothing is.
Beyond that most interesting part of the indicator you have a nice selection of moving averages which the bands are calculated off of. By default it's set to my UMA. The bands themselves also have a selection of moving averages for how the keltner channels are smoothed. And a note: because the UMA and RDMA are averages of different length MAs, they can not be adjusted other than via the multiplier that sets the distance from the moving average.
The indicator is multi-timeframe, and the moving average can be colored based on a higher timeframe as well.
I popped in the divergence indicator here too. You can choose from RSI and OBV, and the divergences will be plotted on the chart. Working on finding a way to be able to have the bands/MA set to a higher timeframe while plotting the divergences on the chart timeframe, but don't have an answer to that yet.
Alerts for moving average crosses, band touches, and divergences.
I like this one a lot. Enjoy!
Pictures below.
s3.tradingview.com
One interesting thing about this indicator is that band twists often occur at areas of support or resistance. Simply drawing horizontal lines from previous twisted points can provide places from which you may look for strength or weakness to enter into a trade, or which you might use as targets for taking profits. The vertical lines are just showing the point on the chart when the cross occurred.
s3.tradingview.com
Above is a Jurik MA with a bunch of adjustments made to the bands, and the moving average itself. Everything is super adjustable, so you can play around and have fun with them quite a bit.
s3.tradingview.com
Just a different MA and bands.
s3.tradingview.com

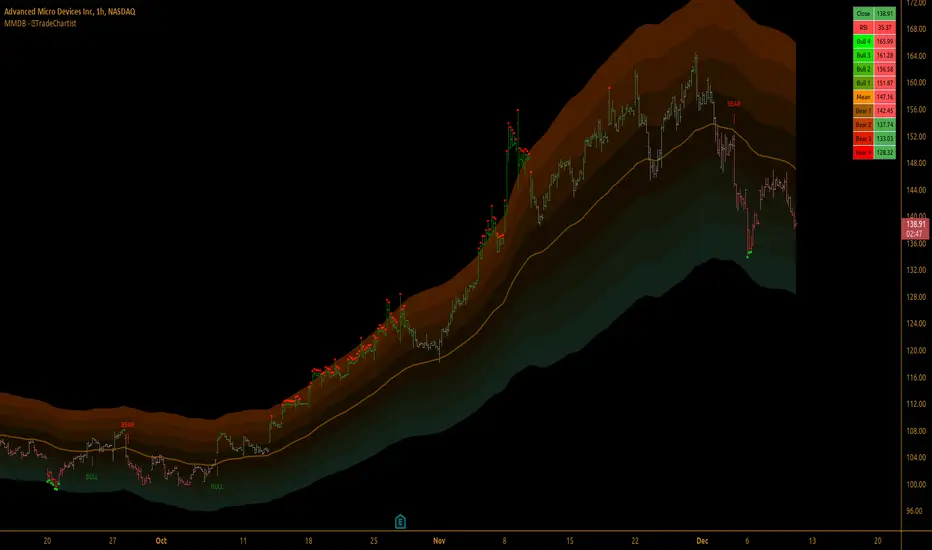
TradeChartist Mean Momentum Drift Bands (MMDB)™TradeChartist Mean Momentum Drift Bands (MMDB) is a Momentum indicator that plots a Mean Momentum line (calculated automatically from sample means of many lookback periods decided by the script logic) and Upper/Lower Drift Bands (calculated using standard deviation). The script helps spot price volatility, Oversold/Overbought zones and also generates high probability breakout signals without any user input.
===================================================================================================================
Features of ™TradeChartist MMDB
==============================
Momentum Mean and 4 upper/lower Drift bands.
No User input required.
3 Visual colour schemes - Chilli, Flame and Custom.
MMDB table that shows asset's price, RSI and values of Mean & Upper/Lower Drift bands
Breakout Signals (Bull and Bear arrows) based on price closing above or below the 1st Drift Band.
Overbought and Oversold zones.
Colour Bars based on Momentum strength.
Alerts for Bull and Bear Breakouts ( Once per bar close to be used).
===================================================================================================================
Example Charts
1. MMDB used along with ™TradeChartist MMDO (Mean Momentum Drift Oscillator) on 4hr chart of BINANCE:BTCUSDT
2. MMDB on 4hr chart of OANDA:XAUUSD
3. MMDB on 1hr chat of OANDA:SPX500USD
4. MMDB connected to ™TradeChartist Plug and Trade on BINANCE:LINKUSDTPERP
===================================================================================================================
Note: The script doesn't repaint, so the alerts can be used with confidence. To check this, users can do bar replay to confirm if the plots and markers stay in the same place.
===================================================================================================================
Best Practice: Test with different settings first using Paper Trades before trading with real money
===================================================================================================================
TSI in Dynamic Zones with Divergence and Pivot PointsTrue Strength Index , or TSI is considered a "leading indicator" - in contrast to a "lagging indicator" just as Moving Averages it does not show a confirmation what already happened, but it shows what can happen in the future. For example: The chart is climbing while the TSI oscillator is slowly declining, gets weaker and weaker, maybe even prints bearish divergences? That means that a reversal might be occurring soon. Leading indicators are best paired with Stop and Resistance Lines, General Trendlines , Fib Retracements etc. Your chart is approaching a very important Resistance Trendline but the TSI shows a very positive signal? That means there is a high probability that the Resistance is going to be pushed through and becomes Support in the future.
What are those circles?
-These are Divergences. Red for Regular-Bearish. Orange for Hidden-Bearish. Green for Regular-Bullish. Aqua for Hidden-Bullish.
What are those triangles?
- These are Pivots . They show when the TSI oscillator might reverse, this is important to know because many times the price action follows this move.
What are these blue or orange areas?
- Those are dynamic zones. For the analysis of the TSI its important to know if the indicator is in a state of oversold or overbought to filter out ranging price movement. Normally those zones are static, in this version of the TSI oscillator dynamic zones were added to show a dynamic calculation whether the TSI oscillator is oversold, overbought or ranging.
Please keep in mind that this indicator is a tool and not a strategy, do not blindly trade signals, do your own research first! Use this indicator in conjunction with other indicators to get multiple confirmations.

Bollinger Bands Fibonacci Ratios StrategyHello, everyone!
We have just released an innovative strategy for TradingView. It allows you to identify price pivot points and volatility.
This strategy is:
User-friendly
Configurable
Equipped with Bollinger Bands and smoothed ATR to measure volatility
Features
Thanks to the BB Fibo strategy, you can:
Trade stocks and commodities.
Identify price pivot points.
Choose any band for trading Long or Short positions.
Swap upper and lower bands applying Use Reverse Buy/Sell parameters.
Note! The upper bands are for the Long position. The lower bands are for the Short positions.
Parameters
We have equipped our strategy with more than 14 additional parameters. So, you can configure the EA according to your needs!
Inputs:
Length
Source: Open, High, Low, Close, HL2, HLC3, OHLC4
Offset
Fibonacci Ratio 1 — a Fibonacci factor for the 1st upper and lower indicator lines calculating.
Fibonacci Ratio 2 — a Fibonacci factor for the 2nd upper and lower indicator lines calculating.
Fibonacci Ratio 3 — a Fibonacci factor for the 3d upper and lower indicator lines calculating.
Use Reverse Buy — the strategy will use lower Bollinger bands instead of upper ones.
Fibonacci Buy — band selection for opening Long positions conditions.
Use Reverse Sell — the strategy will use upper Bollinger bands instead of lower ones.
Fibonacci Sell — band selection for opening Short positions conditions.
Style:
Basis — baseline color and style settings.
Upper 3 — the 3d upper line color and style.
Upper 2 — the 2nd upper line color and style.
Upper 1 — the 1st upper line color and style.
Lower 1 — the 1st lower line color and style.
Lower 2 — the 2nd lower line color and style.
Lower 3 — the 3d upper line color and style.
Background — the background color within the 3d upper and 3d lower indicator band.
Precision — the number of decimals for BB Fibo values.
Note! Try BB Fibo on your demo account first before going live.

Sigma Spikes [CC]Sigma Spikes were created by Adam Grimes and this is one of the best volatility indicators out there. This indicator not only gives you positive or negative volatility but with my version I can identify any sudden changes from the underlying trend. Buy when the line turns green and sell when it turns red.
Let me know if there were any other indicators you wanted to see me publish!
Bollinger Band Width PercentileIntroducing the Bollinger Band Width Percentile
Definitions :
Bollinger Band Width Percentile is derived from the Bollinger Band Width indicator.
It shows the percentage of bars over a specified lookback period that the Bollinger Band Width was less than the current Bollinger Band Width.
Bollinger Band Width is derived from the Bollinger Bands® indicator.
It quantitatively measures the width between the Upper and Lower Bands of the Bollinger Bands.
Bollinger Bands® is a volatility-based indicator.
It consists of three lines which are plotted in relation to a security's price.
The Middle Line is typically a Simple Moving Average.
The Upper and Lower Bands are typically 2 standard deviations above, and below the SMA (Middle Line).
Volatility is a statistical measure of the dispersion of returns for a given security or market index, measured by the standard deviation of logarithmic returns.
The Broad Concept :
Quoting Tradingview specifically for commonly noted limitations of the BBW indicator which I have based this indicator on....
“ Bollinger Bands Width (BBW) outputs a Percentage Difference between the Upper Band and the Lower Band.
This value is used to define the narrowness of the bands.
What needs to be understood however is that a trader cannot simply look at the BBW value and determine if the Band is truly narrow or not.
The significance of an instruments relative narrowness changes depending on the instrument or security in question.
What is considered narrow for one security may not be for another.
What is considered narrow for one security may even change within the scope of the same security depending on the timeframe.
In order to accurately gauge the significance of a narrowing of the bands, a technical analyst will need to research past BBW fluctuations and price performance to increase trading accuracy. ”
Here I present the Bollinger Band Width Percentile as a refinement of the BBW to somewhat overcome the limitations cited above.
Much of the work researching past BBW fluctuations, and making relative comparisons is done naturally by calculating the Bollinger Band Width Percentile.
This calculation also means that it can be read in a similar fashion across assets, greatly simplifying the interpretation of it.
Plotted Components of the Bollinger Band Width Percentile indicator :
Scale High
Mid Line
Scale Low
BBWP plot
Moving Average 1
Moving Average 2
Extreme High Alert
Extreme Low Alert
Bollinger Band Width Percentile Properties:
BBWP Length
The time period to be used in calculating the Moving average which creates the Basis for the BBW component of the BBWP.
Basis Type
The type of moving average to be used as the Basis for the BBW component of the BBWP.
BBWP Lookback
The lookback period to be used in calculating the BBWP itself.
BBWP Plot settings
The BBWP plot settings give a choice between a user defined solid color, and a choice of "Blue Green Red", or "Blue Red" spectrum palettes.
Moving Averages
Has 2 Optional User definable and adjustable moving averages of the BBWP.
Visual Alerts
Optional User adjustable High and low Signal columns.
How to read the BBWP :
A BBWP read of 95 % ... means that the current BBW level is greater than 95% of the lookback period.
A BBWP read of 5 % .... means that the current BBW level is lower than 95% of the lookback period.
Proposed interpretations :
When the BBWP gets above 90 % and particularly when it hits 100% ... this can be a signal that volatility is reaching a maximum and that a macro High or Low is about to be set.
When the BBWP gets below 10 % and particularly when it hits 0% ...... this can be a signal that volatility is reaching a minimum and that there could be a violent range breakout into a trending move.
When the BBWP hits a low level < 5 % and then gets above its moving average ...... this can be an early signal that a consolidation phase is ending and a trending move is beginning.
When the BBWP hits a high level > 95 % and then falls below its moving average ... this can be an early signal that a trending move is ending and a consolidation phase is beginning.
Essential knowledge :
The BBWP was designed with the daily timeframe in mind, but technical analysists may find use for it on other time frames also.
High and Low BBWP readings do not entail any direction bias.
Deeper Concepts :
In finance, “mean reversion” is the assumption that a financial instrument's price will tend to move towards the average price over time.
If we apply that same logic to volatility as represented here by the Bollinger band width percentile, the assumption is that the Bollinger band width percentile will tend to contract from extreme highs, and expand from extreme lows over time corresponding to repeated phases of contraction and expansion of volatility.
It is clear that for most assets there are periods of directional trending behavior followed by periods of “consolidation” ( trading sideways in a range ).
This often ends with a tightening range under reducing volume and volatility ( popularly known as “the squeeze” ).
The squeeze typically ends with a “breakout” from the range characterized by a rapid increase in volume, and volatility when price action again trends directionally, and the cycle repeats.
Typical Use Cases :
The Bollinger Band Width Percentile may be especially useful for Options traders, as it can provide a bias for when Options are relatively expensive, or inexpensive from a Volatility (Vega) perspective.
When the Bollinger Band Width Percentile is relatively high ( 85 percentile or above ) it may be more advantageous to be a net seller of Vega.
When the Bollinger Band Width Percentile is relatively low ( 15 percentile or below ) it may be advantageous to be net long Vega.
Here we examine a number of actionable signals on BTCUSD daily timeframe using the BBWP and a momentum oscillator ( using the TSI here but can equally be used with Bollinger bands, moving averages, or the traders preferred momentum oscillator ).
In this first case we will examine how a spot trader and an options trader could each use a low BBWP read to alert them to a good potential trade setup.
note: using a period of 30 for both the Bollinger bands and the BBWP period ( approximately a month ) and a BBWP lookback of 350 ( approximately a year )
As we see the Bollinger Bands have gradually contracted while price action trended down and the BBWP also fell consistently while below its moving average ( denoting falling volatility ) down to an extremely low level <5% until it broke above its moving average along with a break of range to the upside ( signaling the end of the consolidation at a low level and the beginning of a new trending move to the upside with expanding volatility).
In this next case we will continue to follow the price action presuming that the traders have taken or locked in profit at reasonable take profit levels from the previous trade setup.
Here we see the contraction of the Bollinger bands, and the BBWP alongside price action breaking below the BB Basis giving a warning that the trending move to the upside is likely over.
We then see the BBWP rising and getting above its moving average while price action fails to get above the BB Basis, likewise the TSI fails to get above its signal line and actually crosses below its zeroline.
The trader would normally take this as a signal that the next trending move could be to the downside.
The next trending move turns out to be a dramatic downside move which causes the BBWP to hit 100% signaling that volatility is likely to hit a maximum giving good opportunities for profitable trades to the skilled trader as outlined.
Limitations :
Here we will look at 2 cases where blindly taking BBWP signals could cause the trader to take a failed trade.
In this first example we will look at blindly taking a low volatility options trade
Low Volatility and corresponding low BBWP levels do not automatically mean there has to be expansion immediately, these periods of extreme low volatility can go on for quite some time.
In this second example we will look at blindly taking a high volatility spot short trade
High volatility and corresponding high BBWP levels do not automatically mean there has to be a macro high and contraction of volatility immediately, these periods of extreme high volatility can also go on for quite some time, hence the famous saying "The trend is your friend until the end of the trend" and lesser well known, but equally valid saying "never try to short the top of a parabolic blow off top"
Markets are variable and past performance is no guarantee of future results, this is not financial advice, I am not a financial advisor.
Final thoughts
The BBWP is an improvement over the BBW in my opinion, and is a novel, and useful addition to a Technical Analysts toolkit.
It is not a standalone indicator and is meant to be used in conjunction with other tools for direction bias, and Good Risk Management to base sound trades off.
John Bollinger has suggested using Bolliger bands, and its related indicators with two or three other non-correlated indicators that provide more direct market signals.
He believes it is crucial to use indicators based on different types of data.
Some of his favored technical techniques are moving average divergence/convergence (MACD), on-balance volume and relative strength index (RSI).
Thanks
Massive respect to John Bollinger, long-time technician of the markets, and legendary creator of both the Bollinger Bands® in the 1980´s, and the Bollinger band Width indicator in 2010 which this indicator is based on.
His work continues to inspire, decades after he brought the original Bollinger Bands to the market.
Much respect also to Eric Crown who gave me the fundamental knowledge of Technical Analysis, and Options trading.

Candle Percent Volatility by AllenlkThis indicator gives you the percentage movement of each candle. Measurements are taken between the candle High point and Low point, and also between the Open and Close and calculated in percent %. From there it smooths out the data with a moving average. This gives you an idea of how much volatility is within each candle given the time resolution of the chart.
I like to use this information as a way to turn off a strategy, or select a proper time resolution for a strategy. If each candle has less than 2.5% Volatility most strategies will typically buy and sell rapidly at prices that are too close together, potentially losing money. During those times it seems best to either temporarily turn off the strategy, change the time resolution or switch to another strategy.

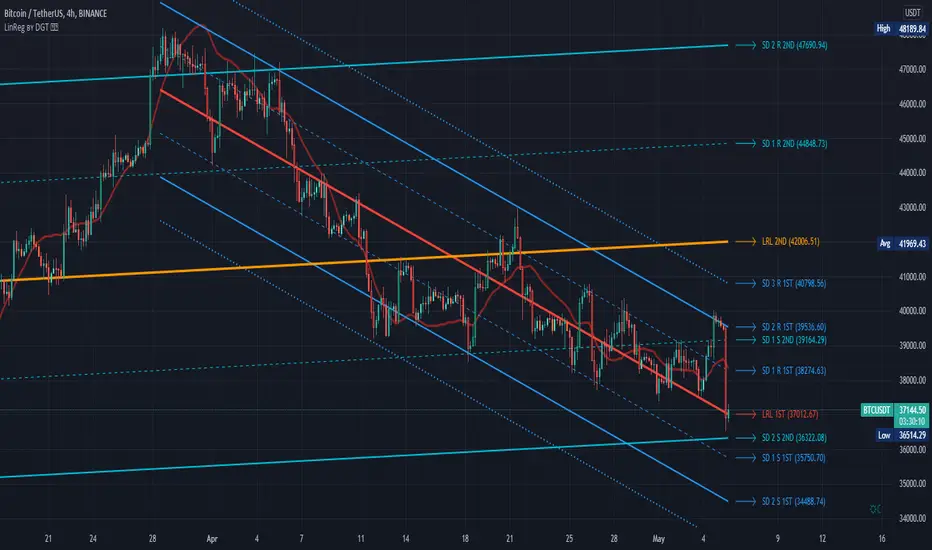
Linear Regression Channel / Curve / Slope by DGTTʜᴇ Lɪɴᴇᴀʀ Rᴇɢʀᴇꜱꜱɪᴏɴ Cʜᴀɴɴᴇʟꜱ
Linear Regression Channels are useful measure for technical and quantitative analysis in financial markets that help identifying trends and trend direction. The use of standard deviation gives traders ideas as to when prices are becoming overbought or oversold relative to the long term trend
The basis of a linear regression channel
Linear Regression Line – is a line drawn according to the least-squares statistical technique which produces a best-fit line that cuts through the middle of price action, a line that best fits all the data points of interest. The resulting fitted model can be used to summarize the data, to predict unobserved values from the same system. Linear Regression Line then present basis for the channel calculations
The linear regression channel
2. Upper Channel Line – A line that runs parallel to the Linear Regression Line and is usually one to two standard deviations above the Linear Regression Line.
3. Lower Channel Line – This line runs parallel to the Linear Regression Line and is usually one to two standard deviations below the Linear Regression Line.
Unlike Fibonacci Channels and Andrew’s Pitchfork, Linear Regression Channels are calculated using statistical methods, both for the regression line (as expressed above) and deviation channels. Upper and Lower channel lines are presenting the idea of bell curve method, also known as a normal distribution and are calculated using standard deviation function.
A standard deviation include 68% of the data points, two standard deviations include approximately 95% of the data points and any data point that appears outside two standard deviations is very rare.
It is often assumed that the data points will move back toward the average, or regress and channels would allow us to see when a security is overbought or oversold and ready to revert to the mean
please note : Over time, the price will move up and down, and the linear regression channel will experience changes as old prices fall off and new prices appear
█ Linear Regression Study Features
Linear Regression Channel
- Linear regression line as basis
- Customizable multiple channels based on Standard Deviation
- ALERTs for the channel levels
Linear Regression Curve
- Linear regression curve as basis
- Optional : Bands based on Standard Deviation or Volatility (ATR). Bands are applied with fixed levels 1, 2 and 3 times StdDev or ATR away from the curve
Linear Regression Slope
- Optional : Up/Down slope arrows for a used defined period
█ Volume / Volatility Add-Ons
High Volatile Bar Indication
Volume Spike Bar Indication
Volume Weighted Colored Bars
FXBABATRADING ~ ZRANGE IndicatorOur ZRange indicator is an outstanding indicator to measure Volatility , that is, how much price has deviated from the mean. This indicator is part of a bundle of 5 indicators which we call the ZScore Indicator Suite all based on the ZScore function of statistics.
In this particular mode (ZRange) you can see whether the actual Standard Deviation is above or below the mean average of the Standard Deviation (period of your choice) determined by a + or - value. The value itself represents a Standard Deviation multiplier. A reading below ZERO simulates the Bollinger Band Squeeze, a time of price consolidation that is bound to break. Ideally you want to enter trades when the value of ZRange is increasing and above the signal line.
Alerts are provided for when volatility is increasing and or decreasing. Alerts can be turned off in settings.
Strategies where price is trending sideways will benefit when the ZRange is decreasing as it signifies price entering consolidation.
Each indicator in the ZScore Suite has a particular function:
ZClassic: Measures the position of Price in relation to a set average in units of standard deviation.
ZRange: Measures the position of the Standard Deviation itself in relation to a set average, in units of standard deviation.
ZVolumeDelta: Measures the position of Volume Delta in relation to a set average, in units of standard deviation.
ZTrend: Its a custom mathematical function that allows to measure the strength and direction of the Trend in reference to a set average.

Implied volatility indicator - Bouhmidi-Bands Volatility trading with the Bouhmidi-Bands
Most known indicators such as Bollinger Bands or Keltner Channel focus only on historical volatility. Bouhmidi bands follow a different approach, namely an indicator based on implied volatility.
Style tags: Implied Volatility, Volatility Trading, Trend Analysis
Asset class: Equities, Futures, Commodities
Dataset: Minutes / Hours
Description
The most famous volatility indicators such as Bollinger Bands , Keltner Channel , Donchian Channels , etc. all use the historical volatility of the underlying asset. However, volatility is determined not only by historical volatility but also by implied volatility. The additional analysis of implied volatility sharpens the view and improves trading.
The Bouhmidi Bands ® were developed by myself and are based on implied volatility. They calculate an expected daily bandwidth under the assumption of normally distributed returns. The bandwidth is based on 1σ or 2σ. This means that an underlying closes with a probability of 68% or 95% within the expected Bouhmidi bandwidth at the end of the day. Check the historical development. The track record over the past 20 years shows a strong robustness of the indicator.
Benefits using Bouhmidi bands
- The Bouhmidi bands can be used to identify and filter "invisible" resistance and support that cannot be detected with simple chart analysis.
- The Bouhmidi bands can be used for different trading approaches. For example, they are suitable for mean reversion and volatility breakouts.
- If you combine the Bouhmidi bands with e.g. Keltner channel or Bollinger bands, you have the historical and implied volatility in one view in your tradingview chart.
Which underlyings can I trade with the Bouhmidi bands?
To determine the Bouhmidi bands, we need the underlying and the corresponding implied volatility index:
- S&P 500 - VIX
- DAX - VDAX-NEW
- Dow Jones - VXD
- Nasdaq 100 - VXN
- Gold - GVZ
- WTI - OVX
- Apple - VXAPL
- Amazon - VXAZN
- Google - VXGOG
- IBM - VXIBM

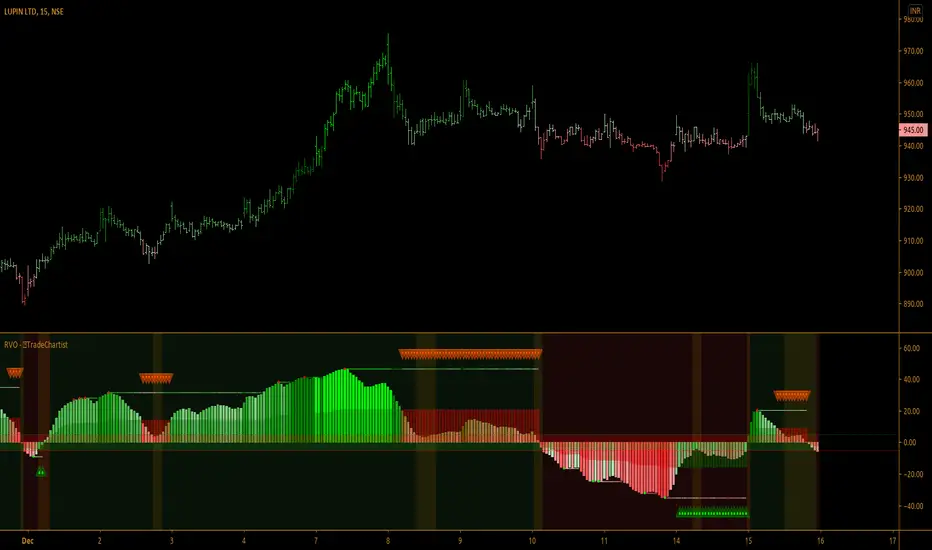
Relative Volatility OscillatorRelative Volatility Oscillator is a volatility based oscillator and works very well on Lower Time Frames on volatile assets. It uses one of five periods (34,55,89,144,233) to calculate relative volatility of the current bar with the volatility trend of one of the 5 periods from the settings, using percentile rank.
Features of Relative Volatility Oscillator
Choice of one of five periods for the Relative Volatility Oscillator plot.
SOS Triangles to indicate Bull/Bear Exhaustion.
Option to plot Volatility Zones. Oscillator Values between -5 and 5 will be plotted using exhaustion colours and can be used to monitor trades closely for trend reversals.
Choice of 3 colour themes including option to plot trend based coloured price bars.
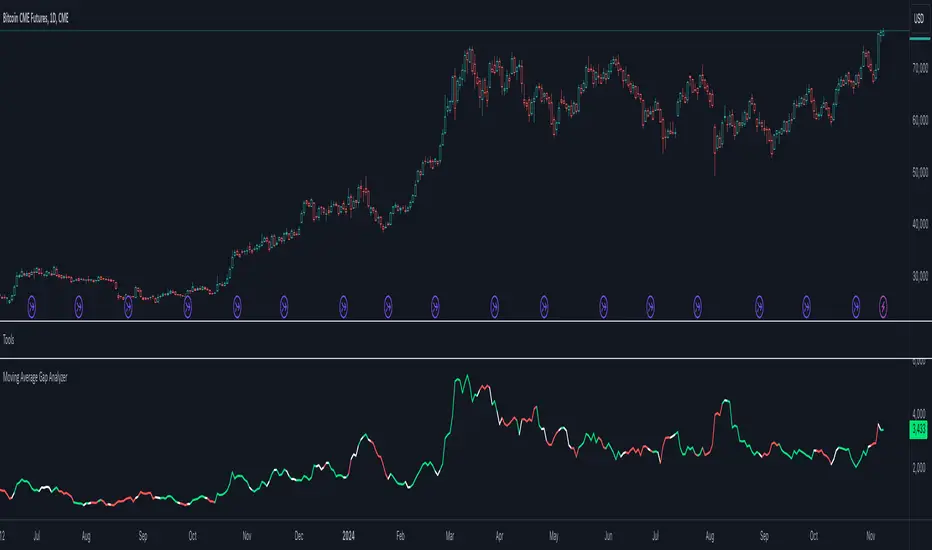
Moving Average Gap AnalyzerExtremely simple algorithm in order to calculate the gap between 2 simple moving averages. Analyzing perspective defines the line of color as white, green or red. This is done by checking sources of both moving averages and evaluate their past values with the mutual length respectively. Analysis is done by scoring the movements of sources.
What to expect?
- Higher the gap, higher the volatility.
- If the analysis line is green sources have been raising (most likely bull market), if the analysis line is white the market is mostly likely close to horizontal, if the analysis line is red, sources have been decreasing gradually (most likely bear market).
ps. Genuine indicator idea of me. This indicator is not a product or an idea of any group I work with. Completely clear of all types of IP.
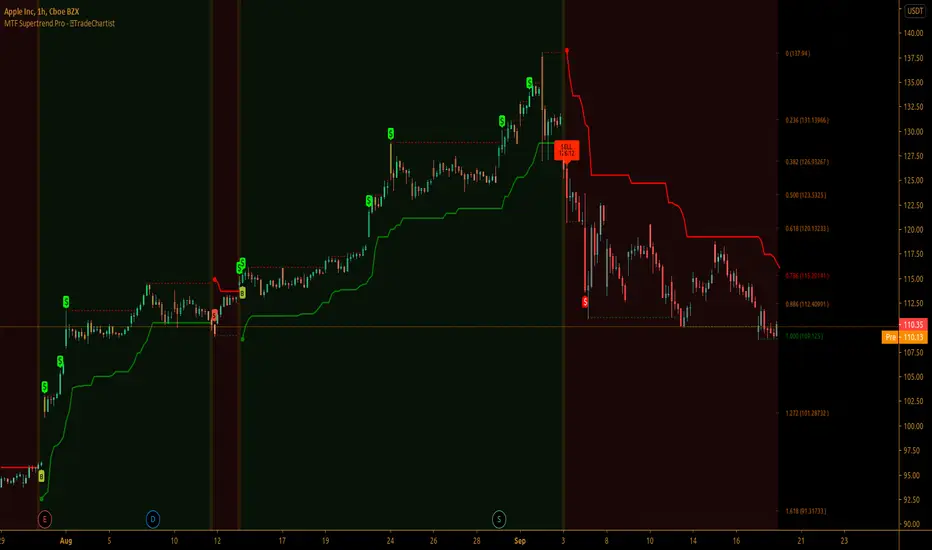
TradeChartist MTF Supertrend Pro™TradeChartist MTF SuperTrend Pro is the Multi Time-Frame version (using timeframe multiplier) of classic Volatility Stop or SuperTrend (Stop and Reverse indicator using multiple of Average True Range of lookback period trailing behind the price acting as both trend reversal signifier and StopLoss trigger at the same time ).
What does ™TradeChartist MTF SuperTrend Pro include?
Multi Time-Frame option using Time-Frame Multiplier to plot Higher Time Frame SuperTrend plot on Lower Time-Frame chart.
Auto-fibs - 2 types (1. Retracement from last significant high/low to previous significant low/high, 2. Retracement from Current High/Low to previous significant Low/High).
Trend identifying color bars.
Trend identifying Background colour.
Option to detect bars where Profit Taking is recommended using $ sign.
How to create Alerts for ™TradeChartist MTF SuperTrend Pro Long and Short Entries?
Alerts can be created for Long or Short entries using Once Per Bar as BUY and SELL labels appear with entries only on confirmation after bar close.
Does the indicator include Stop Loss and Take Profit plots?
This script doesn't have Stop Loss and Take Profit plots, but it can be connected to TradeChartist Plug and Trade as Non-Oscillatory signal to generate Automatic Targets, user set StopLoss and Take Profit plots and to create all types of alerts too.
Does this indicator repaint?
No. This script doesn't repaint as it confirms its signals only after close above/below SuperTrend plot and also uses security function to call higher time-frame values in the right way to avoid repainting. This can be verified using Bar Replay to check if the plots and fills stay in the same bar in real time as the Bar Replay.
===================================================================================================================
Tip 1: Using 1.618 as Timeframe Multiplier results in lucrative trades on most timeframes with ATR multiplier 1.618, 2.618 or 3.618. (Best Practice: Test with various values first on asset using Paper Trades before trading with real money)
Tip 2: Using bars, candles with no borders or Hollow Candles results in clear trend spotting with Bar color option enabled in settings.
===================================================================================================================
Chart below shows Performance of MTF SuperTrend Pro connected to Plug and Trade using Default settings.
===================================================================================================================
This is not a free to use indicator. Get in touch with me (PM me directly if you would like trial access to test the indicator)
Premium Scripts - Trial access and Information
Trial access offered on all Premium scripts.
PM me directly to request trial access to the scripts or for more information.
===================================================================================================================
Cross Asset VolatilityThis script brings together a number of volatility indexes from the CBOE in one space making it easier to use rather than adding a number of different securities to one chart. One could create a template with these securities attached, but sometimes, you don't want to switch charts, for whatever reason, and adding an indicator for is quick and simple.
One note is that due some securities exhibit much larger volatility than others (i.e. oil vs bonds) and it can be difficult to see clearly those securities whose volatilities are low, and hence we have added the ability to calculate the values as a Log value to make the indicator more readable. Another way to do this is to change the Y-axis on the chart to Logarithmic while leaving the indicator at its default settings (i.e. the checkbox for using Log calculations remains unchecked).

H/V/Q Volatility Index v2.0This is a standalone version of the volatility calculation used in QuantRsi. It is a relatively complex volatility-specific filtering calculation designed to give deeper insight into volatility trends for any asset class.
Use with Log scaling on the indicator's value scalar.
This tool offers an alternative model for volatility calculation. Experience using this tool proves that it extends the efficacy of volatility prediction techniques, and allows deeper technical analysis within volatility moves.
Use alongside conventional volatility indices to find opportunities within option chains to long or short volatility when HVQ provides evidence for volatility reversal that other options value models have not priced in.
Use as part of a predictive based risk management strategy.
Use alongside QuantRsi and HeffaeClouds as a complete trading suite, sans volume analysis, and gain insight not offered by any other indicator set.
SETTINGS:
TimeFrame settings:
Chart/Custom timeframe inputs are carried over from HeffaeClouds and QuantRsi indicators. Allows you to assign any non-chart timeframe to the indicator:
"ChartTF" follows your chart's selected resolution / TimeFrame
"Non-Chart TimeFrame" is an integer for your custom TimeFrame, the setting below:
"Non-Chart TimeFrame" selects "Minutes, Hours, Days" that corresponds to the above setting for a custom TimeFrame.
More Settings:
"Invert Output switch" will invert the volatility chart scale. Useful for visualizing some trends on assets that regularly correlate large volatility spikes with disorderly selloffs.
"Show High/Low Volt range" switch (experimental) shows the high/low extremes of alternate volatility window calculations. There is insight to be gained from large differences v.s. all ranges trending near the same values.
"Relative value switch" (experimental) divides the HVQ values by the hl2 candle price, per candle. This is a unique way to filter the output, visualize the volatility value per asset value.
"Range Multiplier" adjusts the average window length HVQ uses for calculations. This has been finely tuned so that the value of "10" corresponds to the best average fitting of all assets and timeframes. In most situations TimeFrame should be used to alter the real window periods and this should be left at default. Instead you can change this to find better fitting if you'd like.
If there is a feature you would like, question answered, or a bug to report, visit the TradingView SNOW_CITY public chat-room; link in my signature
Use the pastebin link below for indicator access information and pricing