Delta AO + Regular AO (Normalized)🔀 Delta AO + Regular AO (Normalized) – Visualizing Market moods becomes simpler 🔀
🧠 Introduction
The Delta AO + Regular AO (Normalized) is a custom oscillator that fuses the power of classic momentum analysis with volume-derived delta flow to give traders a dual-perspective edge.
This tool was born from a need to better visualize internal market thrust (via delta) while still respecting the time-tested signal power of the traditional Awesome Oscillator (AO).
🔍 What makes it unique?
✅ Volume-based Delta Calculation – Models upward/downward delta using a custom volatility-weighted volume allocation method, not simple tick-delta or raw buys/sells.
✅ Cumulative Delta Candles – Instead of just plotting bars, the indicator rebuilds the market structure using cumulative delta logic.
✅ Dual AO Display – Shows both custom delta AO and traditional price AO simultaneously.
✅ Normalized Scaling – Each AO is independently normalized by its standard deviation (volatility-adjusted), making both indicators visually comparable without distortion.
🧮 Under the Hood
Let’s break down the components:
1. Delta Logic 📊
Rather than using raw delta or tick-level data, this script simulates net effort:
Delta Up = Volume × a smart weighting when the candle is bullish
Delta Down = Volume × weighting when the candle is bearish
The weighting dynamically adjusts based on candle body-to-wick ratio. This provides a more refined delta estimate based on candle structure.
This delta is accumulated (cumulative delta) and used to form a synthetic OHLC candle structure.
2. AO Calculations ⚖️
Custom AO: Calculated from the median of synthetic delta candles
Regular AO: Classic (median price 5-period SMA - 34-period SMA)
Both are normalized using their own 34-bar standard deviation, improving comparability and visualization in one pane.
3. Color Coding 🎨
For the delta AO histogram:
Lime: Bullish + Increasing Momentum
Green: Bullish + Weakening Momentum
Red: Bearish + Increasing Momentum (to the downside)
Maroon: Bearish + Weakening Momentum
This lets you immediately spot momentum shifts and strength behind volume-based moves.
📈 How to Use – Trading Guide
🔧 Recommended Setup:
Timeframe: Works well on all intraday and higher timeframes (5m–1D)
Symbol: Especially effective on liquid instruments (futures, indices, large caps)
✅ Entry Signals
🔹 Buy Setup
Delta AO turns green or lime above zero, and Regular AO is also rising
Ideal confirmation: Lime bar (strong bullish delta momentum) and a crossover above zero
🔹 Sell Setup
Delta AO turns maroon or red below zero, and Regular AO is also falling
Ideal confirmation: Red bar (strong bearish delta momentum) and AO falling further below zero
🔄 Momentum Confirmation
Look for divergence between the Delta AO and Regular AO.
🔼 If Delta AO is rising but Regular AO is flat or falling → Volume is leading price (possible breakout ahead)
🔽 If Regular AO is strong but Delta AO fades → Price may be unsustainable (fakeout risk)
🛑 Exit / Reversal Clues
Sudden color shifts (e.g., Lime → Green → Maroon) can signal momentum exhaustion
Both AOs converging to zero suggests consolidation phase ahead
📌 Pro Tips
Use this with volume profile, support/resistance, or market structure zones for maximum confluence
Works great as a secondary confirmation tool for your existing strategy
💬 Final Thoughts
This oscillator is not just a pretty double AO — it's a strategic fusion of price and volume time-series designed to help you anticipate shifts before they’re obvious in price alone.
If you're looking for:
A modernized AO
Volume-integrated signal clarity
Normalized, noise-filtered momentum visual
Then this tool belongs in your chart arsenal.
📈 Try it. Test it. Pair it. If you find value, consider sharing or following for more next-gen indicators.
Please note this is an educational idea and past performance is not assurance of future performance.
Happy trading!
— @Pratik_4Clover
Volumeanalysis

MissedPrice Volume Method[KiomarsRakei]█ Core Concept:
This script detects price zones that are highly likely to be revisited — areas where price moved too quickly to fully fill market activity. Using sharp volume shifts and volatility filters, the script identifies these “missed” levels and generates signals pointing toward them.
Signals are generated before price reaches the zone, allowing you to analyze price behavior both before and after the zone is touched. These zones often act like magnets for price, making them ideal for short-term.
Examples of signals and high hit rate of Missed zones
█ How It Works:
The script monitors 3-candle volume and price behavior to detect moments where volume accelerates abnormally compared to recent averages. When a potential missed zone is found and price hasn’t revisited it yet, a signal is created in advance, pointing to that zone as a likely future target.
█ Features:
Zone Visualization: Dynamic boxes show price targets based on missed volume areas.
Pre-Zone Signals: Alerts fire before price returns, offering early trade setups.
Stat Tracking System: Automatically logs signals, win rate, and average profit.
Live Performance Table: On-chart stats including hit/miss breakdown and late-return analysis.
Works on All Markets: Compatible with any chart that provides volume — crypto, forex, indices, or stocks.
A signal is considered successful when price touches the zone. However, not all zones are guaranteed to be revisited.
█ Key Inputs & Stats Table:
Volume Filters: Control signal sensitivity using min/max relative volume shift.
Zone & Line Settings: Adjust how long the zone stays visible and whether entry lines are drawn.
Custom Colors: Choose colors for buy/sell zones, lines, and visuals.
📊 Table Metrics:
Total Signals: Count of all generated signals.
Win Rate: % of signals where price returned to the zone (hit = touched the zone, regardless of timing).
Bad Signals: Signals that took too long to hit or were never hit.
Bad but Hit: Signals marked bad but eventually touched the zone.
Bad signals are marked in red. These indicate zones that price failed to reach within the expected time window, showing where the script identified a target that remained unfulfilled.

Dynamic Liquidity Depth [BigBeluga]
Dynamic Liquidity Depth
A liquidity mapping engine that reveals hidden zones of market vulnerability. This tool simulates where potential large concentrations of stop-losses may exist — above recent highs (sell-side) and below recent lows (buy-side) — by analyzing real price behavior and directional volume. The result is a dynamic two-sided volume profile that highlights where price is most likely to gravitate during liquidation events, reversals, or engineered stop hunts.
🔵 KEY FEATURES
Two-Sided Liquidity Profiles:
Plots two separate profiles on the chart — one above price for potential sell-side liquidity , and one below price for potential buy-side liquidity . Each profile reflects the volume distribution across binned zones derived from historical highs and lows.
Real Stop Zone Simulation:
Each profile is offset from the current high or low using an ATR-based buffer. This simulates where traders might cluster their stop-losses above swing highs (short stops) or below swing lows (long stops).
Directional Volume Analysis:
Buy-side volume is accumulated only from bullish candles (close > open), while sell-side volume is accumulated only from bearish candles (close < open). This directional filtering enhances accuracy by capturing genuine pressure zones.
Dynamic Volume Heatmap:
Each liquidity bin is rendered as a horizontal box with a color gradient based on volume intensity:
- Low activity bins are shaded lightly.
- High-volume zones appear more vividly in red (sell) or lime (buy).
- The maximum volume bin in each profile is emphasized with a brighter fill and a volume label.
Extended POC Zones:
The Point of Control (PoC) — the bin with the most volume — is extended backwards across the entire lookback period to mark critical resistance (sell-side) or support (buy-side) levels.
Total Volume Summary Labels:
At the center of each profile, a summary label displays Total Buy Liquidity and Total Sell Liquidity volume.
This metric helps assess directional imbalance — when buy liquidity is dominant, the market may favor upward continuation, and vice versa.
Customizable Profile Granularity:
You can fine-tune both Resolution (Bins) and Offset Distance to adjust how far profiles are displaced from price and how many levels are calculated within the ATR range.
🔵 HOW IT WORKS
The indicator calculates an ATR-based buffer above highs and below lows to define the top and bottom of the liquidity zones.
Using a user-defined lookback period, it scans historical candles and divides the buffered zones into bins.
Each bin checks if bullish (or bearish) candles pass through it based on price wicks and body.
Volume from valid candles is summed into the corresponding bin.
When volume exists in a bin, a horizontal box is drawn with a width scaled by relative volume strength.
The bin with the highest volume is highlighted and optionally extended backward as a zone of importance.
Total buy/sell liquidity is displayed with a summary label at the side of the profile.
🔵 USAGE/b]
Identify Stop Hunt Zones: High-volume clusters near swing highs/lows are likely liquidation zones targeted during fakeouts.
Fade or Follow Reactions: Price hitting a high-volume bin may reverse (fade opportunity) or break with strength (confirmation breakout).
Layer with Other Tools: Combine with market structure, order blocks, or trend filters to validate entries near liquidity.
Adjust Offset for Sensitivity: Use higher offset to simulate wider stop placement; use lower for tighter scalping zones.
🔵 CONCLUSION
Dynamic Liquidity Depth transforms raw price and volume into a spatial map of liquidity. By revealing areas where stop orders are likely hidden, it gives traders insight into price manipulation zones, potential reversal levels, and breakout traps. Whether you're hunting for traps or trading with the flow, this tool equips you to navigate liquidity with precision.

Institutional Support/Resistance Locator🏛️ Institutional Support/Resistance Locator
Overview
The Institutional Support/Resistance Locator identifies high-probability demand and supply zones based on strong price rejection, large candle bodies, and elevated volume . These zones are commonly targeted or defended by institutional participants, helping traders anticipate potential reversal or continuation areas.
⸻
How It Works
The indicator uses a confluence of conditions to detect zones:
• Large Body Candles: Body size must exceed the moving average body size multiplied by a user-defined factor.
• High Volume: Volume must exceed the moving average volume by a configurable multiplier.
• Wick Rejection: Candles must show strong upper or lower wicks indicating aggressive rejection.
• If all criteria are met:
• Bullish candles form a Demand Zone.
• Bearish candles form a Supply Zone.
Each zone is plotted for a customizable number of future bars, representing areas where institutions may re-engage with the market.
⸻
Key Features
• ✅ Highlights institutional demand and supply areas dynamically
• ✅ Customizable sensitivity: body, volume, wick, padding, and zone extension
• ✅ Zones plotted as translucent regions with auto-expiry
• ✅ Works across all timeframes and markets
⸻
How to Use
• Trend Traders: Use demand zones for potential bounce entries in uptrends, and supply zones for pullback short entries in downtrends.
• Range Traders: Use zones as potential reversal points inside sideways market structures.
• Scalpers & Intraday Traders: Combine with volume or price action near zones for refined entries.
Always validate zone reactions with supporting indicators or price behavior.
⸻
Why This Combination?
The combination of wick rejection, volume confirmation, and large candle structure is designed to reflect footprints of smart money. Rather than relying on fixed pivots or subjective zones, this logic adapts to the current market context with statistically grounded conditions.
⸻
Why It’s Worth Using
This tool offers traders a structured way to interpret institutional activity on charts without relying on guesswork. By plotting potential high-impact areas, it helps improve reaction time.
⸻
Note :
• This script is open-source and non-commercial.
• No performance guarantees or unrealistic claims are made.
• It is intended for educational and analytical purposes only.

Volume Sentiment Pro (NTY88)Volume Sentiment Edge: Smart Volume & RSI Trading System
Description:
Unlock the power of volume-driven market psychology combined with precision RSI analysis! This professional-grade indicator identifies high-probability trading opportunities through:
🔥 Key Features
1. Smart Volume Spike Detection
Auto-detects abnormal volume activity with adaptive threshold
Clear spike labels & multi-timeframe confirmation
RSI-Powered Sentiment Analysis
Real-time Bullish/Bearish signals based on RSI extremes
Combined volume-RSI scoring system (Strong Bull/Bear alerts)
2. Professional Dashboard
Instant sentiment status table (bottom-right)
Color-coded momentum strength visualization
Customizable themes for all chart styles
3. Institutional-Grade Tools
HTF (Daily/Weekly) volume confirmation
EMA trend-filtered momentum signals
Spike-to-Threshold ratio monitoring
4. Trade-Ready Alerts
Pre-configured "Bullish Setup" (Spike + Oversold RSI)
"Bearish Setup" (Spike + Overbought RSI)
Why Traders Love This:
✅ Real-Time Visual Alerts - SPIKE markers above bars + table updates
✅ Adaptive Thresholds - Self-adjusting to market volatility
✅ Multi-Timeframe Verification - Avoid false signals with HTF confirmation
✅ Customizable UI - 10+ color settings for perfect chart integration
Usage Scenarios:
Day Traders: Catch volume surges during key sessions
Swing Traders: Confirm reversals with RSI extremes
All Markets: Works equally well on stocks, forex & crypto
Confirmation Tool: Combine with your existing strategy
Sample Setup:
"Enter long when:
5. RED SPIKE label appears
Table shows 'Oversold RSI'
Momentum status turns 'Bullish'
Volume exceeds daily average (Confirmed)"
📈 Try Risk-Free Today!
Perfect for traders who want:
Clean, non-repainting signals
Institutional-level volume analysis
Professional visual feedback
Customizable trading rules
⚠️ Important: Works best on 15m-4h timeframes. Combine with price action for maximum effectiveness.
📜 Legal Disclaimer
By using this indicator, you agree to the following terms:
Not Financial Advice
This tool provides technical analysis only. It does NOT constitute investment advice, financial guidance, or solicitation to trade.
High Risk Warning
Trading financial instruments carries substantial risk. Past performance ≠ future results. Never risk capital you cannot afford to lose.
No Guarantees
Signals are based on historical data and mathematical models. Market conditions may change rapidly, rendering previous patterns ineffective.
User Responsibility
You alone bear 100% responsibility for trading decisions. We expressly disclaim liability for any profit/loss resulting from this tool's use.
Professional Consultation
Always consult a licensed financial advisor before taking positions. This tool should NEVER be used as sole decision-making criteria.
Educational Purpose
This indicator is provided "as is" for informational/educational use only. No representation is made about its accuracy or completeness.
Third-Party Data
We do not verify exchange data accuracy. Use signals at your own discretion after independent verification.

Aggregated Open Interest [Alpha Extract]The Aggregated Open Interest indicator provides a comprehensive view of open interest across multiple cryptocurrency exchanges, allowing traders to monitor institutional positioning and market sentiment. By aggregating data from major exchanges like Binance, BitMEX, and Kraken, this indicator offers valuable insights into potential price movements and market shifts.
🔶 CALCULATION
The indicator processes open interest data through multiple analytical methods:
Exchange Aggregation: Collects and normalizes open interest data from multiple exchanges (Binance, BitMEX, Kraken) with proper currency normalization.
Multi-Mode Analysis: Calculates various metrics including raw open interest values, OI change, OI delta, volume-weighted delta, and OI RSI.
Divergence Detection: Uses pivot point analysis to identify divergences between price action and open interest movements.
Activity Assessment: Tracks bullish and bearish activity patterns by correlating open interest changes with price movements.
Formula:
Aggregate OI = Sum of normalized open interest from selected exchanges
OI Change = Current OI - Previous OI
OI Delta = Net change in open interest across timeframes
OI Delta × Volume = OI Delta weighted by relative volume
OI RSI = Relative Strength Index applied to open interest values
OI Heatmap = Multi-timeframe visualization of OI changes across 7 distinct periods
🔶 DETAILS
Visual Features:
Open Interest: Candlestick representation of aggregated open interest
OI Change: Histogram showing period-to-period changes
OI Delta: Histogram displaying net OI movements
OI Delta × Volume: Volume-weighted OI delta for enhanced signals
OI RSI: Oscillator showing overbought/oversold OI conditions
OI Heatmap: Multi-timeframe visualization showing OI changes across 7 periods (3, 5, 8, 13, 21, 34, and 55 days)
Divergence Detection: Color-coded markers (teal for bullish, red for bearish) highlighting significant divergences between price and open interest
Analysis Table: Real-time summary of key metrics including aggregate OI, recent changes, and bullish/bearish activity.
Interpretation:
Increasing Open Interest + Rising Price: Strong bullish trend confirmation
Increasing Open Interest + Falling Price: Strong bearish trend confirmation
Decreasing Open Interest + Rising Price: Weak bullish trend (potential reversal)
Decreasing Open Interest + Falling Price: Weak bearish trend (potential reversal)
Divergences: Signal potential trend exhaustion and reversals when price moves in one direction while open interest moves in the opposite direction
Heatmap: Provides at-a-glance insight into open interest trends across multiple timeframes, with green bars indicating rising OI and red bars indicating falling OI
🔶 EXAMPLES
Trend Confirmation: Rising open interest accompanying a price increase confirms strong bullish momentum with institutional backing.
Example: During January-February 2025, rising OI during price advances confirms institutional participation in the uptrend.
Bearish Divergence: Price makes a higher high while open interest makes a lower high, signaling potential trend reversal.
Example: Red markers appear at market tops where price continues higher but open interest fails to confirm, preceding significant corrections.
Bullish Divergence : Price makes a lower low while open interest makes a higher low, indicating potential bottoming.
Example: Teal markers appear at market bottoms where price continues lower but open interest fails to confirm, preceding significant rallies.
OI Heatmap Analysis : Multiple timeframes showing consistent red signals across short to long-term periods indicate strong institutional selling pressure.
Example: When all 7 periods (3-55 days) show red during a price uptrend, this signals institutional selling into retail strength, often preceding major corrections.
🔶 SETTINGS
Customization Options:
Data Sources: Toggle different exchanges (Binance USDT/USD/BUSD, BitMEX USD/USDT, Kraken USD)
Display Mode: Choose between Open Interest, OI Change, OI Delta, OI Delta × Volume, OI RSI, and OI Heatmap
Currency Units: Display in USD or base cryptocurrency (COIN)
Analysis Tools: Moving Average (length and color), RSI (length and color)
Divergence Detection: Enable/disable signals, adjust lookback period and threshold percentage, customize bullish/bearish divergence colors
OI Heatmap Colors: Customize bullish (green) and bearish (red) signal colors for the multi-timeframe heatmap visualization
The Aggregated Open Interest indicator provides traders with comprehensive insights into institutional positioning across major exchanges, helping identify potential trend continuations, reversals, and key market turning points driven by smart money movements. The addition of the OI Heatmap feature enables traders to quickly visualize open interest trends across multiple timeframes, providing valuable context for institutional positioning over different market cycles.

CYCLE BY RiotWolftradingDescription of the "CYCLE" Indicator
The "CYCLE" indicator is a custom Pine Script v5 script for TradingView that visualizes cyclic patterns in price action, dividing the trading day into specific sessions and 90-minute quarters (Q1-Q4). It is designed to identify and display market phases (Accumulation, Manipulation, Distribution, and Continuation/Reversal) along with key support and resistance levels within those sessions. Additionally, it allows customization of boxes, lines, labels, and colors to suit user preferences.
Main Features
Cycle Phases:
Accumulation (1900-0100): Represents the phase where large operators accumulate positions.
Manipulation (0100-0700): Identifies potential manipulative moves to mislead retail traders.
Distribution (0700-1300): The phase where large operators distribute their positions.
Continuation/Reversal (1300-1900): Indicates whether the price continues the trend or reverses.
90-Minute Quarters (Q1-Q4):
Divides each 6-hour cycle (360 minutes) into four 90-minute quarters (Q1: 00:00-01:30, Q2: 01:30-03:00, Q3: 03:00-04:30, Q4: 04:30-06:00 UTC).
Each quarter is displayed with a colored box (Q1: light purple, Q2: light blue, Q3: light gray, Q4: light pink) and labels (defaulted to black).
Support and Resistance Visualization:
Draws boxes or lines (based on settings) showing the high and low levels of each session.
Optionally displays accumulated volume at the highs and lows within the boxes.
Daily Lines and Last 3 Boxes:
How to Use the Indicator
Step 1: Add the Indicator to TradingView
Open TradingView and select the chart where you want to apply the indicator (e.g., UMG9OOR on a 5-minute timeframe, as shown in the screenshot).
Go to the Pine Editor (at the bottom of the TradingView interface).
Copy and paste the provided code.
Click Compile and then Add to Chart.
Step 2: Configure the Indicator
Click on the indicator name on the chart ("CYCLE") and select Settings (or double-click the name).
Adjust the options based on your needs:
Cycle Phases: Enable/disable phases (Accumulation, Manipulation, Distribution, Continuation/Reversal) and adjust their time slots if needed.
90-Minute Quarters: Enable/disable quarters (Q1-Q4).
Step 3: Interpret the Indicator
Identify Cycle Phases:
Observe the red boxes indicating the phases (Accumulation, Manipulation, etc.).
The high and low levels within each phase are potential support/resistance zones.
If volume is enabled, pay attention to the accumulated volume at highs and lows, as it may indicate the strength of those levels.
Use the 90-Minute Quarters (Q1-Q4):
The colored boxes (Q1-Q4) divide the day into 90-minute segments.
Each quarter shows the price range (high and low) during that period.
Use these boxes to identify price patterns within each quarter, such as breakouts or consolidations.
The labels (Q1, Q2, etc.) help you track time and anticipate potential moves in the next quarter.
Analyze Support and Resistance:
The high and low levels of each phase/quarter act as support and resistance.
Daily lines (if enabled) show key levels from the previous day, useful for planning entries/exits.
The "last 3 boxes below price" (if enabled) highlight potential support levels the price might target.
Avoid Manipulation:
During the Manipulation phase (0100-0700), be cautious of sharp moves or false breakouts.
Use the high/low levels of this phase to identify potential traps (as explained in your first question about manipulation candles).
Step 4: Trading Strategy
Entries and Exits:
Support/Resistance: Use the high/low levels of phases and quarters to set entry or exit points.
For example, if the price bounces off a Q1 support level, consider a buy.
Breakouts: If the price breaks a high/low of a quarter (e.g., Q2), wait for confirmation to enter in the direction of the breakout.
Volume: If accumulated volume is high near a key level, that level may be more significant.
Risk Management:
Place stop-loss orders below lows (for buys) or above highs (for sells) identified by the indicator.
Avoid trading during the Manipulation phase unless you have a specific strategy to handle false breakouts.
Time Context:
Use the quarters (Q1-Q4) to plan your trades based on time. For example, if Q3 is typically volatile in your market, prepare for larger moves between 03:00-04:30 UTC.
Step 5: Adjustments and Testing
Test on Different Timeframes: The indicator is set for a 5-minute timeframe (as in the screenshot), but you can test it on other timeframes (e.g., 1-minute, 15-minute) by adjusting the time slots if needed.
Adjust Colors and Styles: If the default colors are not visible on your chart, change them for better clarity.
---
📌 1. **Accumulation: Strong Institutional Activity**
- During the **accumulation phase, we see **high volume: 82.773K, which suggests strong buying interest**, likely from institutional players.
- This sets the base for the following upward move in price.
---
📌 2. **Manipulation: False Breakout with Lower Volume**
- Later, there's a manipulation phase where price breaks above previous highs, but the volume (71.814K) is **lower than during accumulation**.
- This implies that buyers are not as aggressive as before—no real demandbehind the breakout.
- It’s likely a bull trap, where smart money is selling into the breakout to exit their positions.
---
### 📌 3. Distribution: Weakness and Lack of Demand
- The market enters a distribution phase, and volume drops even further (only 7.914K).
- Price struggles to go higher, and you start seeing rejections at the top.
- This shows that demand is drying up, and smart money is offloading positions**—not accumulating anymore.
---
### 💡 Why Take the Short Here?
- Volume is not increasing with new highs—showing weak demand**.
- The manipulation volume is weaker than the accumulation volume, confirming the breakout was likely false.
- Structure starts to break down (Q levels falling), which confirms weakness.
- This creates a high-probability short setup:
- **Entry:** after confirmation of distribution and structural breakdown.
- **Stop loss:** above the manipulation high.
- **Target:** down toward previous lows or value zones.
---
### ✅ Conclusion
Since the manipulation volume failed to exceed the accumulation volume, the breakout lacked real strength. Combined with decreasing volume in the distribution phase, this indicates fading demand and supply taking control—which justifies entering a short position.

Volume Signal RSIVolume Signal RSI (VSR) Indicator
Overview:
The Volume Signal RSI (VSR) indicator combines traditional RSI analysis with statistically significant volume detection to identify potential reversal points and exhaustion signals in crypto markets. By applying statistical methods to volume analysis, VSR filters out normal market noise and highlights only the most meaningful volume spikes.
Key Features:
- Standard RSI overbought/oversold signals (70/30)
- Statistical volume significance detection using z-scores and p-values
- Exhaustion signals for potential market reversals
- Enhanced alert system with actionable trading context
How to Use This Indicator
Basic Signals:
- RSI Line: The blue line shows the standard RSI value (default period: 14)
- Overbought/Oversold Levels: Standard levels at 70/30 with additional extreme levels at 80/20
- Volume Detection: Small circles appear on the RSI line when statistically significant volume is detected
Trading Signals
1. Oversold Alert (🔴): When RSI crosses below 30
- Indicates potential support area
- Consider for long entries when price shows signs of stabilizing
2. Overbought Alert (🟢): When RSI crosses above 70
- Indicates potential resistance area
- Consider for short entries when price shows signs of topping
3. Bear Exhaustion Signal (⚠️): When bearish volume appears in oversold territory
- Indicates a potential selling climax
- Strong reversal signal when accompanied by positive price action
- Best used for counter-trend entries during downtrends
4. Bull Exhaustion Signal (⚠️): When bullish volume appears in overbought territory
- Indicates a potential buying climax
- Strong reversal signal when accompanied by negative price action
- Best used for counter-trend entries during uptrends
Alert Messages:
Alert messages contain critical information formatted for quick analysis:
- Symbol and timeframe
- Current price and RSI value with direction indicator
- Volume metrics: z-score, deviation percentage, and statistical confidence
- Trading context suggestion
Statistical Methodology:
- Z-Score: Measures how many standard deviations the current volume is from the mean
- P-Value: Statistical measure of significance (lower values = more significant)
- Confidence: Displayed as a percentage (higher = more confidence in the signal)
- Volume Deviation: Percentage above/below the average volume
Best Practices
1. Confirm signals with price action or other indicators
2. Higher timeframes typically produce more reliable signals
3. Use the statistical confidence percentage to gauge signal strength
4. Most powerful signals occur when exhaustion signals coincide with key support/resistance levels and there a quarter or more wick size at top of candle(buying exhaustion) or at bottom of candle (selling exhaustion)

WhispererRealtimeVolumeLibrary "WhispererRealtimeVolume"
▮ Overview
The Whisperer Realtime Volume Library is a lightweight and reusable Pine Script® library designed for real-time volume analysis.
It calculates up, down, and neutral volumes dynamically, making it an essential tool for traders who want to gain deeper insights into market activity.
This library is a simplified and modular version of the original "Realtime Volume Bars w Market Buy/Sell/Neutral split & Mkt Delta" indicator by the_MarketWhisperer , tailored for integration into custom scripts.
How bars are classified
- Up Bars
If the current bar’s closing price is higher than the previous bar’s closing price, it is classified as an up bar.
Volume handling:
The increase in volume for this bar is added to the up volume.
This represents buying pressure.
- Down Bars
If the current bar’s closing price is lower than the previous bar’s closing price, it is classified as a down bar.
Volume handling:
The increase in volume for this bar is added to the down volume.
This represents selling pressure.
- Neutral Bars
If the current bar’s closing price is the same as the previous bar’s closing price, it is classified as a neutral bar.
Volume handling:
If neutral volume is enabled, the volume is added to the neutral volume.
If neutral volume is not enabled, the volume is assigned to the same direction as the previous bar (up or down). If the previous direction is unknown, it is added to the neutral volume.
▮ What to look for
Real-Time Volume Calculation : Analyze up, down, and neutral volumes in real-time based on price movements and bar volume.
Customizable Start Line : Add a visual reference line to your chart for better context by viewing the starting point of real-time bars.
Ease of Integration : Designed as a library for seamless use in other Pine Script® indicators or strategies.
▮ How to use
Example code:
//@version=6
indicator("Volume Realtime from Whisperer")
import andre_007/WhispererRealtimeVolume/4 as MW
MW.displayStartLine(startLineColor = color.gray, startLineWidth = 1, startLineStyle = line.style_dashed,
displayStartLine = true, y1=volume, y2=volume + 10)
= MW.mw_upDownVolumeRealtime(true)
plot(volume, style=plot.style_columns, color=color.gray)
plot(volumeUp, style=plot.style_columns, color=color.green)
plot(volumeDown, style=plot.style_columns, color=color.red)
plot(volumeNeutral, style=plot.style_columns, color=color.purple)
▮ Credits
This library is inspired by the original work of the_MarketWhisperer , whose "Realtime Volume Bars" indicator served as the foundation.
Link to original indicator :

Stablecoin Supply Ratio [Alpha Extract]Stablecoin Supply Ratio Indicator
The Stablecoin Supply Ratio (SSR) indicator compares Bitcoin's market capitalization to the aggregate supply of major stablecoins, offering insights into relative purchasing power and liquidity. This tool helps traders:
✔ Assess Bitcoin's buying power relative to the available stablecoin liquidity.
✔ Detect periods of capital inflow or outflow from stablecoins.
✔ Identify market sentiment shifts based on stablecoin reserves.
🔶 CALCULATION
The indicator aggregates the supply of key stablecoins and compares it to Bitcoin's market cap:
Stablecoin Aggregation
• Inputs:
USDT, USDC, DAI, USDD (daily closing values).
BUSD Market Cap (Glassnode data).
• Total Stablecoin Supply:
Sum of the listed stablecoins' market caps.
Stablecoin Supply Ratio (SSR)
• Formula:
SSR = Bitcoin Market Cap / Total Stablecoin Supply
• Normalized SSR:
Normalized by dividing SSR by its 200-day SMA.
Bollinger Bands
• Bands are applied to the normalized SSR using a configurable moving average type and 2 standard deviations.
Example Calculation:
ssr = btcmc / stablecoin_liq
ratio = ssr / ta.sma(ssr, 200)
basis = ta.sma(ratio, 200)
dev = 2 * ta.stdev(ratio, 200)
upper = basis + dev
lower = basis - dev
🔶 DETAILS
Visual Features:
• Normalized SSR:
Plotted as a light green line.
• Upper Band:
Red line indicating SSR overbought zone.
• Lower Band:
Green line signaling SSR oversold zone.
Interpretation:
• High SSR: Indicates stablecoin reserves are low relative to Bitcoin's market cap, reducing stablecoin buying power.
• Low SSR: Suggests high stablecoin liquidity relative to Bitcoin's market cap, increasing potential buying pressure.
• Band Crosses: Movements beyond the upper or lower bands may signal sentiment extremes.
🔶 EXAMPLES
Market insights include:
• Capital Outflows: SSR rising into the upper band may reflect decreasing stablecoin reserves, potentially signaling a liquidity drain.
• Capital Inflows: SSR dropping near the lower band could indicate growing stablecoin reserves, potentially fueling Bitcoin demand.
🔶 SETTINGS
Customization Options:
• MA Type: Choose between SMA, EMA, WMA, SMMA, and VWMA for band calculation.
• Period: Adjust the 200-day smoothing period.
• Deviation Multiplier: Modify the standard deviation multiplier (default: 2).
The Stablecoin Supply Ratio indicator is a valuable tool for traders monitoring liquidity dynamics and stablecoin trends to anticipate Bitcoin market moves and capital flows.

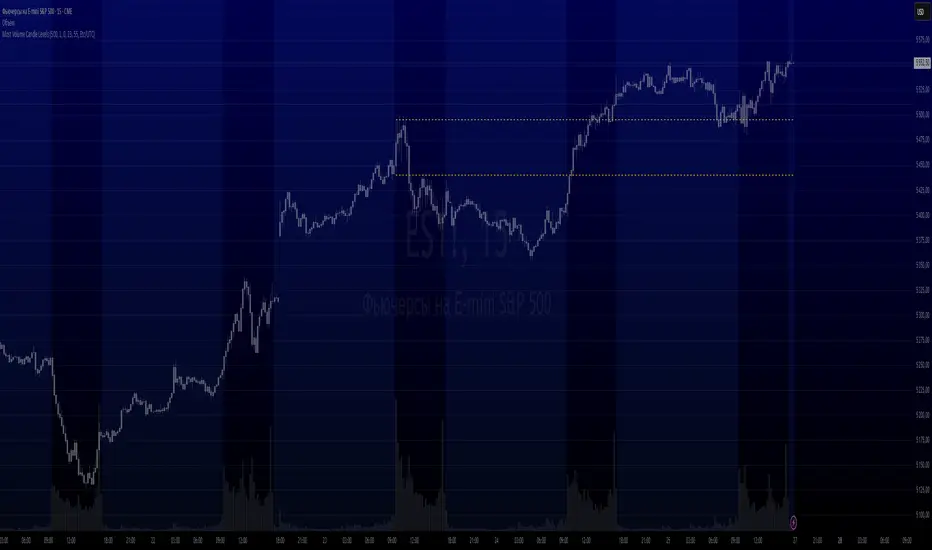
Most Volume Candle LevelsThe script finds the candlestick with the maximum volume in the specified period (20 bars by default).
Draws levels on high and low of this candlestick.
You can set the color of the lines (yellow by default).
Smart Market Matrix Smart Market Matrix
This indicator is designed for intraday, scalping, providing automated detection of price pivots, liquidity traps, and breakout confirmations, along with a context dashboard featuring volatility, trend, and volume.
## Summary Description
### Menu Settings & Their Roles
- **Swing Pivot Strength**: Controls the sensitivity for detecting High/Low pivots.
- **Show Pivot Points**: Toggles the display of HH/LL markers on the chart.
- **VWMA Length for Trap Volume** & **Volume Spike Multiplier**: Identify concentrated volume spikes for liquidity traps.
- **Wick Ratio Threshold** & **Max Body Size Ratio**: Detect candles with disproportionate wicks and small bodies (doji-ish) for traps.
- **ATR Length for Trap**: Measures volatility specific to trap detection.
- **VWMA Length for Breakout Volume**, **ATR Multiplier for Breakout**, **ATR Length for Breakout**, **Min Body/Range Ratio**: Set adaptive breakout thresholds based on volatility and volume.
- **OBV Smooth Length**: Smooths OBV momentum for breakout confirmation.
- **Enable VWAP Filter for Confirmations**: Optionally validate breakouts against the VWAP.
- **Enable Higher-TF Trend Filter** & **Trend Filter Timeframe**: Align breakout signals with the 1h/4h/Daily trend.
- **ADX Length**, **EMA Fast/Slow Length for Context**: Parameters for the context dashboard (Volatility, Trend, Volume).
- **Show Intraday VWAP Line**, **VWAP Line Color/Width**: Display the intraday VWAP line with custom style.
### Signal Interpretation Map
| Signal | Description | Recommended Action |
|--------------------------------|-----------------------------------------------------------|-------------------------------------------|
| 📌 **HH / LL (pivot)** | Market structure (support/resistance) | Note key levels |
| **Bull Trap(green diamond)** | Sweep down + volume spike + wick + rejection | Go long with trend filter
| **Bear Trap(red diamond)** | Sweep up + volume spike + wick + rejection | Go short with trend filter
| 🔵⬆️ **Breakout Confirmed Up** | Close > ATR‑scaled high + volume + OBV↑ | Go long with trend filter |
| 🔵⬇️ **Breakout Confirmed Down** | Close < ATR‑scaled low + volume + OBV↓ | Go short with trend filter |
| 📊 **VWAP Line** | Intraday reference to guide price | Use as dynamic support/resistance |
| ⚡ **Volatility** | ATR ratio High/Med/Low | Adjust position size |
| 📈 **Trend Context** | ADX+EMA Strong/Moderate/Weak | Confirm trend direction |
| 🔍 **Volume Context** | Breakout / Rising / Falling / Calm | Check volume momentum |
*This summary gives you a quick overview of the key settings and how to interpret signals for efficient intraday scalping.*
### Suggested Settings
- **Intraday Scalping (5m–15m)**
- `Swing Pivot Strength = 5`
- `VWMA Length for Trap Volume = 10`, `Volume Spike Multiplier = 1.6`
- `ATR Length for Trap = 7`
- `VWMA Length for Breakout Volume = 12`, `ATR Length for Breakout = 9`, `ATR Multiplier for Breakout = 0.5`
- `Min Body/Range Ratio for Breakout = 0.5`, `OBV Smooth Length = 7`
- `Enable Higher-TF Trend Filter = true` (TF = 60)
- `Show Intraday VWAP Line = true` (Color = orange, Width = 2)
- **Swing Trading (4h–Daily)**
- `Swing Pivot Strength = 10`
- `VWMA Length for Trap Volume = 20`, `Volume Spike Multiplier = 2.0`
- `ATR Length for Trap = 14`
- `VWMA Length for Breakout Volume = 30`, `ATR Length for Breakout = 14`, `ATR Multiplier for Breakout = 0.8`
- `Min Body/Range Ratio for Breakout = 0.7`, `OBV Smooth Length = 14`
- `Enable Higher-TF Trend Filter = true` (TF = D)
- `Show Intraday VWAP Line = false`
*Adjust these values based on the symbol and market volatility for optimal performance.*

Vacuum Candles [XrayAlgo]The Vacuum Candles indicator helps traders identify inefficient price movements—where the price moves significantly but lacks sufficient volume to support it. These inefficiencies may signal weak trends, potential reversals, or false breakouts/breakdowns.
Inefficient candles are visually marked with a darker / black body to indicate when the price movement is disproportionate to the volume.
1. Spotting Potential Reversals
When the indicator marks an inefficient candle, it signals that the price movement may be unsustainable.
In an uptrend: A inefficient bullish candle suggests that the uptrend is losing momentum, potentially leading to a downward reversal.
In a downtrend: A inefficient bearish candle signals that the downtrend may be weakening, with a potential bullish reversal.
2. Identifying Breakout and Breakdown Failures
This indicator is useful for recognizing false breakouts or false breakdowns.
If price breaks resistance but the candle is inefficient, the breakout may be weak and could fail quickly.
If price breaks support with an inefficient bearish candle, the breakdown could be a false signal, with price reverting back above support.
3. Recognizing Weak Trends
Inefficient candles help you spot when a trend is losing strength and could soon reverse or consolidate.
In an uptrend: A series of dark body bullish candles suggests that the uptrend may be weakening, signaling a potential correction or trend reversal.
In a downtrend: A series of dark body bearish candles suggests that the selling pressure is weakening, indicating a potential bullish reversal.
4. Fine-Tuning Entries and Exits
Inefficient candles offer an opportunity to fine-tune your entries and exits based on weak price moves.
Entering a trade: An inefficient candle near key support or resistance can indicate a reversal, making it a good entry point for a counter-trend position.
Exiting a trade: If you're already in a trend, and an inefficient candle appears, it suggests the trend is losing strength, indicating it may be a good time to exit before a potential reversal.
5. Fine-Tuning with Inputs
The Vacuum Candles indicator includes two key inputs:
Length: The number of candles used to calculate the average price movement and volume. A longer length (e.g., 20-30) smooths out the inefficiencies, while a shorter length (e.g., 10-15) makes the indicator more sensitive to recent price moves.
Multiplier: Controls the threshold for what is considered an inefficient candle:
A higher Multiplier (e.g., 1.5–3) filters out smaller inefficiencies and focuses on large discrepancies.
A lower Multiplier (e.g., 0.1–0.9) captures even smaller inefficiencies in highly efficient markets.

30-Day Rolling VWAP30-Day Rolling VWAP (30-RVWAP)
Overview:
The 30-Day Rolling VWAP is an advanced technical analysis tool designed for crypto traders that combines Volume Weighted Average Price over a 30-day rolling window with sophisticated volume analysis to generate high-probability trading signals.
Key Features:
1. Dynamic Color-Coded VWAP Line
Green glow = Strong bullish pressure
Red glow = Strong bearish pressure
Gray = Neutral/balanced market
The line changes color based on volume-weighted directional pressure
2. Volume Pressure Zones
Multi-layered glowing fill effect around VWAP
Expands/contracts based on volatility and volume
Shows potential support/resistance zones
3. Smart Alert System
Buy/Sell alerts based on VWAP color change
Cross above/below VWAP alerts
Confidence levels based on pressure strength
How to Use:
1. Color Signals
When VWAP turns green: Consider buying (bullish pressure)
When VWAP turns red: Consider selling (bearish pressure)
Gray color indicates consolidation/neutral market
2. Alert Structure
Buy/Sell alerts include confidence percentage (0-100%)
Higher confidence = stronger directional pressure
Cross alerts notify when price crosses VWAP with distance
3. Volume Pressure Zones
Wider zones = higher volatility/volume
Use zones as dynamic support/resistance levels
Watch for price reactions at zone boundaries
4. Trading Strategy
Enter long when VWAP turns green with high confidence (60%+)
Enter short when VWAP turns red with high confidence
Use VWAP as trailing stop (exit when cross alerts trigger)
Use pressure zones for profit targets
5. Alert Messages
Buy Signal: "BTCUSDT | 15m | BUY Signal | Price: 42380.00 | VWAP: 42350.00 | Distance: 0.07% | Confidence: 78% due to strong bullish pressure"
Cross Alert: "BTCUSDT | 15m | CROSS ABOVE VWAP | Price: 42360.00 | VWAP: 42350.00 | Distance: 0.02%"
Best Practices:
Use higher timeframes (4H+) for trend direction; preferably **daily timeframe**
Combine with other indicators for confirmation
Monitor volume for signal validation
Consider market context when entering trades
The indicator combines multiple volume metrics to filter out false signals and provides clear visual and alert-based trading signals.

Impulse Volume Oscillator [Alpha Extract]Impulse Volume Oscillator
A sophisticated indicator designed to identify market impulse moves and volume-based momentum shifts, helping traders capture significant price movements with precision.
Combining price deviations with volume analysis, this oscillator dynamically measures market strength and weakness, providing clear signals for potential trend continuations and reversals.
🔶 Volume-Adjusted Normalization
Utilizes a unique normalization technique that incorporates volume impact to enhance signal quality. This approach ensures the indicator responds more strongly to high-volume price movements while filtering out low-volume noise.
vol_ratio = ta.rsi(volume, 14) / 50
vol_factor = vol_impact > 0 ? 1 + (vol_ratio - 1) * vol_impact : 1
raw_normalized = dev / (ta.stdev(source, bars) * mult)
vol_adjusted = raw_normalized * vol_factor
normalized = ta.sma(vol_adjusted, smooth)
🔶 Adaptive Regime Detection
Incorporates threshold-based regime identification that clearly distinguishes between trending and mean-reverting market conditions. The customizable threshold system allows traders to adapt to different market volatilities and timeframes.
🔶 Customizable Parameters
Fine-tune detection sensitivity with adjustable inputs for lookback period, standard deviation multiplier, volume impact, and signal smoothing. These parameters enable traders to optimize the indicator for various trading styles and market conditions.
❓How It Works
🔶 Impulse Calculation
The oscillator measures price deviation from a moving average baseline, normalized by standard deviation, and then adjusts the signal based on relative volume strength. This creates a responsive yet stable indicator that accurately reflects market momentum.
// Calculate the basis using the selected MA
basis = get_ma(source, bars)
// Calculate the normalized value with volume impact
dev = source - basis
🔶 Dynamic Visualization
The histogram changes color based on signal strength, providing instant visual cues about market conditions. Green bars indicate positive momentum while red bars represent negative momentum, with color intensity reflecting signal strength.
🔶 Trend Confirmation
Built-in trend direction analysis provides confluence with the primary signal, helping traders distinguish between counter-trend bounces and genuine trend reversals. This dual-confirmation approach significantly reduces false signals.
🔶 Visual Alerts & Boundary Tracking
Monitors signal extremes and dynamically adjusts visualization transparency based on signal strength. The indicator highlights particularly strong impulse moves with background shading, making potential trading opportunities immediately apparent.
🔶 Custom Candle Coloring
Optional candle coloring applies the same color logic as the histogram directly to price candles, providing a unified visual framework that helps traders correlate indicator signals with price action.
🔶 Momentum Shift Detection
Automatically identifies important zero-line crossovers that often signify the beginning of new impulse moves. These transition points frequently offer favorable risk/reward entry opportunities.
🔶 Snapshot samples
1 Week
1 Day
15 Min
🔶 Why Choose AE - Impulse Volume Oscillator?
This indicator provides a comprehensive approach to identifying significant market moves by combining volume analysis with price momentum. By offering clear visual signals for both trend continuation and reversal scenarios, it empowers traders to make more informed decisions across various market conditions and timeframes.

Volume NodesVolume Nodes Indicator:
What This Indicator Does:
The Volume Nodes indicator identifies and visualizes statistically significant volume events on your chart, helping you identify important price levels where substantial trading activity has occurred. Unlike standard volume indicators, Volume Nodes:
Uses statistical analysis (z-scores) to identify truly abnormal volume bars
Calculates accurate buy/sell volume ratios by analyzing all lower timeframe data
Identifies the Volume Point of Control (VPOC) for high volume areas
Visualizes significant volume ranges as they extend across the chart
Tracks when price interacts with these important levels
Key Features:
High Volume Detection: Highlights bars with unusually high volume (z-score above threshold)
Low Volume Detection: Highlights bars with unusually low volume (z-score below threshold)
VPOC Lines: Horizontal lines showing the exact price level with maximum volume concentration
Volume Range Fills: Shaded areas showing the entire price range with significant volume
Accurate Volume Metrics: Shows true buy/sell volume ratios or delta percentages derived from lower timeframe data
How to Use It in Your Trading: **Move to front in the visual order on chart**
Step 1: Identify Important Volume Zones
High Volume Bars (green/red candles) indicate where significant buying or selling has occurred
VPOC Lines extending from these bars show you the exact price level with highest volume
Range Fills show you the entire zone where significant volume occurred
Step 2: Use These Levels for Trading Decisions
Support/Resistance: VPOC lines often act as support or resistance levels
Breakout Validation: Breakouts on high volume are more likely to be valid
Low Volume Warning: Low volume bars (yellow) often indicate indecision or potential reversals
Trading with Volume Flow: Use the buy/sell ratio or delta % to confirm the strength and direction of moves
Step 3: Monitor Price Interaction with Volume Zones
When price approaches a VPOC line, watch for reaction (bounce or breakout)
When price enters a volume range area, increased volatility often follows
When price crosses a VPOC line, the line changes transparency indicating it's been tested
Tips for Optimal Use
Higher Timeframes: The indicator works exceptionally well on higher timeframes (4H, daily, weekly) where volume patterns are more significant
Range Trading: Use volume nodes to identify the boundaries of trading ranges
Combine with Price Action: Look for price action confirmation (rejections, engulfing patterns) at VPOC levels
Multiple Timeframe Analysis: Compare volume nodes across different timeframes to find confluent levels
Alert Setup: Set up alerts for when price enters important volume zones or crosses VPOC lines
Reversal Signals: High volume bars with significant wicks often signal exhaustion points where smart money is transferring positions. Bullish candles with long upper wicks suggest sellers absorbing buying pressure at highs, while bearish candles with long lower wicks indicate buyers stepping in at lows - both potentially signaling momentum shifts that precede reversals.
The indicator is particularly valuable for identifying levels where large players have been active in the market and are likely to defend or act again in the future.

Market Session Boxes with Volume Delta [algo_aakash]This script highlights four key forex trading sessions — Tokyo, London, New York, and Sydney — by drawing color-coded boxes directly on the chart. For each session, it shows:
High and low of the session
Total volume traded
Volume delta (bullish vs bearish pressure)
Optional extension of session highs/lows into future candles
Cleanly labeled time range and stats
Users can:
Select which sessions to display
Customize session times (in UTC+0)
Choose colors per session
Toggle session labels and extension lines
Use Case: Designed to help intraday and short-term traders visualize market rhythm, liquidity zones, and session-based volatility. The volume delta metric adds an extra layer of sentiment analysis.
This tool works best on intraday timeframes like 15m, 30m, or 1H.
Disclaimer:
This indicator is for educational and visual analysis purposes. It does not constitute trading advice or guarantee results. Always conduct your own analysis before making trading decisions.

MissedPrice[KiomarsRakei]█ Overview:
The MissedPrice script identifies price zones based on significant Open Interest shifts (including gaps) aligned with price movements. When sudden market positioning changes occur, the script pinpoints target zones where price is believed to return. Each signal directs you toward these opportunity zones with supporting metrics like Notional Value, Volume Ratio, and Funding Rate timing to help qualify the signals.
█ Core Concept:
Markets frequently "miss" critical price levels during rapid movements. These missed zones occur when:
Orders are revoked during sudden price shifts
Exchanges fail to execute at intended prices
TP/SL orders miss exact execution points
Institutional orders create supply/demand imbalances
Market structure shifts bypass key levels
Liquidity voids form from positioning changes
These missed price zones create natural targets that price tends to revisit. The MissedPrice indicator identifies these zones by analyzing the relationship between Open Interest, Price, and Volume.
█ Closer look at target zones:
Target zones are calculated using the open price where significant OI shifts occur, with zone width adjusted based on the High-Low ratio and ATR to adapt to current volatility. If a zone is touched once after a signal is generated, it is no longer valid. This can be understood as the missing positions and volume having now entered the market.
Each zone's Notional Value (NV) - calculated as OI change multiplied by price - measures the financial impact of the positioning shift. Higher NV indicates more significant market activity and greater liquidity, making price more likely to return to that area. Users can adjust NV ratio thresholds in the inputs to filter signal quality.
█ Features:
Statistical Dashboard: Real-time statistics table showing performance metrics for signals
Funding Rate Visualization: Vertical lines indicate funding rate times to help correlate signals with these significant market events
Alert Capability: Set up alerts for new signals to never miss a trading opportunity
Dynamic Entry Lines: Draws adjustable entry and target level lines to facilitate precise trade execution and measurement, customizable via inputs
█ Closer Look at Statistics Table:
Signal Count: Total numbers of signals generated and total candles included (limited by TradingView's OI historical data)
Win Rate: can be interpreted as the hit rate of target zones. Whenever price reaches the zone, it is calculated as a win, regardless of how far price may have moved in the opposite direction beforehand. This metric measures the script's accuracy in identifying price zones that eventually get revisited.
Total Profit: Calculates possible profit from first entry to target of hit signals - an estimate since humans can't take all signals and might have better entries or average down. By default is turned off can be turned on in the input menu.
Bad Signals: Signals taking too long to complete or moving much further from target
Bad but Hit: Bad signals that eventually hit the target despite early challenges
As you can see in the chart, there are zones that price does not return to touch. There is no guarantee that every identified zone will be reached, which is why the script provides additional qualification metrics to help assess signal probability.
Due to limitations of Open Interest data, you can only use this script on crypto pairs that have Open Interest data available on TradingView. While the script works on any timeframe, it performs best on timeframes less than daily.
█ Best Practices:
Use it in bar replay mode to master the strategy
Try different risk management systems based on how far price goes from the target and your creativity
Use the volume ratio and funding time data to further qualify signals
Notional Value plays a key role

Volume Range Map [BigBeluga]This volume-based tool identifies the highest and lowest price extremes within a lookback period and constructs two dynamic range zones. Each zone is filled with horizontal volume profiles that visualize the distribution of traded volume across price bins, helping traders pinpoint key areas of accumulation and distribution.
🔵Key Features:
Dynamic High/Low Zones:
➣ Automatically detects the highest and lowest price levels within a custom lookback window.
➣ Draws two shaded zones: one near the high and one near the low, representing potential supply and demand areas.
Volume Profiles per Zone:
➣ Each zone is filled with a volume profile histogram divided into bins.
➣ The length of each horizontal bar represents the relative volume traded at that price level.
➣ Bins collectively account for 100% of the zone’s volume.
POC Highlighting:
➣ The price bin with the highest volume is marked as the Point of Control (POC), along with a label showing its share of total volume in percentage.
➣ A dashed line is drawn at the middle level of the zone.
Customizable Display:
➣ Traders can adjust the number of bins, zone width, and toggle midline visibility to match their strategy needs.
➣ Colors of upper and lower volume zones are fully customizable.
🔵Usage:
Supply/Demand Analysis: Use upper/lower volume zones to find key reversal or continuation areas where market participants were most active.
Volume Confirmation: Confirm breakout or rejection trades by watching how price reacts to high-volume areas inside each zone.
POC Strategy: Treat POC levels as magnet zones — price tends to revisit them due to high liquidity.
Trade Planning: Use volume-weighted levels instead of raw price action to plan entries, stop-losses, and targets.
Volume Range Map offers a clean and powerful way to analyze volume distribution at price extremes. By combining precise volume histograms, POC highlights, and adaptive zone drawing, it brings market structure into sharper focus for range and breakout traders alike.

Volume Profile + Price Action Strategy (POC-based)This indicator combines volume dynamics, price action patterns, and a simplified Point of Control (POC) to highlight potential high-probability trade zones.
🔍 Key Features
POC-Based Logic
Plots the POC from the most recent closed 10-minute candle as a horizontal level for intraday structure.
Volume Spike Detection
Highlights unusual activity based on volume compared to the average of the last N candles.
Effort vs. Result Analysis
Based on Wyckoff-inspired logic:
Absorption: Large volume, small body → possible buyer/seller absorption
False Move: Small volume, large body → potential fakeout
Price Action Recognition Detects:
Inside Bars
Pin Bars
Engulfing Candles
Signal Highlights
🔺 Absorption Signals (below bar, teal triangle)
🔻 False Move Signals (above bar, orange triangle)
🔷 POC Line
⚙️ Customizable Inputs
You can control signal sensitivity with these inputs:
Volume Spike Multiplier
Raise to filter only extreme volume spikes
→ Recommended: 2.0 to 3.0 for cleaner setups
Absorption Body Ratio
Lower to detect only very small bodies (tight candles)
→ Try 0.3 to 0.4 for stricter absorption logic
False Move Body Ratio
Raise to catch only large candles on low volume
→ Use 2.0+ to filter weak moves
🧠 How to Use
Use in confluence with:
Support/Resistance
VWAP or moving averages
Session opens/closes
Best on 10-minute charts, but adjustable
✅ Signal Tuning Tips
Want fewer but cleaner signals?
Increase Volume Spike Multiplier: 2.5+
Decrease Absorption Body Ratio: 0.3
Increase False Move Ratio: 2.0+
Want more frequent signals?
Lower Volume Multiplier: 1.2–1.5
Raise Absorption Ratio: 0.6+
Lower False Move Ratio: 1.2–1.4
📊 Recommended Timeframe
Optimized for 10-minute charts
Works intraday, especially around session opens and POC re-tests
⚠️ Disclaimer
This script is for educational and informational purposes only. It does not constitute financial advice or a recommendation to buy or sell any asset. Past performance is not indicative of future results. Always do your own research and consult a licensed financial advisor before making trading decisions.
Use at your own risk.

Volume-RSI Colored Bars
The Volume Indicator, used in conjunction with the embedded Relative Strength Index (RSI), is a powerful tool for making informed trading decisions. Let’s break down how this indicator works and how it can assist you in your trading strategy.
Volume Indicator:
The Volume Indicator tracks the volume of trades occurring in a specific timeframe. Volume shows the number of shares or contracts traded, which can reveal the strength of a price move. If price is moving higher with increasing volume, it generally confirms that the move has more strength, indicating the potential for continuation. Conversely, if the price is moving lower with increasing volume, it indicates strong bearish momentum.
Volume Clusters:
In the chart, we can see various volume clusters highlighted in green, red, and grey. The green bars represent high volume, which can signal strong buying pressure. The red bars represent low volume, signaling that selling pressure is low. Grey bars indicate average volume.
High Volume (Green Bars): High buying pressure, indicating that there may be a strong move in the direction of the price.
Low Volume (Red Bars): Potential signal for a weak move, indicating a lack of participation in the current trend.
RSI (Relative Strength Index):
RSI is a momentum oscillator that indicates whether a market is overbought or oversold. The RSI ranges from 0 to 100, with readings above 70 suggesting an overbought market and readings below 30 suggesting an oversold market.
The RSI is also embedded in the indicator to give a better context when combined with volume. It adds an extra layer of analysis to interpret the price action.
How to Use Volume Indicator with RSI:
Confirming Breakouts:
If you see a breakout in price (an upward movement or downward movement) and the volume indicator shows high volume, this confirms the strength of the breakout.
If the RSI also supports the breakout (for example, it is crossing above 50 or above 70 for an uptrend), it further validates the trade.
Identifying Reversals:
When the price is reaching overbought or oversold levels (RSI above 70 or below 30) and there is low volume (red bars), this may indicate a potential reversal.
If the price is oversold and RSI shows values below 30 with increasing volume (green bars), this could signal a potential buying opportunity as a reversal might occur.
Volume Divergence:
If the price is making new highs, but the volume is declining (red bars), it may signal weakness in the trend, despite the RSI indicating strength. This divergence can help traders anticipate a potential reversal or breakout.
Example from the Chart:
Strong Buy Signal: The price is making an upward movement, the volume bars are turning green (indicating strong buying pressure), and RSI is rising above 50.
Bearish Divergence: You may see RSI moving higher, but volume bars are turning red (indicating weak momentum). This could signal that the upward movement lacks strength, suggesting a potential reversal.
By combining these two indicators, the Volume Indicator and the RSI, traders can make more informed decisions on whether the current trend is sustainable, or if a reversal or breakout is likely.
In conclusion, using the Volume Indicator and RSI together allows for:
Identifying high-volume breakouts and reversals
Filtering out weak price movements
Confirming trends with volume and momentum
This combination enhances trading strategies by providing clear signals of market strength or weakness, helping traders optimize their entry and exit points effectively.

MACD Volume Strategy (BBO + MACD State, Reversal Type)Overview
MACD Volume Strategy (BBO + MACD State, Reversal Type) is a momentum-based reversal system that combines MACD crossover logic with volume filtering to enhance signal accuracy and minimize noise. It aims to identify structural trend shifts and manage risk using predefined parameters.
※This strategy is for educational and research purposes only. All results are based on historical simulations and do not guarantee future performance.
Strategy Objectives
Identify early trend transitions with high probability
Filter entries using volume dynamics to validate momentum
Maintain continuous exposure using a reversal-style model
Apply a consistent 1:1.5 risk-to-reward ratio per trade
Key Features
Integrated MACD and volume oscillator filtering
Zero repainting (all signals confirmed on closed candles)
Automatic position flipping for seamless direction shifts
Stop-loss and take-profit based on recent structural highs/lows
Trading Rules
Long Entry Conditions
MACD crosses above the zero line (BBO Buy arrow)
Volume oscillator is positive (short EMA > long EMA)
MACD is above the signal line
Close any existing short and enter a new long
Short Entry Conditions
MACD crosses below the zero line (BBO Sell arrow)
Volume oscillator is positive
MACD is below the signal line
Close any existing long and enter a new short
Exit Rules
Take Profit (TP) = Entry ± (risk distance × 1.5)
Stop Loss (SL) = Recent swing low (for long) or high (for short)
Early Exit = Triggered when a reversal signal appears (flip logic)
Risk Management Parameters
Pair: ETH/USD
Timeframe: 10-minute
Starting Capital: $3,000
Commission: 0.02%
Slippage: 2 pip
Risk per Trade: 5% of account equity (adjusted for sustainable practice)
Total Trades: 312 (backtest on selected dataset)
※Risk parameters are fully configurable and should be adjusted to suit each trader's personal setup and broker conditions.
Parameters & Configurations
Volume Short Length: 6
Volume Long Length: 12
MACD Fast Length: 11
MACD Slow Length: 21
Signal Smoothing: 10
Oscillator MA Type: SMA
Signal Line MA Type: SMA
Visual Support
Green arrow = Long entry
Red arrow = Short entry
MACD lines, signal line, and histogram
SL/TP markers plotted directly on the chart
Strategic Advantages & Uniqueness
Volume filtering eliminates low-participation, weak signals
Structurally aligned SL/TP based on recent market pivots
No repainting — decisions are made only on closed candles
Always in the market due to the reversal-style framework
Inspirations & Attribution
This strategy is inspired by the excellent work of:
Bitcoinblockchainonline – “BBO_Roxana_Signals MACD + vol”
Leveraging MACD zero-line cross and volume oscillator for intuitive signal generation.
HasanRifat – “MACD Fake Filter ”
Introduced a signal filter using MACD wave height averaging to reduce false positives.
This strategy builds upon those ideas to create a more automated, risk-aware, and technically adaptive system.
Summary
MACD Volume Strategy is a clean, logic-first automated trading system built for precision-seeking traders. It avoids discretionary bias and provides consistent signal logic under backtested historical conditions.
100% mechanical — no discretionary input required
Designed for high-confidence entries
Can be extended with filters, alerts, or trailing stops
※Strategy performance depends on market context. Past performance is not indicative of future results. Use with proper risk management and careful configuration.

FunkyQuokka's $ Volume💡 Why $ Volume Matters
Share volume alone is a half-truth — 1M shares traded at $5 isn’t the same as 1M shares at $500. That’s where dollar volume steps in, offering a far more accurate view of institutional interest, breakout validity, liquidity zones and overall trader conviction.
📈 Features:
Clean histogram of dollar volume (close × volume)
Orange line showing customizable average $ volume
K/M/B formatting for axis scale (no huge ugly numbers)
Minimal design to blend into a multi-pane layout
⚙️ Inputs:
Tweakable average length – defaults to 20
By FunkyQuokka 🦘
