Advanced Custom Volume Profile [KRUTO]⚠️ LANGUAGE NOTICE: This script features a SLOVAK (SK) user interface (settings and tooltips).
This is a highly customizable and versatile Volume Profile indicator designed for precise market analysis. It separates itself from standard tools by offering dynamic anchoring modes, advanced HVN/LVN detection logic, and a "Smart Lines" feature that keeps your chart clean.
Key Features
1. Three Dynamic Anchoring Modes:
Fixed Range (Na čiare výberu): Define exact Start and End times manually. Includes vertical dashed lines to visualize the range.
Anchor to Last Candle (Na poslednej sviečke): Calculates volume from a specific start time up to the current live price. The profile is always anchored to the most recent bar.
Visible Range (Visible - Viditeľné sviečky): Dynamically calculates the profile based only on the candles currently visible on your screen. As you scroll or zoom, the profile updates automatically.
2. HVN & LVN Detection:
HVN (High Volume Nodes): Automatically highlights areas of high consolidation (Green zones). Includes a "merge tolerance" setting to group nearby nodes.
LVN (Low Volume Nodes): Highlights areas of low liquidity/rejection (Red zones).
3. Key Levels & Visuals:
Displays POC (Point of Control), VAH (Value Area High), and VAL (Value Area Low) with extendable lines.
Smart Offset: Keeps the profile at a fixed distance from the latest candle (or right edge) to prevent chart clutter.
Clean Look: Vertical range lines automatically disappear when not in "Fixed Range" mode.
Translation Guide (Slovak -> English)
Since the settings are in Slovak, here is a quick guide for English users:
Zdroj dát profilu (Source):
Na čiare výberu = Fixed Time Range
Na poslednej sviečke = Fixed Start to Current Bar
Visible = Visible Range
Počet úrovní (Bins): Resolution of the histogram (e.g., 160).
Value Area (%): Percentage of volume considered as value (Standard 70%).
Začiatočný / Koncový čas: Start / End Time.
Offset: Distance of the profile from the price action.
Zobraziť HVN / LVN: Show High/Low Volume Nodes.
Credits: Custom logic developed for advanced volume analysis with anti-overlap algorithms for node visualization.
Enjoy the script! 🚀
成交量分佈圖

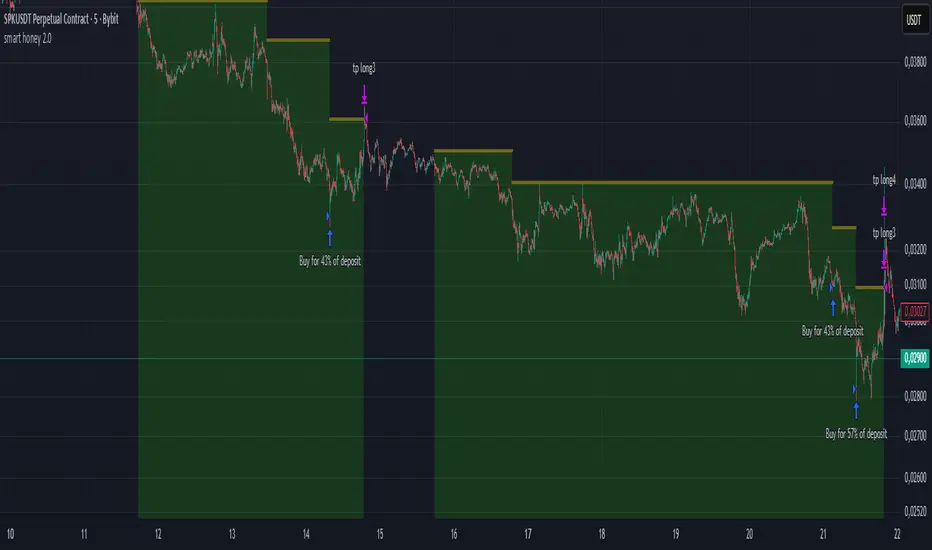
smart honey 2.0The smart honey 2.0 is a long-only trading strategy based on averaging entries.
At "Entry" you can set to enter a trade at a specified averaging level. The best backtest result at "only 4th averaging".
"Tp" is take profit.
"Sensitivity" controls the frequency of trades - lower sensitivity means fewer, but higher-quality trades.
Settings recommendations
For 1m-5m timeframes, use low sensitivity and take profit values. For higher timeframes, increase the take profit value.
For example, a profitable setting for many coins on a 5-minute timeframe is
Tp = 1.5%
Sensitivity = 2.7
Entry = only 4th averaging
The strategy features a "Blue line" showing liquidity clusters influenced by Sensitivity. Price often bounces off this line.
You can also set alerts for lists of coins, receiving notifications at each new candle about active positions
Support & Resitance LinesIntroduction:
Support & Resistance levels are time consuming to mark on charts. They also must be maintained. If the user has multiple charts they analyze, this adds to the workload. This indicator attempts to automate that work flow for the user.
Description:
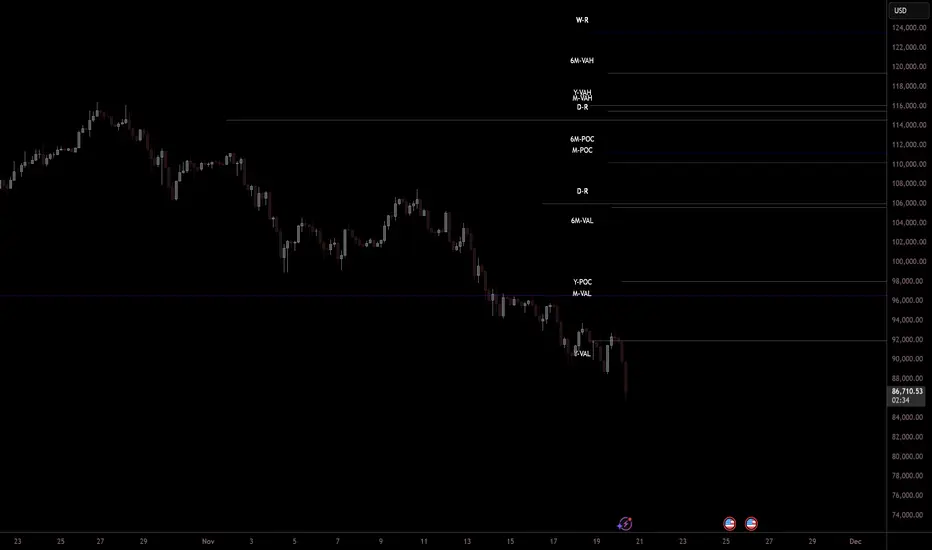
Psychological Support and Resistances
are marked with a horizontal ray and labeled.
Levels marked include the 1 Month, 1 Week, and the Daily.
If a candle closes on the marked levels, the horizontal ray marking that level will disappear.
Volume Based Support and Resistances [/i
With the fixed range volume profile tool, marked levels include the point of control(POC) and the Value Areas (VA). This includes both the Value Area Low (VAL) and the Value Area High (VAH). Levels marked include the 1 Year, 6 Month, and the 1 Month fixed range volume profile.
If a candle closes on the marked levels, the horizontal ray marking that level will disappear.
How to use:
1) Turn on indicator and make sure you are on the 1D time frame.
2) Find areas of high confluence and mark with rectangular box.
3) Once all areas are marked, turn off indicator to save CPU time.
4) It is now ready to use and you can scan the chart using multiple time frames.
Useful Tips:
1) Use this tool to see if these levels marked are respected in forward testing.
2) You can turn off labels and color code horizontal rays to make tool run more efficiently for the CPU.
3) Use RSI, MACD, Wave Trend with Crosses , or any other oscillator to identify divergences once price hits support & resistance. Observe if price reacts.
4) Confluence is key, the higher the confluence, the better.
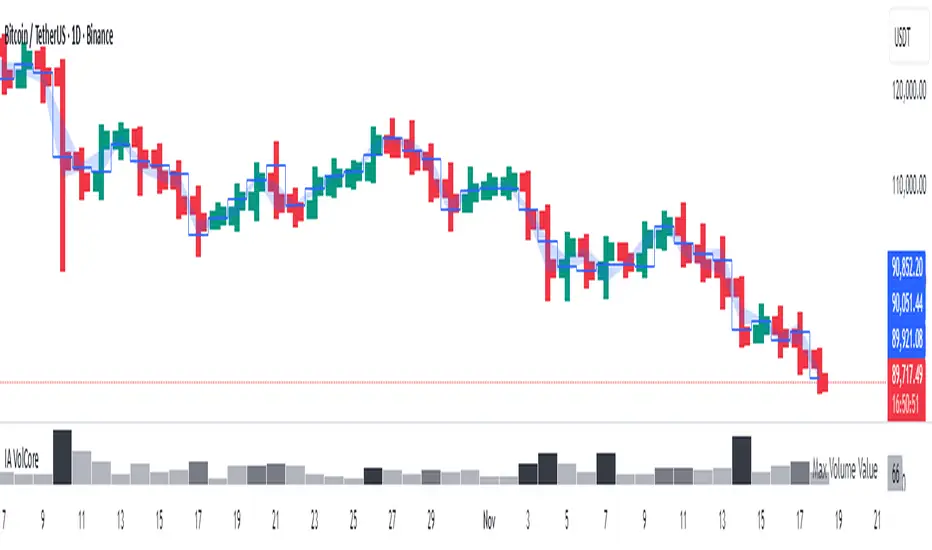
Candle Volume CoreIA VolCore — Candle Volume Core
Indicator Overview
IA VolCore is an intra‑candle volume analysis tool that shows where the core traded volume is concentrated inside each candle.
It visualizes how buyers and sellers interacted within the bar and highlights key levels and zones where the highest activity takes place.
How Calculations Work
The indicator uses the lowest available timeframe data to calculate volume distribution inside each candle.
If you have a Premium or higher subscription, VolCore uses second‑based data for the most accurate results. Older candles (where second‑data is no longer available due to platform limits) are calculated using minute data. The indicator can therefore be used on any timeframe from 1 minute and higher.
If you do not have Premium, the indicator uses minute‑based data only, so it is recommended to use it from the daily timeframe and above.
Example of Calculation
If the chart timeframe is 1 hour and the lowest available timeframe is 1‑second data, the indicator loads 3600 1‑second candles. Each 1‑second candle has a known volume, which is evenly distributed across its own price range.
The 1‑hour candle is then divided into a number of price ranges based on the Candle Volume Resolution parameter. The volumes of all 3600 1-second candles are then aggregated into the corresponding price ranges of the hourly candle.
The final result is a detailed intra‑candle volume map for the entire hour — calculated using the most precise data available.
Custom Timeframe Parameter
If Use Custom Timeframe is enabled and a timeframe is selected, all calculations will be performed strictly using this specified timeframe.
For example: if the chart is on 1D, the user has 1‑second data available, but Custom TF is set to 1 minute, then the volume distribution inside each daily candle will be calculated using 1‑minute candles.
Key Features
Candle Volume Resolution — defines how many price ranges each candle is divided into (3–50,000). All calculations in the indicator are based on this resolution.
Max Volume Level — displays the price level inside the candle where the maximum volume occurred.
% of Volume (1, 2, 3) — defines percentages of the candle's total volume (e.g., 33%, 66%, 50%). For each percentage, VolCore finds the minimum price range containing that share of volume. You can view the corresponding volume values for these shares in histogram form via the Show: Vol % 1–3 parameters. The actual intra-candle zones are displayed using the Show area option.
Volume % for Density — sets the volume percentage used to calculate Vol Density, which reflects how concentrated the volume is inside the selected price range.
Display Parameters (Show)
Show: Vol % 1–3 — shows histograms of volume share zones based on the selected "% of Volume" parameters (with color logic applied).
Show: Max Volume Value — displays the maximum internal volume value for each candle as a histogram (with color logic applied).
Show: Volume — displays the candle's total volume (with color logic applied).
Show: Vol Density — shows the density of volume distribution inside the candle for the selected volume percentage (with color logic applied).
Example Use Cases (not a complete list)
IA VolCore shows where liquidity forms inside each candle, how volume is distributed, and how concentrated trading activity is.
Detecting False Breakouts
If a breakout candle shows increased volume, and after the breakout the core volume forms beyond the level, but the price moves back — VolCore provides a strong signal of a false breakout.
Examples:
Identifying Support & Resistance Zones
If Max Volume Level repeatedly forms in the same internal range over multiple candles, this indicates a hidden support or resistance level.
Example:
Who This Indicator Is For
For traders using volume‑based and contextual market analysis, and for IA (Initiative Analysis) ecosystem users who want a deeper understanding of intra‑candle structure.
Histogram Color Logic
IA VolCore uses three color shades to highlight volume behavior relative to previous candles:
light shade — normal volume, no significant change,
medium shade — volume exceeds both previous candles,
dark shade — volume exceeds the sum of the previous two candles.
This helps quickly spot growing activity and potential shifts in market pressure.
Style Settings
Line styles, histogram styles, and colors can be customized in the indicator’s Style tab.
Adaptive Window Volume ProfileThe indicator builds a rolling volume profile over a chosen time window (1, 3, 12 months or lower), finds POC, VAH/VAL, RH/RL, HVN/LVN, and then overlays volume-driven bar colors (climax, initiative, absorption) filtered by a 30-day RVWAP trend, so you can see where big volume traded and who is winning there right now.
Example Use Case:
How to use it on 4H with 3-month and 12-month rolling profiles:
On a 4H chart, you run two copies of the indicator, both in Rolling Lookback mode, both using the Full (Overlap) engine:
Instance A – 12-month rolling profile (macro map):
-Rolling Unit: Months
-Rolling Length: 12
This gives you the 1-year composite:
-12M RH / RL → outer range of where almost all yearly volume traded (macro high/low “rails”).
-12M VAH / VAL → yearly value area: where the market has been comfortable doing business over the last year.
-12M POC → the single most traded price of the last 12 months (macro gravity).
-12M HVNs/LVNs → long-term shelves (acceptance) and gaps (knife-edges).
Use this instance to answer:
Where are we in the last year’s distribution, and are we approaching macro extremes or living in fair value?
-Combine it with the 30-day RVWAP regime the script computes:
-Above RVWAP and RVWAP rising → macro bull tilt.
-Below RVWAP and RVWAP falling → macro bear tilt.
For example:
-Price near 12M RL with RVWAP bull → potential deep-discount accumulation zone.
-Price near 12M RH with RVWAP bear → potential exhaustion / distribution zone.
Instance B – 3-month rolling profile (tactical map)
-Rolling Unit: Months
-Rolling Length: 3
This builds a 3-month composite on top of your 4H chart:
-3M RH / RL → extremes of the current quarter’s trading.
-3M VAH / VAL → current “fair value box” for the last 90-ish days.
-3M POC → where recent volume concentrates most heavily.
-3M HVNs/LVNs → fresh shelves and gaps inside the bigger yearly structure.
You use this instance for actual trade locations and management:
-Pullbacks into 3M VAL / RL that still sit inside the 12M value and in a bull RVWAP regime → high-probability dip-buy zones; you then look for bull initiative/absorption bar colors to confirm entry.
-Rallies into 3M VAH / RH that line up near 12M VAH / RH in a bear RVWAP regime → good areas to look for shorts, especially when you see bear climax/initiative bars there.
-3M LVNs that coincide with 12M LVNs or VA edges act as sharp decision points: acceptance through often means expansion; rejection often means reversal.
How it all fits together
On your 4H chart, with both instances active:
-12M profile = macro context and big terrain (where the yearly battlefield is).
-3M profile = tactical zones (where to actually trade inside that terrain).
-Bar colors (climax / initiative / absorption) filtered by 30-day RVWAP = timing + confirmation at those levels, favoring the side that has trend and effort behind it.
So the indicator, used this way, becomes:
-one instance to tell you where the big war is being fought (12M)
-one instance to tell you where the current campaign inside that war is concentrated (3M)
-bar colors to tell you whether the team you want to back is actually showing up with size when price hits those levels.

Volume Dynamics Pro [ChartNation]Volume Dynamics Pro by ChartNation is an advanced volume profile indicator that visualizes volume distribution across price levels using a proprietary mirrored butterfly design. The indicator identifies high-volume nodes (areas of significant trading activity) and the Point of Control (POC) - the price level with the highest traded volume within the lookback period.
KEY FEATURES:
Dynamic Volume Profile: Displays volume distribution across 25 price bins with a mirrored butterfly visualization that extends into future bars for forward-looking analysis
Point of Control (POC): Automatically identifies and highlights the price level with maximum volume, featuring a pulsing animation and optional price label with customizable positioning
Multiple Anchoring Modes: Choose between Rolling, Daily, Weekly, Monthly, or Session-based profile calculations to match your trading timeframe
Smart Range Calculation: Three range modes (Fixed Lookback, Hybrid Smart, Percentage-Based) automatically adjust the volume profile range based on recent price action
Volume-Responsive Visualization: Line thickness and glow intensity scale with volume magnitude, making high-volume areas immediately visible
Premium Statistics Box: Real-time display of POC price, total volume, range metrics, and price position relative to POC
Advanced Alert System: Configurable alerts for POC crosses, range breakouts, high-volume zone entries, and volume spikes
Professional Styling: Volume-based line styles (solid/dashed/dotted), gradient bias coloring (support/resistance), dual-tone depth borders, and customizable glow effects
HOW IT WORKS:
The indicator divides the price range into 25 bins and calculates total volume traded at each level. The mirrored butterfly profile displays this distribution, with wider sections indicating higher volume. The POC line marks the price with maximum activity - a critical level often acting as support or resistance.
Volume traces are color-coded: green tint below current price (potential support), red tint above (potential resistance). The intensity of coloring increases as price approaches each level, helping traders identify nearby high-volume zones.
USE CASES:
Identify institutional order flow and accumulation/distribution zones
Locate high-probability support and resistance levels based on actual trading activity
Track POC shifts to understand changing market structure
Confirm breakout validity by analyzing volume at key price levels
Optimize entry/exit points around high-volume nodes
SETTINGS OVERVIEW:
The indicator offers extensive customization across multiple groups: POC styling and extensions, statistics box display, profile anchoring, range calculation modes, alert configuration, line styles, volume-proportional thickness, gradient bias, glow system, depth borders, POC pulse animation, and volume profile display parameters.

POC Lines (Daily / Weekly / Monthly)This indicator plots the Point of Control (POC) on your chart for three key timeframes — daily, weekly, and monthly. The POC is the price level at which the highest trading volume occurred during a given period, highlighting where market participants were most active.
How to Trade Using the Daily / Weekly / Monthly POC Indicator
Identify Market Bias
Use the monthly POC as a major structural reference. If price is above the monthly POC, bias may be bullish; below it may signal caution or potential bearish bias.
Use the weekly POC for intermediate trend context. Price respecting the weekly POC can enhance confidence in direction.
Use the daily POC for fine-tuning entries, exits or intraday structure.
Use POC as Support/Resistance Zones
When price approaches a POC from above, the level can act as support — look for bullish reversal signals.
When price approaches a POC from below, it can act as resistance — look for bearish rejection setups.
If price breaks through a POC convincingly (with strong volume or momentum), then the level may flip: the broken POC becomes a new reference zone for opposite side trades.
Timeframe Confluence = Higher Probability
A trade setup is stronger when the daily, weekly, and monthly POCs align or cluster near the same price zone. This confluence raises the chance that price will react.
Conversely, avoid setups where the POCs are widely scattered across timeframes — these have less structural weight.
Entry, Stop & Target Strategy
Entry: Enter once price touches a significant POC level and shows confirmation (e.g., candlestick reversal, volume spike, or confluence with other level).
Stop-Loss: Place stop just beyond the POC level (for support trades, slightly below; for resistance trades, slightly above).
Target: Use the next major POC or price structure level (previous high/low, value area edges) as your initial target. If price moves through the POC, target a breakout to the next structural zone.
Be patient — price may test a POC level multiple times or ignore it entirely before reacting.
Use the POC indicator as a guiding framework, not a guarantee. Combine with other tools (trend direction, price action, volume, market context) to refine your execution.

Market Structure Volume Time Velocity ProfileThis is the Market Structure Volume Time Velocity Profile (MSVTVP). It combines event-based profiling with advanced metrics like Time and Velocity (Flow Rate). Instead of fixed time periods, profiles are anchored to critical market events (Swings, Structure Breaks, Delta Breaks), giving you a precise view of value development during specific market phases.
## The 3 Dimensions of the Market
Unlike standard tools that only show Volume, MSVTVP allows you
to switch between three critical metrics:
1. **VOLUME Profile (The "Where"):**
* Shows standard acceptance. High volume nodes (HVN)
are magnets for price.
2. **TIME Profile (The "How Long"):**
* Similar to TPO, it measures how long price spent at each
level.
* **High Time:** True acceptance and fair value.
* **Low Time:** Rejection or rapid movement.
3. **VELOCITY Profile (The "How Fast"):**
* Measures the **speed of trading** (Contracts per Second).
This reveals the hidden intent of market participants.
* **High Velocity (Fast Flow):** Aggression. Initiative
buyers/sellers are hitting market orders rapidly. Often
seen at breakouts or in liquidity vacu.
* **Low Velocity (Slow Flow):** Absorption. Massive passive
limit orders are slowing price down despite high volume.
Often seen at major reversals ("hitting a brick wall").
Key Features:
1. **Event-Based Profile Anchoring:** The indicator starts a new
profile based on one of three user-selected events
('Profile Anchor'):
- **Swing:** A new profile begins when the 'impulse baseline'
(derived from intra-bar delta) changes. This baseline
adjusts when a new **price pivot** is confirmed: When a
price **high** forms, the baseline moves to the **lower**
of its previous level or the peak delta (max of
delta O/C) at the pivot. When a price **low** forms, it
moves to the **higher** of its previous level or the
trough delta (min of delta O/C) at the pivot.
- **Structure:** A new profile begins immediately on the bar
that *confirms* a market structure break (e.g., a new HH
or LL, based on a sequence of price pivots).
- **Delta:** A new profile begins immediately on the bar
that *confirms* a break in the *cumulative delta's*
market structure (e.g., a new HH or LL in the delta).
Both 'Swing' and 'Delta' anchors are derived from the same
**continuous (non-resetting) Cumulative Volume Profile Delta (CVPD)**,
which is built from the intra-bar statistical analysis.
2. **Statistical Profile Engine:** For each bar in the anchored
period, the indicator builds a volume profile on a lower
'Intra-Bar Timeframe'. Instead of simple tick counting, it
uses advanced statistical models:
- **Allocation ('Allot model'):** 'PDF' (Probability Density
Function) distributes volume proportionally across the
bar's range based on an assumed statistical model
(e.g., T4-Skew). 'Classic' assigns all volume to
the close.
- **Buy/Sell Split ('Volume Estimator'):** 'Dynamic'
applies a model that analyzes candle wicks and
recent trend to estimate buy/sell pressure. 'Classic'
classifies all volume based on the candle color.
3. **Visualization & Lag:** The indicator plots the final
profile (as a polygon) and the developing statistical
lines (POC, VA, VWAP, StdDev).
- **Note on Lag:** All anchor events require `Pivot Right Bars`
for confirmation.
- In 'Structure' and 'Delta' mode, the developing lines
(POC, VA, etc.) are plotted using a **non-repainting**
method (showing the value from `pivRi` bars ago).
- In 'Swing' mode, the profile is plotted **retroactively**,
starting *from the bar where the pivot occurred*. The
developing lines are also plotted with this full
`pivRi` lag to align with the past data.
4. **Flexible Display Modes:** The finalized profile can be displayed
in three ways: 'Up/Down' (buy vs. sell), 'Total' (combined
volume), and 'Delta' (net difference).
5. **Dynamic Row Sizing:** Includes an option ('Rows per Percent')
to automatically adjust the number of profile rows (buckets)
based on the profile's price range.
6. **Integrated Alerts:** Includes 13 alerts that trigger for:
- A new profile reset ('Profile was resetted').
- Price crossing any of the 6 developing levels (POC,
VA High/Low, VWAP, StdDev High/Low).
- **Alert Lag Assumption:** In 'Swing' mode, alerts are
delayed to match the retroactively plotted lines.
In 'Structure' and 'Delta' modes, alerts fire in
**real-time** based on the *current price* crossing
the *current (repainting)* value of the metric, which
may **differ from the non-repainting plotted line.**
**Caution: Real-Time Data Behavior (Intra-Bar Repainting)**
This indicator uses high-resolution intra-bar data. As a result, the
values on the **current, unclosed bar** (the real-time bar) will
update dynamically as new intra-bar data arrives. This includes
the values used for real-time alerts in 'Structure' and
'Delta' modes.
---
**DISCLAIMER**
1. **For Informational/Educational Use Only:** This indicator is
provided for informational and educational purposes only. It does
not constitute financial, investment, or trading advice, nor is
it a recommendation to buy or sell any asset.
2. **Use at Your Own Risk:** All trading decisions you make based on
the information or signals generated by this indicator are made
solely at your own risk.
3. **No Guarantee of Performance:** Past performance is not an
indicator of future results. The author makes no guarantee
regarding the accuracy of the signals or future profitability.
4. **No Liability:** The author shall not be held liable for any
financial losses or damages incurred directly or indirectly from
the use of this indicator.
5. **Signals Are Not Recommendations:** The alerts and visual signals
(e.g., crossovers) generated by this tool are not direct
recommendations to buy or sell. They are technical observations
for your own analysis and consideration.

Periodic Volume Time Velocity ProfileThis is the Periodic Volume Time Velocity Profile (PVTVP). It is an advanced professional profiling tool that goes beyond standard volume analysis by introducing Time and Velocity (Flow Rate) as profile dimensions.
By analyzing high-resolution intra-bar data, it builds
precise profiles for any custom period (Session, Day, Week, etc.),
helping you understand not just *where* the market traded,
but *how* it traded there.
## The 3 Dimensions of the Market
Unlike standard tools that only show Volume, PVTVP allows you
to switch between three critical metrics:
1. **VOLUME Profile (The "Where"):**
* Shows standard acceptance. High volume nodes (HVN)
are magnets for price.
2. **TIME Profile (The "How Long"):**
* Similar to TPO, it measures how long price spent at each
level.
* **High Time:** True acceptance and fair value.
* **Low Time:** Rejection or rapid movement.
3. **VELOCITY Profile (The "How Fast"):**
* Measures the **speed of trading** (Contracts per Second).
This reveals the hidden intent of market participants.
* **High Velocity (Fast Flow):** Aggression. Initiative
buyers/sellers are hitting market orders rapidly. Often
seen at breakouts or in liquidity vacuums.
* **Low Velocity (Slow Flow):** Absorption. Massive passive
limit orders are slowing price down despite high volume.
Often seen at major reversals ("hitting a brick wall").
## Key Features
1. **Statistical Volume Profile Engine:** For each bar in the selected
period, the indicator builds a complete volume profile on a lower
'Intra-Bar Timeframe'. Instead of simple tick counting, it uses
**statistical models ('PDF' allocation)** to distribute volume
across price levels and **advanced classifiers ('Dynamic' split)**
to determine the buy/sell pressure within that profile.
2. **Flexible Profile Display:** The **finalized profile** (plotted at
the end of each period) can be visualized in three distinct
ways: 'Up/Down' (buy vs. sell), 'Total' (combined volume),
and 'Delta' (net difference).
3. **Developing Key Levels:** The indicator also plots the developing
Point of Control (POC), Value Area (VA), VWAP, and Standard
Deviation bands in real-time as the period unfolds, providing
live insights into the emerging market structure.
4. **Dynamic Row Sizing:** Includes an option ('Rows per Percent')
to automatically adjust the number of profile rows (buckets)
based on the profile's price range, maintaining a consistent
visual density.
5. **Integrated Alerts:** Includes 12 alerts that trigger when the
main price crosses over or under the key developing levels:
POC, VWAP, Value Area High/Low, and the +/- Standard
Deviation bands.
**Caution: Real-Time Data Behavior (Intra-Bar Repainting)**
This indicator uses high-resolution intra-bar data. As a result, the
values on the **current, unclosed bar** (the real-time bar) will
update dynamically as new intra-bar data arrives. This behavior is
normal and necessary for this type of analysis. Signals should only
be considered final **after the main chart bar has closed.**
---
**DISCLAIMER**
1. **For Informational/Educational Use Only:** This indicator is
provided for informational and educational purposes only. It does
not constitute financial, investment, or trading advice, nor is
it a recommendation to buy or sell any asset.
2. **Use at Your Own Risk:** All trading decisions you make based on
the information or signals generated by this indicator are made
solely at your own risk.
3. **No Guarantee of Performance:** Past performance is not an
indicator of future results. The author makes no guarantee
regarding the accuracy of the signals or future profitability.
4. **No Liability:** The author shall not be held liable for any
financial losses or damages incurred directly or indirectly from
the use of this indicator.
5. **Signals Are Not Recommendations:** The alerts and visual signals
(e.g., crossovers) generated by this tool are not direct
recommendations to buy or sell. They are technical observations
for your own analysis and consideration.

NQ Gamma LevelsNQ Gamma Levels - Dynamic Options Flow Visualization
This indicator displays gamma exposure levels from QQQ options data, automatically scaled to NQ/MNQ futures prices. Simply copy gamma data from your dashboard and paste it into the indicator to see key support and resistance levels based on dealer positioning.
Features:
- Automatic QQQ to NQ price conversion using live 1-minute ratios
- Visual strength indicators - thicker/longer lines show stronger gamma concentrations
- Customizable colors for positive and negative gamma levels
- Dotted reference lines extending across the chart for easy price tracking
- Updates every minute to prevent chart clutter and jumping levels
- Filters to show only significant levels above your threshold
- Strongest positive and negative levels are automatically highlighted
The solid colored lines represent gamma strength - longer lines indicate higher concentration at that price level. Dotted lines provide continuous reference points across your chart. Green levels typically act as support (dealers long gamma), while red levels often act as resistance (dealers short gamma).
Best used on 1-5 minute timeframes for intraday trading. Paste fresh data from your options flow dashboard whenever you want updated levels.

Consolidation Value Zones (Recio)Consolidation Value Zones introduces an original algorithm to identify consolidation ranges and locate areas of importance within them. This new method "looks" at the chart and draws zones based on price with the goal of producing actionable zones which appear natural, as if they were found through a human analysis.
> Consider the following...
The chart image above displays Bitcoin, at no specific date, for no specific reason. What I have done here is simply glanced at the chart for about 5 seconds, and circled a few areas which stood out as "obvious" consolidation. It does not take a savant to look at a chart and circle ranging price. However, what we have just done defies many common systems for identifying consolidation. We have located ranges of various zone lengths, as small as roughly 25 bars to as large as roughly 100 bars. Regardless of this, we still determined these zones with our eyes and brain in a few seconds, for some it's practically instant. The issue with us humans doing this, is that we are subjective. We did not really use any concrete rules to determine these areas with our eyes. So the problem becomes "How do we identify these zones in a way which seems natural to us with a repeatable system?" Because of this, my approach is simply a logical attempt to reverse engineer our human intuition.
> Consolidation Value Zones
The name of this indicator is generic. To dissect it, we are identifying consolidation ranges, then using a volume profile to determine the value zone within that range. The specific method used to identify these consolidation zones is something I've personally been referring to as the "skewer" method. Another name that may fit better is "Linear Range Alignment/Overlap".
Ultimately, the goal is to locate a single price level or range that overlaps many adjacent bars.
This should, in theory, return areas of visually obvious consolidation.
> The Skewer Method (Identification Method & Bar Gap Allowances)
One consistent concept across the different identification methods for determining consolidation is time. How long do we chop around before calling it consolidation? This is the "Identification Threshold". Once we have located a consolidation zone "this" wide, we will then consider it as consolidation.
In the chart image above, we are considering a six-bar consolidation formation. The figure on the left shows an example of a perfect raw bar overlap, we can see that the six bars all overlap at one price range. This is a perfect example of what we are looking to identify as consolidation. Unfortunately, if this was all we looked at, we would have a very scarce identification method.
For that reason, we have the example on the right, which shows the additional allowances for the identification of these ranges. At most, the example on the right shows a gapless three-bar overlap. However, if we allow the identification to bridge across the gaps, we are able to draw a zone directly through the center and still be within our parameters. This allowance is the "Bar Gap Allowance" and will determine the leniency of the identification.
Between our identification threshold and bar gap allowance, we can start to piece together how the script is "looking" at our chart.
> Detecting Consolidation (Live Detection)
To aid in transparency and user understanding, the live detection calculation can be seen on the chart as a box, skewering the recent historical bars with a number next to it, indicating the number of bars found as potential consolidation.
As we can see in the chart image above, the script, by default, is looking for a 15-bar consolidation, with a 5-bar gap allowance. In the image, the specific gap count is labeled, we can see the script scan backwards as far as it can before counting five gaps in the data. Once that occurs, the detection stops.
Notice how the zone found is a range, consisting of all price levels which meet the parameters. The lower level of the range only had two gaps, but the upper level reached five.
> Consolidation Range and Value Zones (Volume Profiles)
Once the script has identified the consolidation formation, it calculates a volume profile across the identified consolidation range. From this it calculates and draws the Point of Control (POC) and Value Area in addition to the full consolidation range.
Once we have our zones drawn, and understand what they identify, we can go one step further and apply concepts from volume profile trading.
Range High/Low: Displays the current extent of the identified consolidation.
Value High/Low: Shows the specific area within the consolidation where buyers and sellers found the most value.
POC: The single point, where the most volume was transacted during consolidation.
In a balanced market, we would anticipate price to rotate around POC, oscillating from Value High (VAH) to Value Low (VAL). In contrast, a market in motion moves directionally, building volume at new price levels as value, naturally the POC shifts with it.
> Zone Extensions
Unlike many other scripts, there is no mitigation logic at play here, since crossing a zone simply tells us "buyers and sellers are not currently active here", but it does not guarantee that value cannot return or react from previous areas of value.
Obviously the current zone will always be most relevant, but historical zones can retain relevance depending on the context of the market.
Remember: Each area of consolidation is an area where buyers and sellers were once facing off, resulting in price's consolidation. Amidst this, the value zone was the area of greatest agreement between the participants at that time. When moving outside of a range, we would typically look at historical value areas and price's interaction with them for further context.
Due to the ever changing market, there is no fixed extension lookback that will cover every scenario. By default, the Extension Lookback is "1", meaning the script will extend the most recent zone forward until a new zone is detected.
Note: For clarity, zone extensions are colored differently from core zones.
The following chart image shows a few examples of these unique interactions.
As seen in the chart image, looking to previous areas of value as well as POC can provide context in the form of acceptance or rejection at these levels, providing further insight into the auction for us to respond to.
The zones do contain logic to maintain a clean display. By default, the zones extend conditionally when price returns to the previous consolidation range. If desired, the zones can be extended regardless of price action; this can be toggled with the option "Regardless Extension Mode", as seen below.
> Hollow Candles & Zone Merging
When consolidation is identified, a hollow candle is drawn; these can be used to see exactly when each zone is identified. It is important to understand that consolidation zones stemming from the same origin are merged into one zone. This is a frequent occurrence when the consolidation threshold is passed, but the consolidation continues. For this reason you will often see multiple hollow candles in the later areas of the zones.
Similarly, zones from different origin points that overlap are also merged into one consolidation zone. This ensures that no core zones overlap.
Additionally, every time a zone is merged, a new volume profile for the area is calculated.
> Bar Gap Allowance Type (Technical Explanation)
The specific bar gap allowance value can be altered, but so can the type of allowance being used. While some analyses may benefit from counting the total amount of bar gaps within the consolidation, others may benefit from detecting based on consecutive bar gaps.
The chart image above displays the gap counts for each gap allowance type.
The total bar gap allowance type will count until the gap amount is reached, then terminate detection once the allowed number of gaps has been exceeded.
The consecutive bar gap allowance type resets its count once it finds a valid bar within range, by doing so, it only counts the bars that separate each island of in-range bars.
Both methods have merit.
> Implementation
This identification method has proven effective to identify consolidation across market types. As a result, there cannot be one configuration of settings to fit every application. Adapting the detection type and method for each trader's specific market conditions is highly recommended.
When determining parameters, it is helpful to consider time, as it plays a major role in the identification method.
On a 1D chart, the default threshold of 15 corresponds to 15 days, or about 3 weeks depending on the ticker. To identify periods of one-week consolidation, a threshold of 5 would be suitable. To detect perfect gapless weeks, a bar gap allowance of 0 could be used, as seen in the chart image below.
Additional Example:
In the chart image above, we see a 15-second forex chart over the span of a few hours. The detection parameters are set up to detect 15-minute consolidation with a 2-minute max dead zone (consecutive bar gap).
> Detection Source
By default, the script detects consolidation ranges using the full extent of candle wicks. While this is traditional, detection can also be done using only the candle bodies. These identifications are much more nuanced, detecting only from confirmed candle price action; they do not trigger at the same frequency as wick detection.
Optionally, a "Wick/Body Average" can be chosen as the source for detection; as the name implies, this uses the average value between the candle body and its respective wick.
> Additional Settings
The settings mentioned thus far serve as core parameters for identifying consolidation. The following parameters are simply included for the benefit of the advanced user. It is not recommended to adjust these settings under normal circumstances.
- Value Area Percent: Default = 68.26, while traditionally 70 for volume profiles, 68.26 is accurate to the values of a standard bell-curve distribution. The differences are minimal in application.
- VP Rows: Default = 99, Sets the number of rows to be used when calculating the Volume Profiles (VP); note that higher values will lead to a slower calculation. Max value: 999
> Final Notes
If you have made it this far, thank you for reading.
I hope you find value in this new consolidation identification system and understand the logic behind it.
That's it.
付費腳本

Smart VWAP FVG SystemSmart VWAP FVG System - Professional Multi-Filter Trading Indicator
📊 OVERVIEW
The Smart VWAP FVG System is an advanced multi-layered trading indicator that combines institutional volume analysis, multi-timeframe VWAP trend confirmation, and Fair Value Gap detection to identify high-probability trade entries. This indicator uses a sophisticated filtering mechanism where signals appear only when multiple independent confirmation criteria align simultaneously.
Recommended Timeframe: 5-minute (M5) or higher. The indicator works best on M5, M15, and M30 charts for intraday trading.
🎯 ORIGINALITY & PURPOSE
This indicator is original because it combines three distinct analytical methods into a unified decision-making system:
Market Profile Volume Analysis - Identifies institutional accumulation/distribution zones
Dual VWAP Filtering - Confirms trend direction using two independent VWAP calculations
Fair Value Gap Detection - Validates institutional interest through price inefficiency zones
The key innovation is the directional filter system: the primary Market Profile generates BUY-ONLY or SELL-ONLY states based on higher timeframe value area reversals, which then controls which signals from the main system are displayed. This creates a multi-timeframe confluence that significantly reduces false signals.
Unlike simple indicator mashups, each component serves a specific purpose:
Market Profile → Direction bias (trend filter)
Primary VWAP (Session) → Short-term trend confirmation
Secondary VWAP (Week) → Medium-term trend confirmation
FVG Detection → Institutional activity validation
🔧 HOW IT WORKS
1. Primary Market Profile Filter (Higher Timeframe)
The indicator calculates Market Profile on a higher timeframe (default: 1 hour) to determine the overall market structure:
Value Area High (VAH): Top 70% of volume distribution
Value Area Low (VAL): Bottom 70% of volume distribution
Point of Control (POC): Price level with highest volume
When price reaches VAH and reverses down → SELL-ONLY mode activated
When price reaches VAL and reverses up → BUY-ONLY mode activated
This higher timeframe filter ensures you're trading in the direction of institutional flow.
2. Dual VWAP System
Two independent VWAP calculations provide multi-timeframe trend confirmation:
Primary VWAP (Session-based): Resets daily, tracks intraday momentum
Secondary VWAP (Week-based): Resets weekly, confirms longer-term trend
Filter Logic:
BUY signals require: Price > Primary VWAP AND Price > Secondary VWAP
SELL signals require: Price < Primary VWAP AND Price < Secondary VWAP
This dual confirmation prevents counter-trend trades during ranging conditions.
3. Fair Value Gap (FVG) Detection
FVG zones identify price inefficiencies where institutional orders were executed rapidly:
Bullish FVG: Gap between candle .high and candle .low (upward imbalance)
Bearish FVG: Gap between candle .high and candle .low (downward imbalance)
The indicator monitors recent FVG formation (lookback: 50 bars) and requires:
Bullish FVG present for BUY signals
Bearish FVG present for SELL signals
FVG zones are displayed as colored boxes and automatically marked as "mitigated" when price fills the gap.
4. Main Trading Signal Logic
The secondary Market Profile (default: 1 hour) generates the actual trading signals:
BUY Signal Conditions:
Price reaches Value Area Low
Reversal pattern confirmed (minimum 1 bar)
Price > Primary VWAP
Price > Secondary VWAP (if filter enabled)
Recent Bullish FVG detected (if filter enabled)
Primary MP Filter = BUY-ONLY or NEUTRAL
SELL Signal Conditions:
Price reaches Value Area High
Reversal pattern confirmed (minimum 1 bar)
Price < Primary VWAP
Price < Secondary VWAP (if filter enabled)
Recent Bearish FVG detected (if filter enabled)
Primary MP Filter = SELL-ONLY or NEUTRAL
All conditions must be TRUE simultaneously for a signal to appear.
📈 VISUAL ELEMENTS
On Chart:
🟢 Green Triangle (▲) = BUY Signal
🔴 Red Triangle (▼) = SELL Signal
🟦 Blue horizontal lines = Value Area zones
🟡 Yellow line = Point of Control (POC)
🟩 Green boxes = Bullish FVG zones
🟥 Red boxes = Bearish FVG zones
🔵 Blue line = Primary VWAP (Session)
⚪ White line = Secondary VWAP (Week)
Info Panel (Top Right):
Real-time status display showing:
Filter Direction (BUY ONLY / SELL ONLY / NEUTRAL)
Active timeframes for both MP filters
FVG filter status and count
VWAP positions (ABOVE/BELOW)
Signal enablement status
Alert status
⚙️ KEY SETTINGS
MP/TPO Filter Settings (Primary Indicator)
MP Filter Time Frame: 60 minutes (controls directional bias)
Filter Value Area %: 70% (standard Market Profile calculation)
Filter Alert Distance: 1 bar
Filter Min Bars for Reversal: 1 bar
Filter Alert Zone Margin: 0.01 (1%)
FVG Filter Settings
Use FVG Filter: Enabled (toggle on/off)
FVG Timeframe: 60 minutes (1 hour)
FVG Filter Mode: Both (require bullish FVG for BUY, bearish for SELL)
FVG Lookback Period: 50 bars (how far back to search)
Show FVG Formation Signals: Optional visual markers
Max FVG on Chart: 50 zones
Show Mitigated FVG: Display filled gaps
Market Profile Settings
Higher Time Frame: 60 minutes (for main signals)
Percent for Value Area: 70%
Show POC Line: Enabled
Keep Old MPs: Enabled (maintain historical profiles)
Primary VWAP Filter
Use Primary VWAP Filter: Enabled
Primary VWAP Anchor Period: Session (resets daily)
Primary VWAP Source: HLC3 (typical price)
Secondary VWAP Filter
Use Secondary VWAP Filter: Enabled
Secondary VWAP Anchor Period: Week (resets weekly)
Secondary VWAP Filter Mode: Both
Secondary VWAP Line Color: White
Trading Signals
Show Trading Signals on Chart: Enabled
Show SELL Signals: Enabled
Show BUY Signals: Enabled
Alert Distance: 1 bar
Min Bars for Reversal: 1 bar
Alert Zone Margin: 0.01 (1%)
Retest Search Period: 20 bars
Min Bars Between Retests: 5 bars
Show Only Retests: Disabled
Alert Settings
Enable Trading Notifications: Enabled
VAH Reversal Alert: Enabled (SELL signals)
VAL Reversal Alert: Enabled (BUY signals)
Time Filter Settings
Filter Alerts By Time: Optional (exclude specific hours)
⚠️ IMPORTANT WARNINGS & LIMITATIONS
1. Repainting Behavior
CRITICAL: This indicator uses lookahead=barmerge.lookahead_on to access higher timeframe data immediately for FVG detection. This is necessary to provide real-time FVG zone visualization but has the following implications:
FVG zones may shift slightly until the higher timeframe candle closes
FVG detection signals are preliminary until HTF bar confirmation
The main trading signals (triangles) appear on confirmed bars and do not repaint
Best Practice: Always wait for the current timeframe bar to close before acting on signals. The filter status and FVG zones are informational but may adjust as new data arrives.
2. Minimum Timeframe
Do NOT use on timeframes below 5 minutes (M5)
Recommended: M5, M15, M30 for intraday trading
Higher timeframes (H1, H4) can also be used but will generate fewer signals
3. Multiple Filters Can Block Signals
By design, this indicator is conservative. When all filters are enabled:
Signals appear ONLY when all conditions align
You may see extended periods with no signals
This is intentional to reduce false positives
If you see no signals:
Check the Info Panel to see which filters are failing
Consider adjusting FVG lookback period
Temporarily disable FVG filter to test
Verify VWAP filters match current market trend
4. Market Profile Limitations
Market Profile requires sufficient volume data
Low-volume instruments may produce unreliable profiles
Value Areas update only on higher timeframe bar close
Works best on liquid markets (major forex pairs, indices, crypto)
📖 HOW TO USE
Step 1: Add to Chart
Apply indicator to M5 or higher timeframe chart
Ensure chart shows volume data
Use standard candles (NOT Heikin Ashi, Renko, etc.)
Step 2: Configure Settings
Primary MP Filter TF: Set to 60 (1 hour) minimum, or 240 (4 hour) for swing trading
Main MP TF: Set to 60 (1 hour) for intraday signals
FVG Timeframe: Match or exceed main MP timeframe
Leave other settings at default initially
Step 3: Understand the Info Panel
Monitor the top-right panel:
FILTER STATUS: Shows current directional bias
NEUTRAL = Both signals allowed
BUY ONLY = Only green triangles will appear
SELL ONLY = Only red triangles will appear
FVG Filter: Shows if bullish/bearish gaps detected recently
VWAP positions: Confirms trend alignment
Step 4: Take Signals
For BUY Signal (Green Triangle ▲):
Wait for green triangle to appear
Check Info Panel shows ✓ for BUY signals
Confirm current bar has closed
Enter long position
Stop loss: Below recent VAL or swing low
Target: Previous Value Area High or 1.5-2× risk
For SELL Signal (Red Triangle ▼):
Wait for red triangle to appear
Check Info Panel shows ✓ for SELL signals
Confirm current bar has closed
Enter short position
Stop loss: Above recent VAH or swing high
Target: Previous Value Area Low or 1.5-2× risk
Step 5: Risk Management
Risk per trade: Maximum 1-2% of account equity
Position sizing: Adjust based on stop loss distance
Avoid trading: During major news events or time filter periods
Multiple confirmations: Look for confluence with price action (support/resistance, trendlines)
🎓 UNDERLYING CONCEPTS
Market Profile Theory
Developed by J. Peter Steidlmayer in the 1980s, Market Profile organizes price and volume data to identify:
Value Areas: Where 70% of trading activity occurred
POC: Price level with highest acceptance (most volume)
Imbalances: When price moves away from value quickly
This indicator uses TPO (Time Price Opportunity) calculation method to build the volume profile distribution.
VWAP (Volume Weighted Average Price)
VWAP represents the average price weighted by volume, showing where institutional traders are positioned:
Price above VWAP = Bullish (institutions accumulated lower)
Price below VWAP = Bearish (institutions distributed higher)
Using dual VWAP (Session + Week) creates multi-timeframe trend alignment.
Fair Value Gaps (FVG)
Also known as "imbalance" or "inefficiency," FVG occurs when:
Price moves so rapidly that a gap forms in the candlestick structure
Indicates institutional order flow (large market orders)
Price often returns to "fill" these gaps (rebalance)
The 3-candle FVG pattern (gap between candle and candle ) is widely used in ICT (Inner Circle Trader) methodology and Smart Money Concepts.
🔍 CREDITS & CODE ATTRIBUTION
This indicator builds upon established technical analysis concepts and combines multiple methodologies:
1. Market Profile / TPO Calculation
Concept Origin: J. Peter Steidlmayer (Chicago Board of Trade, 1980s)
Code Inspiration: TradingView's public domain Market Profile examples
Modifications: Custom filtering logic for directional bias, dual timeframe implementation
2. VWAP Calculation
Concept Origin: Standard financial instrument (widely used since 1980s)
Code Base: TradingView built-in ta.vwap() function (public domain)
Modifications: Dual VWAP system with independent anchor periods, custom filtering modes
3. Fair Value Gap Detection
Concept Origin: Inner Circle Trader (ICT) / Smart Money Concepts methodology
Code Implementation: Original implementation based on 3-candle gap pattern
Features: Multi-timeframe detection, automatic mitigation tracking, visual zone display
4. Pine Script Framework
Language: Pine Script v6 (TradingView)
Built-in Functions Used:
ta.vwap() - Volume weighted average price
request.security() - Higher timeframe data access
ta.change() - Period detection
ta.cum() - Cumulative volume
time() - Timestamp functions
Note: All code is original implementation. While concepts are based on established trading methodologies, the combination, filtering logic, and execution are unique to this indicator.
📊 RECOMMENDED INSTRUMENTS
Best Performance:
Major Forex Pairs (EURUSD, GBPUSD, USDJPY)
Stock Indices (ES, NQ, SPX, DAX)
Major Cryptocurrencies (BTCUSD, ETHUSD)
Liquid Stocks (high daily volume)
Avoid:
Low-volume altcoins
Illiquid stocks
Exotic forex pairs with wide spreads
⚡ PERFORMANCE TIPS
Start Conservative: Enable all filters initially
Reduce Filters Gradually: If too few signals, disable Secondary VWAP filter first
Match Timeframes: Keep MP Filter TF and FVG TF at same value
Backtest First: Review historical performance on your preferred instrument/timeframe
Combine with Price Action: Look for support/resistance confluence
Use Time Filter: Avoid low-liquidity hours (optional setting)
🚫 WHAT THIS INDICATOR DOES NOT DO
Does not guarantee profits - No trading system is 100% accurate
Does not predict the future - Based on historical patterns
Does not replace risk management - Always use stop losses
Does not work on all instruments - Requires volume data and liquidity
Does not provide exact entry/exit prices - Signals are zones, not precise levels
Does not account for fundamentals - Purely technical analysis
📜 DISCLAIMER
This indicator is provided for educational and informational purposes only. It is not financial advice, and past performance does not guarantee future results.
Trading Risk Warning:
All trading involves risk of loss
You can lose more than your initial investment (leverage products)
Only trade with capital you can afford to lose
Always use appropriate position sizing and risk management
Consider seeking advice from a licensed financial advisor
Technical Limitations:
Indicator may repaint FVG zones until HTF bar closes
Signals are based on historical patterns that may not repeat
Market conditions change and no system works in all environments
Volume data quality varies by exchange/broker
By using this indicator, you acknowledge these risks and agree that the author bears no responsibility for trading losses.
📞 SUPPORT & UPDATES
Questions? Comment on this publication
Issues? Describe the problem with chart screenshot
Feature Requests? Suggest improvements in comments
Updates: Will be published as new versions using TradingView's update feature
📝 VERSION HISTORY
Version 1.0 (Current)
Initial public release
Multi-filter system: MP + Dual VWAP + FVG
Directional bias filter
Real-time info panel
Comprehensive alert system
Time-based filtering
Thank you for using Smart VWAP FVG System!
Happy Trading! 📈

SR-ZnV2There are many support and resistance scripts out there. I was unable to find one that met all of my needs so I have expanded on the closest ones that I was able to discover. The ability to show persistent S/R levels by volume at various time frames automates much of the process for the user with unique and customizable features, the lastest dated of which are displayed by its time frame support/resistance strength and extend toward the right of the screen where they can be seen more clearly by price .
// Original script is thanks to tommyf1001, synapticex and additional modifications is thanks to Lij_MC. Credit to both of them for most of the logic behind this script. Since then I have made many changes to this script as noted below.
// Changed default S/R lines from plots to lines, and gave option to user to change between solid line, dashed line, or dotted line for both S/R lines.
// Added additional time frame and gave more TF options for TF1 other than current TF. Now you will have 4 time frames to plot S/R zones from.
// Gave user option to easily change line thickness for all S/R lines.
// Made it easier to change colors of S/R lines and zones by consolidating the options under settings (rather than under style).
// Added extensions to active SR Zones to extend all the way right.
// Added option to extend or not extend the previous S/R zones up to next S/R zone.
// Added optional time frame labels to active S/R zones, with left and right options as well as option to adjust how far to the right label is set.
// Fixed issue where the higher time frame S/R zone was not properly starting from the high/low of fractal. Now any higher time frame S/R will begin exactly at the High/Low points.
// Added to script a function that will prevent S/R zones from lower time frames displaying while on a higher time frame. This helps clean up the chart quite a bit.
// Created arrays for each time frame's lines and labels so that the number of S/R zones can be controlled for each time frame and limit memory consumption.
// New alert options added and customized alert messages.

OutsiderEdge – Node Breach Engine (NBE)Overview – What is the Node Breach Engine (NBE)?
NBE is a swing/session volume-profile engine that builds profiles between pivots (or per session), tracks closed & developing POC, and prints breach signals when price challenges the control node. It quantifies node strength, buy/sell composition (CVD) at the POC and the entire profile, Value Area levels (VAH/VAL), VWAP distance, time at price, and introduces a PoV (Point of Void; the LVN located inside the Value Area): to highlight low-participation corridors where rotations or rejections often form. A lightweight EMA smoothed trend can optionally filter signals by prevailing bias.
Use it to answer fast: How strong is this node? Is the profile buy- or sell-led? Are we accepting/rejecting control? Is the developing POC migrating? Is the VA’s LVN (PoV) about to rotate back to POC or reject?
🔹 FEATURES
Volume Profile Core (Swing or Session)
Build pivot-to-pivot or session profiles with configurable row density and Value Area %.
Draw VAH/VAL with optional VA fill and optional profile window background.
Control Node (POC) – Closed & Developing
Closed POC highlighted on finished windows.
Developing POC path stitched bar-by-bar on the active segment (visual migration of control).
Optional POC row highlight and extend-until-touch behavior.
PoV – Point of Void
Detects the lowest-volume row within the current VA band (between VAL and VAH).
Plots a PoV anchor/line you can use as a rotation target or rejection boundary:
Rotations: VAH ↔ PoV (LVN) ↔ POC ↔ VAL.
Rejections: Thin participation at PoV often flips acceptance back toward POC.
Works alongside POC/VA to map acceptance vs. rejection with finer granularity than a single control node.
Node Context Tooltip (Deep Dive)
Compact tooltips on closed profiles: POC price, Node Strength % (POC/Total), CVD split (Buy%/Sell%), VWAP distance %, bars at price.
Profile Buy/Sell Overview (Stacked Bars)
Two stacked horizontal bars (Buy ▲ / Sell ▼) whose width matches the histogram and thickness is configurable.
Auto-placed above or below the profile using swing H/L logic.
Available for closed and developing profiles.
CVD at POC and Full-Profile
Quick labels for Buy% / Sell% at the POC.
Stacked bars summarize full-profile pressure at a glance.
Trend Context
Gradient EMA base vs. smoothed EMA wave for bull/bear bias.
Filter signals to trend direction (only ▲ in uptrend, only ▼ in downtrend).
Breach Signals with Practical Filters
Signals print when price touches/rejects the POC.
Filters: rejection close, ATR momentum guard, wick confirmation, ± margin tolerance, session time filter.
One-shot per bar; coded with object-limit hygiene.
Swing % Change Labels
Small labels at swing H/L showing % move across the last swing window.
Alerts
POC Breach Signal alert for automation/notifications.
🔹 USAGE
In the examples below, you see chart snapshot with labeled alerts/points of POV and POC rejections.
1 — Bearish POC Rejection (▼)
Price tags POC and closes below; ATR guard; EMA wave is bearish. Treat as trend-aligned continuation, reversals or risk tighten on longs.
2 — Bearish POV (LVN) Rejection (▼)
Price probes POV and fails to accept; low participation at PoV flips acceptance. Useful for rotation setups or partials.
3 — Bullish POV Rejection (▲)
Price tags POV and closes above; ATR guard; EMA wave is bullish. Treat as trend-aligned continuation, reversals or risk tighten on shorts.
Treat every signal as context, not as a command. The edge comes from combining location (POC/VA/PoV) with pressure (Node Strength/CVD/VWAP distance) and your structure/timing rules.
🔹 NAVIGATING MARKET CONDITIONS
Trending markets
Expect POC drift with trend; breaches tend to follow-through. Favor trend-aligned breaches; use PoV and VA for add/trim decisions.
Ranges
Frequent VA rotations VAH ↔ PoV ↔ POC ↔ VAL. Fades can work with tight invalidation; lean on PoV to avoid fighting acceptance near POC.
Regime shifts
Repeated failed breaches, PoV rejections, and developing POC re-anchoring are early tells. Adjust filters (ATR guard, wick) and window density as volatility changes.
🔹 SETTINGS SUMMARY
Profile Type: Swing / Session
Window: Present (developing) or Closed Profiles
Rows, lookback cap, Value Area %, optional background
Show POC (closed/developing), POC row highlight
VAH/VAL visibility, optional VA fill
Enable PoV detection (LVN inside VA).
Style controls; optional display with VA/POC.
Rejection close, ATR × multiplier, Wick % threshold, ± Margin %, Session time (trade inside/skip inside)
Enable EMA wave; lengths & smoothing
Toggle CVD; thickness (rows); colors; label text
Swing % change, tooltips, color controls
POC and POV Breach Alerts
🔹 GOOD PRACTICES
Think location + pressure: POC/VA/POV (where) × Node Strength/CVD/VWAP distance (how strong).
Align with HTF structure and liquidity; let POC/POV/VA act as decision levels (initiate, add, reduce, invalidate).
Calibrate row density per symbol/TF; too coarse = blind spots, too fine = noise.
Keep filters honest—if you must loosen them to force a trade, the setup isn’t there.
🔹 LIMITATIONS / DISCLAIMER
NBE does not use lookahead and does not repaint, but no indicator guarantees outcomes.
Node Strength, CVD, PoV, and thresholds are contextual, not signals on their own.
Use independent validation, position sizing, and strict risk management.
Trading involves substantial risk. This tool is for educational purposes only and is not financial advice. Past performance does not guarantee future results. You are solely responsible for your trading decisions and risk management.
Release Notes
v1.1 — PoV (Point of Void) & Profile CVD Bars
Added PoV = LVN inside Value Area as a dedicated anchor/line.
Added stacked profile Buy/Sell bars for closed & developing profiles (width-matched, thickness configurable).
Improved developing VA line/fill updates and object cleanup.
v1.0 — Initial invite-only
Swing/Session profiles; VAH/VAL + optional VA fill
Closed POC highlight + Developing POC path
Node Context Tooltip (POC price, Node Strength, CVD, VWAP distance, bars at price)
EMA wave (trend filter) + breach filters (rejection, ATR guard, wick, time, ± margin)
POC Breach Signal alert & price-panel markers

Quantura - Average Intraday Candle VolumeIntroduction
“Quantura – Average Intraday Candle Volume” is a quantitative visualization tool that calculates and displays the average traded volume for each intraday time position based on a user-defined historical lookback period. It allows traders to analyze recurring intraday volume patterns, identify high-activity sessions, and detect liquidity shifts throughout the trading day.
Originality & Value
This indicator goes beyond standard volume averages by normalizing and aligning volume data according to the time of day. Instead of simply smoothing recent bars, it builds an intraday volume profile based on historical daily averages, enabling users to understand when during the day volume typically peaks or drops.
Its originality and usefulness come from:
Converting standard volume data into time-aligned intraday averages.
Visualization of historical intraday liquidity behavior, not just total daily volume.
Dynamic scaling using normalization and transparency to emphasize active and quiet periods.
Optional day-separator lines for precise intraday structure recognition.
Gradient-based coloring for better visual interpretation of volume intensity.
Functionality & Core Logic
The indicator divides each day into discrete intraday time positions (based on chart timeframe).
For each position, it stores and updates historical volume values across the selected number of days.
It calculates an average volume per time position by aggregating all stored values and dividing them by the number of valid days.
The result is plotted as a continuous histogram showing typical intraday volume distribution.
The bar colors and transparency dynamically reflect the relative intensity of volume at each point in the day.
Parameters & Customization
Number of Days for Averaging: Defines how many past days are included in the volume average calculation (default: 365).
UTC Offset: Allows synchronization of intraday cycles with local or exchange time zones.
Base Color: Sets the main color for plotted volume columns.
Color Mode: Choose between “Gradient” (transparency dynamically adjusts by intensity) or “Normal” (fixed opacity).
Day Line: Toggles dashed vertical lines marking the start of each trading day.
Visualization & Display
Volume is plotted as a series of histogram bars, each representing the average volume for a specific intraday time position.
A gradient color mode enhances readability by fading lower-intensity areas and highlighting high-volume regions.
Optional day-separator lines visually segment historical sessions for easy reference.
Works seamlessly across all chart timeframes that divide the 24-hour day into regular bar intervals.
Use Cases
Identify when trading activity typically peaks (e.g., session opens, news windows, or overlapping markets).
Compare current intraday volume to historical averages for early anomaly detection.
Enhance algorithmic or discretionary strategies that depend on volume-timing alignment.
Combine with volatility or price structure indicators to confirm market activity zones.
Evaluate session consistency across different time zones using the UTC offset parameter.
Limitations & Recommendations
The indicator requires intraday data (below 1D resolution) to function properly.
Volume behavior may vary across brokers and assets; adjust averaging period accordingly.
Does not predict price movement — it provides volume-based context for analysis.
Works best when combined with structure or momentum-based indicators.
Markets & Timeframes
Compatible with all intraday markets — including crypto, Forex, equities, and futures — and all intraday timeframes (from 1 minute to 4 hours). It is particularly valuable for analyzing assets with continuous 24-hour trading activity.
Author & Access
Developed 100% by Quantura. Published as a Open-source script indicator. Access is free.
Important
This description complies with TradingView’s Script Publishing and House Rules. It provides a clear explanation of the indicator’s originality, logic, and purpose, without any unrealistic performance or predictive claims.

Volumemetrix Variance StrategyThe “Volumemetrix Variance Strategy” is an advanced Pine Script strategy designed to identify trade entries and exits using a combination of volume profile analysis, candle structure, and volatility filters. It constructs a dynamic volume profile over a specified lookback period to identify critical price levels such as the Point of Control (PoC), Value Area High (VAH), and Value Area Low (VAL). These levels represent zones of high trading activity that often act as support and resistance. The script smooths and adjusts these levels across different timeframes to align short-term market structure with higher-timeframe trends. It incorporates a variety of filters to exclude doji candles, detect continuation or rejection patterns, and confirm alignment with higher timeframe candle direction (e.g., 4-hour bullish or bearish bias).
Trade logic is built around detecting crossovers and breakouts relative to the PoC and value areas. The system can trigger entries based on several configurable behaviors: breakout, retake, bounce, reversal, or rejection near key volume zones. It supports flexible entry conditions for long, short, or both sides of the market, as well as a range of customizable settings for time-based trading restrictions, end-of-day position closures, and alert-based data capture. For execution, the script includes integrated risk management—users can specify take-profit and stop-loss levels, enable moving (trailing) stops, and even apply a “power curve” model to dynamically adjust trailing stops using exponential decay logic that adapts to price progress.
Overall, the Volumemetrix Variance Strategy is a hybrid between a quantitative volume-based strategy and a volatility-adaptive trade manager. It combines fixed range volume profiling with multi-timeframe confirmation, candle pattern validation, and adaptive exit logic. Its architecture allows for detailed trade automation, alert generation for external systems, and real-time control over parameters such as ATR scaling, entry delay, or bar confirmation. The result is a high-granularity framework for both backtesting and live execution that seeks to capture statistically favorable setups around liquidity concentration zones.

Volume Area 80 Rule Pro - Adaptive RTHSummary in one paragraph
Adaptive value area 80 percent rule for index futures large cap equities liquid crypto and major FX on intraday timeframes. It focuses activity only when multiple context gates align. It is original because the classic prior day value area traverse is fused with a daily regime classifier that remaps the operating parameters in real time.
Scope and intent
• Markets. ES NQ SPY QQQ large cap equities BTC ETH major FX pairs and other liquid RTH instruments
• Timeframes. One minute to one hour with daily regime context
• Default demo used in the publication. ES1 on five minutes
• Purpose. Trade only the balanced days where the 80 percent traverse has edge while standing aside or tightening rules during trend or shock
Originality and usefulness
• Unique fusion. Prior day value area logic plus a rolling daily regime classifier using percentile ranks of realized volatility and ADX. The regime remaps hold time end of window stop buffer and value area coverage on each session
• Failure mode addressed. False starts during strong trend or shock sessions and weak traverses during quiet grind
• Testability. All gates are visible in Inputs and debug flags can be plotted so users can verify why a suggestion appears
• Portable yardstick. The regime uses ATR divided by close and ADX percent ranks which behave consistently across symbols
Method overview in plain language
The script builds the prior session profile during regular trading hours. At the first regular bar it freezes yesterday value area low value area high and point of control. It then evaluates the current session open location the first thirty minute volume rank the open gap rank and an opening drive test. In parallel a daily series classifies context into Calm Balance Trend or Shock from rolling percentile ranks of realized volatility and ADX. The classifier scales the rules. Calm uses longer holds and a slightly wider value area. Trend and Shock shorten the window reduce holds and enlarge stop buffers.
Base measures
• Range basis. True Range smoothed over a configurable length on both the daily and intraday series
• Return basis. Not required. ATR over close is the unit for regime strength
Components
• Prior Value Area Engine. Builds yesterday value area low value area high and point of control from a binned volume profile with automatic TPO fallback and minimum integrity guards
• Opening Location. Detects whether the session opens above the prior value area or below it
• Inside Hold Counter. Counts consecutive bars that hold inside the value area after a re entry
• Volume Gate. Percentile of the first thirty minutes volume over a rolling sample
• Gap Gate. Percentile rank of the regular session open gap over a rolling sample
• Drive Gate. Opening drive check using a multiple of intraday ATR
• Regime Classifier. Percentile ranks of daily ATR over close and daily ADX classify Calm Balance Trend Shock and remap parameters
• Session windows optional. Windows follow the chart exchange time
Fusion rule
Minimum satisfied gates approach. A re entry must hold inside the value area for a regime scaled number of bars while the volume gap and drive gates allow the setup. The regime simultaneously scales value area coverage end minute time stop and stop buffer.
Signal rule
• Long suggestion appears when price opens below yesterday value area then re enters and holds for the required bars while all gates allow the setup
• Short suggestion appears when price opens above yesterday value area then re enters and holds for the required bars while all gates allow the setup
• WAIT shows implicitly when any required gate is missing
• Exit labels mark target touch stop touch or a time based close
Inputs with guidance
Setup
• Signal timeframe. Uses the chart by default
• Session windows optional. Start and end minutes inside regular trading hours
• Invert direction is not used. The logic is symmetric
Logic
• Hold bars inside value area. Typical range 3 to 12. Raising it reduces trades and favors better traverses. Lowering it increases frequency and risk of false starts
• Earliest minute since RTH open and Latest minute since RTH open. Typical range 0 to 390. Reducing the latest minute cuts late session trades
• Time stop bars after entry. Typical range 6 to 30. Larger values give setups more room
Filters
• Value area coverage. Typical range 0.70 to 0.85. Higher coverage narrows the traverse but accepts fewer days
• Bin size in ticks. Typical range 1 to 8. Larger bins stabilize noisy profiles
• Stop buffer ticks beyond edge. Typical range 2 to 20. Larger buffers survive noise
• First thirty minute volume percentile. Typical range 0.30 to 0.70. Higher values require more active opens
• Gap filter percentile. Typical range 0.70 to 0.95. Lower values block more gap days
• Opening drive multiple and bars. Higher multiple or longer bars block strong directional opens
Adaptivity
• Lookback days for regime ranks. Typical 150 to 500
• Calm RV percentile. Typical 25 to 45
• Trend ADX percentile. Typical 55 to 75
• Shock RV percentile. Typical 75 to 90
• End minute ratio in Trend and Shock. Typical 0.5 to 0.8
• Hold and Time stop scales per regime. Use values near one to keep behavior close to static settings
Realism and responsible publication
• No performance claims. Past results never guarantee future outcomes
• Shapes can move while a bar forms and settle on close
• Sessions use the chart exchange time
Honest limitations and failure modes
• Economic releases and thin liquidity can break the balance premise
• Gap heavy symbols may work better with stronger gap filters and a True Range focus
• Very quiet regimes reduce signal contrast. Consider longer windows or higher thresholds
Legal
Education and research only. Not investment advice. Test in simulation before any live use.

Dynamic Liquidity HeatMap Profile [BigBeluga]🔵 OVERVIEW
The Dynamic Liquidity HeatMap Profile is a smart-flow liquidity tracker that maps where stop-loss clusters and resting limit orders are likely positioned.
Instead of traditional volume profiles based only on executed transactions, this tool projects probable liquidity pools — areas where traders are trapped or positioned and where smart money may hunt stops or fill orders.
It dynamically scans recent price swings, builds liquidity zones above and below price, and visualizes them as a heat map + histogram — highlighting areas with the greatest liquidity attraction.
Orange highlights the highest-concentration liquidity (POC), making potential sweep targets obvious.
🔵 CONCEPTS
Liquidity pools form above swing highs (buy stops) and below swing lows (sell stops).
Market makers & large players often push price into these zones to trigger stops and capture liquidity.
The indicator uses recent volatility + volume expansion to estimate where these pools exist.
Horizontal heat bars show depth and intensity of probable liquidity.
Profile side histogram displays buy-side vs sell-side liquidity distribution.
🔵 FEATURES
Dynamic Liquidity Detection — finds potential stop-loss clusters from recent swing behavior.
Dual-Side Heatmap — split liquidity view above (short stops) and below (long stops) current price.
Volume-Weighted Levels — higher volatility & volume = deeper liquidity expectation.
Real-Time Heat Coloring
• Lime = liquidity below price (potential buy-side fuel)
• Blue = liquidity above price (potential sell-side fuel)
• Orange = peak liquidity (POC)
Liquidity Profile Histogram — plotted at right side, layered by strength.
Auto-Cleaning Engine — removes invalidated liquidity after breaks.
Adjustable lookback window and bin resolution .
🔵 HOW TO USE
Look for price moving toward dense liquidity zones — high probability of wick raids or sweeps.
Orange POC often acts as magnet — strong target zone for smart money.
Combine with SFP / BOS logic to time reversals after liquidity hunts.
In trend, price repeatedly sweeps opposite-side liquidity before continuation.
Use liquidity walls as bias filters — heavy liquidity above often precedes downward move, and vice-versa.
Great for scalping sessions, indices, FX, BTC, ETH.
🔵 CONCLUSION
The Dynamic Liquidity HeatMap Profile gives traders a tactical edge by revealing where the market’s hidden liquidity resides.
It highlights where shorts and longs are positioned, identifies likely sweep zones, and marks the most attractive liquidity magnet (POC).
Use it to anticipate stop hunts, avoid getting trapped, and align with smart-money flow instead of fighting it.

Intra Bar Volume ProfileThis indicator provides a high-resolution volume profile analysis for every single bar on the chart. It builds this profile by sampling data from a lower intra-bar timeframe, allowing for a granular view of price distribution and buying/selling pressure within the bar.
Key Features:
Intra-Bar Profile Engine: For each bar on the main chart, the indicator builds a complete volume profile on a lower 'Intra-Bar Timeframe'. It uses:
Statistical Models ('Allot model'): Distributes volume across price levels using 'PDF' (Probability Density Function) or 'Classic' (close) methods.
Buy/Sell Classifiers ('Volume Estimator'): Splits volume using a 'Dynamic' (trend/wick-based) or 'Classic' (candle color) model.
On-Chart Visualization (Overlay): The analysis is rendered directly onto the price bars:
Point of Control (POC): A line showing the price level with the most volume for that bar.
Value Area (VA): A colored box representing the price range where the specified percentage (e..g., 50%) of volume was traded.
VWAP: Displays the volume-weighted average price (VWAP) for the bar as a separate line.
Integrated Alerts: Includes 8 alerts that trigger when the main price crosses over or under the key intra-bar levels: POC, VWAP, and the Value Area High/Low.
Caution: Real-Time Data Behavior (Intra-Bar Repainting) This indicator uses high-resolution intra-bar data. As a result, the values on the current, unclosed bar (the real-time bar) will update dynamically as new intra-bar data arrives. This behavior is normal and necessary for this type of analysis. Signals should only be considered final after the main chart bar has closed.
DISCLAIMM
For Informational/Educational Use Only: This indicator is provided for informational and educational purposes only. It does not constitute financial, investment, or trading advice, nor is it a recommendation to buy or sell any asset.
Use at Your Own Risk: All trading decisions you make based on the information or signals generated by this indicator are made solely at your own risk.
No Guarantee of Performance: Past performance is not an indicator of future results. The author makes no guarantee regarding the accuracy of the signals or future profitability.
No Liability: The author shall not be held liable for any financial losses or damages incurred directly or indirectly from the use of this indicator.
Signals Are Not Recommendations: The alerts and visual signals (e.g., crossovers) generated by this tool are not direct recommendations to buy or sell. They are technical observations for your own analysis and consideration.

Market Structure Volume ProfileThis indicator visualizes volume profiles that are dynamically anchored to market structure events, rather than fixed time intervals. It builds these profiles using high-resolution intra-bar data to provide a precise view of where value is established during critical market phases.
Key Features:
Event-Based Profile Anchoring: The indicator starts a new profile based on one of three user-selected events ('Profile Anchor'):
Swing: A new profile begins when the 'impulse baseline' (derived from intra-bar delta) changes. This baseline adjusts when a new price pivot is confirmed: When a price high forms, the baseline moves to the lower of its previous level or the peak delta (max of delta O/C) at the pivot. When a price low forms, it moves to the higher of its previous level or the trough delta (min of delta O/C) at the pivot.
Structure: A new profile begins immediately on the bar that confirms a market structure break (e.g., a new HH or LL, based on a sequence of price pivots).
Delta: A new profile begins immediately on the bar that confirms a break in the cumulative delta's market structure (e.g., a new HH or LL in the delta). Both 'Swing' and 'Delta' anchors are derived from the same continuous (non-resetting) Cumulative Volume Profile Delta (CVPD), which is built from the intra-bar statistical analysis.
Statistical Profile Engine: For each bar in the anchored period, the indicator builds a volume profile on a lower 'Intra-Bar Timeframe'. Instead of simple tick counting, it uses advanced statistical models:
Allocation ('Allot model'): 'PDF' (Probability Density Function) distributes volume proportionally across the bar's range based on an assumed statistical model (e.g., T4-Skew). 'Classic' assigns all volume to the close.
Buy/Sell Split ('Volume Estimator'): 'Dynamic' applies a model that analyzes candle wicks and recent trend to estimate buy/sell pressure. 'Classic' classifies all volume based on the candle color.
Visualization & Lag: The indicator plots the final profile (as a polygon) and the developing statistical lines (POC, VA, VWAP, StdDev).
Note on Lag: All anchor events require Pivot Right Bars for confirmation.
In 'Structure' and 'Delta' mode, the developing lines (POC, VA, etc.) are plotted using a non-repainting method (showing the value from pivRi bars ago).
In 'Swing' mode, the profile is plotted retroactively, starting from the bar where the pivot occurred. The developing lines are also plotted with this full pivRi lag to align with the past data.
Flexible Display Modes: The finalized profile can be displayed in three ways: 'Up/Down' (buy vs. sell), 'Total' (combined volume), and 'Delta' (net difference).
Dynamic Row Sizing: Includes an option ('Rows per Percent') to automatically adjust the number of profile rows (buckets) based on the profile's price range.
Integrated Alerts: Includes 13 alerts that trigger for:
A new profile reset ('Profile was resetted').
Price crossing any of the 6 developing levels (POC, VA High/Low, VWAP, StdDev High/Low).
Alert Lag Assumption: In 'Swing' mode, alerts are delayed to match the retroactively plotted lines. In 'Structure' and 'Delta' modes, alerts fire in real-time based on the current price crossing the current (repainting) value of the metric, which may differ from the non-repainting plotted line.
Caution: Real-Time Data Behavior (Intra-Bar Repainting) This indicator uses high-resolution intra-bar data. As a result, the values on the current, unclosed bar (the real-time bar) will update dynamically as new intra-bar data arrives. This includes the values used for real-time alerts in 'Structure' and 'Delta' modes.
DISCLAIMER
For Informational/Educational Use Only: This indicator is provided for informational and educational purposes only. It does not constitute financial, investment, or trading advice, nor is it a recommendation to buy or sell any asset.
Use at Your Own Risk: All trading decisions you make based on the information or signals generated by this indicator are made solely at your own risk.
No Guarantee of Performance: Past performance is not an indicator of future results. The author makes no guarantee regarding the accuracy of the signals or future profitability.
No Liability: The author shall not be held liable for any financial losses or damages incurred directly or indirectly from the use of this indicator.
Signals Are Not Recommendations: The alerts and visual signals (e.g., crossovers) generated by this tool are not direct recommendations to buy or sell. They are technical observations for your own analysis and consideration.

Periodic Volume ProfileThis indicator visualizes volume profiles that are dynamically anchored to market structure events, rather than fixed time intervals. It builds these profiles using high-resolution intra-bar data to provide a precise view of where value is established during critical market phases.
Key Features:
Event-Based Profile Anchoring: The indicator starts a new profile based on one of three user-selected events ('Profile Anchor'):
Swing: A new profile begins when the 'impulse baseline' (derived from delta) changes. This baseline adjusts when a new price pivot is confirmed: When a price high forms, the baseline moves to the lower of its previous level or the peak delta (max of delta O/C) at the pivot. When a price low forms, it moves to the higher of its previous level or the trough delta (min of delta O/C).
Structure: A new profile begins immediately on the bar that confirms a market structure break (e.g., a new HH or LL, based on a sequence of price pivots).
Delta: A new profile begins immediately on the bar that confirms a break in the cumulative delta's market structure (e.g., a new HH or LL in the delta).
Statistical Profile Engine: For each bar in the anchored period, the indicator builds a volume profile on a lower 'Intra-Bar Timeframe'. It uses:
Statistical Models ('Allot model'): Distributes volume across price levels using 'PDF' (Probability Density Function) or 'Classic' (close) methods.
Buy/Sell Classifiers ('Volume Estimator'): Splits volume using a 'Dynamic' (trend/wick-based) or 'Classic' (candle color) model.
Note on Anchor Lag: The different anchor types have different delays. 'Structure' and 'Delta' profiles begin in real-time on the confirmation bar. The 'Swing' profile calculation is plotted retroactively to the pivot's origin, as the pivot is only confirmed Pivot Right Bars after it occurs.
Flexible Visualization Modes: The finalized profile (plotted at the end of each period) can be displayed in three ways: 'Up/Down' (buy vs. sell), 'Total' (combined volume), and 'Delta' (net difference).
Developing Real-Time Metrics: The indicator plots the developing Point of Control (POC), Value Area (VA), VWAP, and Standard Deviation bands in real-time as the new profile forms.
Dynamic Row Sizing: Includes an option ('Rows per Percent') to automatically adjust the number of profile rows (buckets) based on the profile's price range, maintaining a consistent visual density.
Integrated Alerts: Includes 13 alerts that trigger for:
A new profile reset ('Profile was resetted').
Price crossing any of the 6 developing levels (POC, VA High/Low, VWAP, StdDev High/Low).
Caution: Real-Time Data Behavior (Intra-Bar Repainting) This indicator uses high-resolution intra-bar data. As a result, the values on the current, unclosed bar (the real-time bar) will update dynamically as new intra-bar data arrives. This behavior is normal and necessary for this type of analysis. Signals should only be considered final after the main chart bar has closed.
DISCLAIMER
For Informational/Educational Use Only: This indicator is provided for informational and educational purposes only. It does not constitute financial, investment, or trading advice, nor is it a recommendation to buy or sell any asset.
Use at Your Own Risk: All trading decisions you make based on the information or signals generated by this indicator are made solely at your own risk.
No Guarantee of Performance: Past performance is not an indicator of future results. The author makes no guarantee regarding the accuracy of the signals or future profitability.
No Liability: The author shall not be held liable for any financial losses or damages incurred directly or indirectly from the use of this indicator.
Signals Are Not Recommendations: The alerts and visual signals (e.g., crossovers) generated by this tool are not direct recommendations to buy or sell. They are technical observations for your own analysis and consideration.

Pivot Orderflow DeltaThis indicator analyzes order flow by calculating a continuous Cumulative Volume Profile Delta (CVPD). It plots this delta as a series of "delta candles" and identifies divergences and structural pivot levels.
Key Features:
Statistical Delta Engine: For each bar, the indicator builds a high-resolution volume profile on a lower 'Intra-Bar Timeframe'. It uses statistical models ('PDF' allocation) and advanced classifiers ('Dynamic' split) to determine the buy/sell pressure, which is then accumulated.
Cumulative Delta Candle Visualization: The indicator plots the continuous, accumulated delta as a series of candles, where for each bar:
Open: Is the cumulative delta value of the previous bar.
Close: Is the new total cumulative delta.
High/Low: Represent the peak/trough cumulative delta reached during that bar's formation.
Dynamic Pivot Baseline: The indicator plots a separate dynamic baseline ('Impulse Start') that adjusts when a new price pivot is confirmed.
When a price high forms, the baseline moves to the lower of its previous level or the peak delta (max of delta candle O/C) at the pivot.
When a price low forms, the baseline moves to the higher of its previous level or the trough delta (min of delta candle O/C) at the pivot.
Full Divergence Suite (Class A, B, C): A built-in divergence engine automatically detects and plots Regular (A), Hidden (B), and Exaggerated (C) divergences between price and the peak/trough of the delta candles (High/Low).
Detailed Pivot Confluence: The indicator plots distinct markers to differentiate between pivots occurring only on the price chart, only on the delta oscillator, or on both simultaneously.
Note on Confirmation (Lag): Divergence and pivot signals rely on a confirmation method. A pivot is only plotted after the Pivot Right Bars input has passed, which introduces an inherent lag.
Integrated Alerts: Includes 23 comprehensive alerts for:
The start and end of all 6 divergence types.
The detection of a new Impulse Start pivot.
Delta/volume agreement/disagreement.
Delta crossing the zero line.
The formation of price-only or delta-only pivots.
Caution: Real-Time Data Behavior (Intra-Bar Repainting) This indicator uses high-resolution intra-bar data. As a result, the values on the current, unclosed bar (the real-time bar) will update dynamically as new intra-bar data arrives. This behavior is normal and necessary for this type of analysis. Signals should only be considered final after the main chart bar has closed.
DISCLAIMER
For Informational/Educational Use Only: This indicator is provided for informational and educational purposes only. It does not constitute financial, investment, or trading advice, nor is it a recommendation to buy or sell any asset.
Use at Your Own Risk: All trading decisions you make based on the information or signals generated by this indicator are made solely at your own risk.
No Guarantee of Performance: Past performance is not an indicator of future results. The author makes no guarantee regarding the accuracy of the signals or future profitability.
No Liability: The author shall not be held liable for any financial losses or damages incurred directly or indirectly from the use of this indicator.
Signals Are Not Recommendations: The alerts and visual signals (e.g., crossovers) generated by this tool are not direct recommendations to buy or sell. They are technical observations for your own analysis and consideration.

Cumulative Volume Profile DeltaThis indicator calculates the Cumulative Volume Profile Delta (CVPD). It constructs a high-resolution volume profile for each bar using intra-bar data, then derives and accumulates the delta from that profile to show net buying/selling pressure.
Key Features:
Statistical Volume Profile Engine: For each bar, the indicator builds a high-resolution volume profile on a lower 'Intra-Bar Timeframe'. Instead of simple tick counting, it uses statistical models ('PDF' allocation) to distribute volume across price levels and advanced classifiers ('Dynamic' split) to determine the buy/sell pressure before accumulation.
Periodic Accumulation: The CVPD accumulation is anchored to a user-defined 'Anchor Timeframe' (e.g., daily, weekly). This cyclical reset allows to analyze the build-up of pressure within specific trading periods.
"Delta Candle" Visualization: The periodic CVPD is shown as a candle, where:
Open: The CVPD value at the start of the period (or zero).
High/Low: Represent the peak buying (CVD High) and selling (CVD Low) pressure within that period's profile.
Close: The final net delta value (CVD) for the period.
Dual CVD & Divergence Engine: The indicator calculates two CVPDs: a Periodic one (for plotting) and a Continuous one (non-resetting). The continuous line is used as a stable source for the built-in divergence engine (detecting Regular, Hidden, and Exaggerated).
Dynamic Divergence Plotting: Divergence markers are plotted relative to the periodic (candle) CVPD. They automatically adjust their vertical position after a reset to remain visually aligned with the plotted candles.
Note on Confirmation (Lag): Divergence signals rely on a pivot confirmation method to ensure they do not repaint.
The Start of a- divergence is only detected after the confirming pivot is fully formed (a delay based on Pivot Right Bars).
The End of a divergence is detected either instantly (if the signal is invalidated by price action) or with a delay (when a new, non-divergent pivot is confirmed).
Multi-Timeframe (MTF) Capability:
MTF Output: The entire analysis (Delta Candles, Divergences) can be calculated on a higher timeframe (using the Timeframe input), with standard options to handle gaps (Fill Gaps) and prevent repainting (Wait for...).
Limitation: The Divergence detection engine (pivDiv) is disabled if a Higher Timeframe (HTF) is selected.
Integrated Alerts: Includes 18 comprehensive alerts for:
The start and end of all 6 divergence types.
The periodic CVPD crossing the zero line.
Conditions of agreement or disagreement between the delta and the main bar's direction.
Caution: Real-Time Data Behavior (Intra-Bar Repainting) This indicator uses high-resolution intra-bar data. As a result, the values on the current, unclosed bar (the real-time bar) will update dynamically as new intra-bar data arrives. This behavior is normal and necessary for this type of analysis. Signals should only be considered final after the main chart bar has closed.
DISCLAIMER
For Informational/Educational Use Only: This indicator is provided for informational and educational purposes only. It does not constitute financial, investment, or trading advice, nor is it a recommendation to buy or sell any asset.
Use at Your Own Risk: All trading decisions you make based on the information or signals generated by this indicator are made solely at your own risk.
No Guarantee of Performance: Past performance is not an indicator of future results. The author makes no guarantee regarding the accuracy of the signals or future profitability.
No Liability: The author shall not be held liable for any financial losses or damages incurred directly or indirectly from the use of this indicator.
Signals Are Not Recommendations: The alerts and visual signals (e.Example: crossovers) generated by this tool are not direct recommendations to buy or sell. They are technical observations for your own analysis and consideration.
