KIMATIX LITE Delta ProfileThis indicator provides a clean, market-structure view of where participation concentrates and which side is in control across price levels.
The Lite version is intentionally reduced to focus on context over execution while keeping the visual identity of the full profile.
What is shown
Sentiment Profile (right side)
Displays directional dominance at each price level:
Bullish rows when buying pressure dominates
Bearish rows when selling pressure dominates
Point of Control (POC)
Value Area High / Low (VAH / VAL)
Lite Version
No left-side volume profile
No delta labels or historical delta tracking
No lower-timeframe or orderflow proxy
No alerts or event notifications
No visible-range logic or advanced controls
All calculations run on the chart timeframe only, making this version lighter and suitable for public use while preserving structural relevance.
Intended use
This indicator is designed to:
Identify high-interest price zones
Assess directional pressure at each level
Support bias and location decisions
Complement other execution or confirmation tools
It is not an entry or signal system and does not provide trade timing.
The full version is distributed separately.
More information can be found here:
whop.com
Volumeprofileanalysis

Multi-Distribution Volume Profile (Zeiierman)█ Overview
Multi-Distribution Volume Profile (Zeiierman) is a flexible, structure-first volume profile tool that lets you reshape how volume is distributed across price, from classic uniform profiles to advanced statistical curves like Gaussian, Lognormal, Student-t, and more.
Instead of forcing every market into a single "one-size-fits-all" profile, this tool lets you model how volume is likely concentrated inside each bar (body vs wicks, midpoint, tails, center bias, right-skew, heavy tails, etc.) and then stacks that behavior across a whole lookback window to build a rich, multi-distribution map of traded activity.
On top of that, it overlays a dynamic Center Band (value area) and a fade/gradient model that can color each price row by volume, hits, recency, volatility, reversals, or even liquidity voids, turning a plain profile into a multi-dimensional context map.
Highlights
Choose from multiple Profile Build Modes , including uniform, body-only, wick-only, midpoint/close/open, center-weighted, and a suite of probability-style distributions (Gaussian, Lognormal, Weibull, Student-t, etc.)
Flexible anchor layout: draw the profile on Right/Left (horizontal) or Bottom/Top (vertical) to fit any chart layout
Value Area / Center Band computed from volume quantiles around the POC.
Gradient-based Fade Metrics: volume, price hits, freshness (time decay), volatility impact, dwell time, reversal density, compression, and liquidity voids
Separate bullish vs bearish volume at each price row for directional structure insights
█ How It Works
⚪ Profile Construction
The script scans a user-defined Bars Included window and finds the full high–low span of that zone. It then divides this range into a user-controlled number of Price Levels (rows).
For each historical bar within the window:
It measures the candle’s price range, body, and wicks.
It assigns volume to rows according to the selected Profile Build Mode, for example:
* Range Uniform – volume spread evenly across the full high–low range.
* Range Body Only / Range Wick Only – concentrate volume inside the body or wicks only.
* Midpoint / Close / Open Only – allocate volume entirely into one price row (pinpoint modeling).
HL2 / Body Center Weighted – center weights around the middle of the range/body.
Recent-Weighted Volume – amplify newer bars using exponential time decay.
Volume Squared (Hard) – aggressively boost bars with large volume.
Up Bars Only / Down Bars Only – filter volume to only bullish or bearish bars.
For more advanced shapes, the script uses continuous distributions across the bar’s span:
Linear, Triangular, Exponential to High
Cosine Centered, PERT
Gaussian, Lognormal, Cauchy, Laplace
Pareto, Weibull, Logistic, Gumbel
Gamma, Beta, Chi-Square, Student-t, F-Shape
Each distribution produces a weight for each row within the bar’s range, normalized so the total volume remains consistent, but the shape of where that volume lands changes.
⚪ POC & Center Band (Value Area)
Once all rows are accumulated:
The row with the highest total volume becomes the Point of Control (POC)
The script computes cumulative volume and finds the band that wraps a user-defined Center of Profile % (e.g., 68%) around the center of distribution.
This range is displayed as a central band, often treated like a value area where price has spent the most “effort” trading.
⚪ Gradient Fade Engine
Each row also gets a fade metric, chosen in Fade Metric:
Volume – opacity based on relative volume.
Price Hits – how frequently that row was touched.
Blended (Vol+Hits) – average of volume & hits.
Freshness – emphasizes recent activity, controlled by Decay.
Volatility Impact – rows that saw larger ranges contribute more.
Dwell Time – where price “camped” the longest.
Reversal Density – where direction changes cluster.
Compression – tight-range compression zones.
Liquidity Void – inverse of volume (thin liquidity zones).
When Apply Gradient is enabled, the row’s bullish/bearish colors are tinted from faint to strong based on this chosen metric, effectively turning the profile into a heatmap of your chosen structural property.
█ How to Use
⚪ Explore Different Distribution Assumptions
Switch between multiple Profile Build Modes to see how your assumptions about intrabar volume affect structure:
Use Range Uniform for classical profile reading.
Deploy Gaussian, Logistic, or Cosine shapes to emphasize central clustering.
Try Pareto, Lognormal, or F-Shape to focus on tail / extremal activity.
Use Recent-Weighted Volume to prioritize the most recent structural behavior.
This is especially useful for traders who want to test how different modeling assumptions change perceived value areas and levels of interest.
⚪ Identify Value, Acceptance & Rejection Zones
Use the POC and Center of Profile (%) band to distinguish:
High-acceptance zones – wide central band, thick rows, strong gradient → fair value areas
Rejection zones & tails – thin extremes, low dwell time, high volatility or reversal density
These regions can be used as:
Targets and origin zones for mean reversion
Context for breakout validation (leaving value)
Bias reference for intraday rotations or swing rotations
⚪ Read Directional Structure Within the Profile
Because each row is split into bullish vs bearish contributions, you can visually read:
Where buyers dominated a price region (large bullish slice)
Where sellers absorbed or defended (large bearish slice)
Combining this with Fade Metrics like Reversal Density, Dwell Time, or Freshness turns the profile into a structural order-flow map, without needing raw tick-by-tick volume data.
⚪ Use Fade Metrics for Contextual Heatmaps
Each Fade Metric can be used for a different analytical lens:
Volume / Blended – emphasize where volume and activity are concentrated.
Freshness – highlight the most recently active zones that still matter.
Volatility Impact & Compression – spot areas of explosive moves vs coiled ranges.
Reversal Density – locate micro turning points and battle zones.
Liquidity Void – visually pop out thin regions that may act as speedways or magnets.
█ Settings
Profile Build Mode – Selects how each bar’s volume is distributed across its price range (uniform, body/wick, midpoint/close/open, center-weighted, or statistical distribution families).
Bars Included – Number of bars used to build the profile from the current bar backward.
Price Levels – Vertical resolution of the profile: more levels = smoother but heavier.
Anchor Side – Where the profile is drawn on the chart: Right, Left, Bottom, or Top.
Offset (bars) – Horizontal offset from the last bar to the profile when using Right/Left modes.
Apply Gradient – Toggles the fade/heatmap coloring based on the selected metric.
Fade Metric – Chooses the property driving row opacity (Volume, Hits, Freshness, Volatility Impact, Dwell Time, Reversal Density, Compression, Liquidity Void).
Decay – Time-decay factor for Freshness (values close to 1 keep older activity relevant for longer).
Profile Thickness – Relative thickness of the profile along the time axis, as a % of the lookback window.
Center of Profile (%) – Volume percentage used to define the central band (value area) around the POC.
-----------------
Disclaimer
The content provided in my scripts, indicators, ideas, algorithms, and systems is for educational and informational purposes only. It does not constitute financial advice, investment recommendations, or a solicitation to buy or sell any financial instruments. I will not accept liability for any loss or damage, including without limitation any loss of profit, which may arise directly or indirectly from the use of or reliance on such information.
All investments involve risk, and the past performance of a security, industry, sector, market, financial product, trading strategy, backtest, or individual's trading does not guarantee future results or returns. Investors are fully responsible for any investment decisions they make. Such decisions should be based solely on an evaluation of their financial circumstances, investment objectives, risk tolerance, and liquidity needs.

Volume Profile VisionVolume Profile Vision - Complete Description
Overview
Volume Profile Vision (VPV) is an advanced volume profile indicator that visualizes where trading activity has occurred at different price levels over a specified time period. Unlike traditional volume indicators that show volume over time, this indicator displays volume distribution across price levels, helping traders identify key support/resistance zones, fair value areas, and potential reversal points.
What Makes This Indicator Original
Volume Profile Vision introduces several unique features not found in standard volume profile tools:
Dual-Direction Histogram Display:
Unlike conventional volume profiles that only show bars extending in one direction, VPV displays volume bars extending both left (into historical candles) and right (as a traditional histogram). This bi-directional approach allows traders to see exactly where historical price action intersected with high-volume nodes.
Real-Time Candle Highlighting: The indicator dynamically highlights volume bars that intersect with the current candle's price range, making it immediately obvious which volume levels are currently in play.
Four Professional Color Schemes: Each color scheme uses distinct gradient algorithms and visual encoding systems:
Traffic Light: Uses red (POC), green (VA boundaries), yellow (HVN), with grayscale gradients outside the value area
Aurora Glass: Modern cyan-to-magenta gradient with hot magenta POC highlighting
Obsidian Precision: Professional dark theme with white POC and electric cyan accents
Black Ice: Monochromatic cyan family with graduated intensity
Adaptive Transparency System: Automatically adjusts bar transparency based on position relative to value area, with special handling for each color scheme to maintain visual clarity.
Core Concepts & Calculations
Volume Distribution Analysis
The indicator divides the visible price range into user-defined price levels (default: 80 levels) and calculates the total volume traded at each level by:
Scanning back through the specified lookback period (customizable or visible range)
For each historical bar, determining which price levels the bar's high/low range intersects
Accumulating volume for each intersected price level
Optionally filtering by bullish/bearish volume only
Point of Control (POC)
The POC is the price level with the highest traded volume during the analyzed period. This represents the "fairest" price where most traders agreed on value. The indicator marks this with distinct coloring (red in Traffic Light, magenta in Aurora Glass, white in Obsidian Precision, cyan in Black Ice).
Trading Significance: POC acts as a strong magnet for price - markets tend to return to fair value. When price is away from POC, traders watch for:
Mean reversion opportunities when price is far from POC
Rejection signals when price tests POC from above/below
Breakout confirmation when price breaks through and holds beyond POC
Value Area (VA)
The Value Area encompasses the price range where a specified percentage (default: 68%) of all volume traded. This represents the range of "accepted value" by market participants.
Calculation Method:
Start at the POC (highest volume level)
Expand upward and downward, adding adjacent price levels
Always add the level with higher volume next
Continue until accumulated volume reaches the VA percentage threshold
Value Area High (VAH): Upper boundary of accepted value - acts as resistance
Value Area Low (VAL): Lower boundary of accepted value - acts as support
Trading Significance:
Price spending time inside VA indicates market equilibrium
Breakouts above VAH suggest bullish momentum shift
Breakdowns below VAL suggest bearish momentum shift
Returns to VA boundaries often provide high-probability entry zones
High Volume Nodes (HVN)
Price levels with volume exceeding a threshold percentage (default: 80%) of POC volume. These represent areas of strong agreement and consolidation.
Trading Significance:
HVNs act as strong support/resistance zones
Price tends to consolidate at HVNs before making directional moves
Breaking through an HVN often signals strong momentum
Low Volume Nodes (LVN)
Price levels within the Value Area with volume ≤30% of POC volume. These are zones price moved through quickly with minimal consolidation.
Trading Significance:
LVNs represent areas of rejection - price finds little acceptance
Price tends to move rapidly through LVN zones
Useful for setting stop-losses (below LVN for longs, above for shorts)
Can identify potential gaps or "air pockets" in the market structure
Grayscale POC Detection
A secondary POC detection system identifies the highest volume level outside the Value Area (with a 2-level buffer to avoid confusion). This helps identify significant volume accumulation zones that exist beyond the main value area.
How to Use This Indicator
Setup
Choose Lookback Period:
Enable "Use Visible Range" to analyze only what's on your chart
Or set "Fixed Range Lookback Depth" (default: 200 bars) for consistent analysis
Adjust Profile Resolution:
"Number of Price Levels" (default: 80) - higher = more granular analysis, lower = broader zones
Select Color Scheme:
Traffic Light: Best for clear POC/VA/HVN identification
Aurora Glass: Modern aesthetic for dark charts
Obsidian Precision: Professional trader preference
Black Ice: Minimalist single-color family
Visual Customization
Left Extension: How far back the left-side histogram extends into historical candles (default: 490 bars)
Right Extension: Width of the traditional histogram bars on the right (default: 50 bars)
Right Margin: Space between current price bar and histogram (default: 0 for flush alignment)
Left Profile Gap: Space between left-side histogram and candles (default: 0)
Trading Strategies
Strategy 1: Value Area Mean Reversion
Wait for price to move outside the Value Area (above VAH or below VAL)
Look for rejection signals (wicks, bearish/bullish candles)
Enter trades toward the POC
Take profits as price returns to POC or opposite VA boundary
Strategy 2: Breakout Confirmation
Identify when price is consolidating within the Value Area
Wait for a strong close above VAH (bullish) or below VAL (bearish)
Enter on the breakout or on first pullback to the VA boundary
Target previous HVNs or swing highs/lows outside the VA
Strategy 3: POC Support/Resistance
Watch for price approaching the POC level
If approaching from below, look for bullish reversal patterns at POC (support)
If approaching from above, look for bearish reversal patterns at POC (resistance)
Trade in the direction of the bounce with stops beyond the POC
Strategy 4: LVN Fast Movement Zones
Identify LVN zones within the Value Area (marked with "LVN" label)
When price enters an LVN, expect rapid movement through the zone
Avoid entering trades within LVNs
Use LVNs as confirmation of directional momentum
Alert System
The indicator includes 7 customizable alert conditions:
POC Touch: Alerts when price comes within 0.5 ATR of POC
VAH/VAL Touch: Alerts at Value Area boundaries
VA Breakout: Alerts on breakouts above VAH or below VAL
HVN Touch: Alerts when price contacts High Volume Nodes
LVN Entry: Alerts when entering Low Volume zones
POC Shift: Alerts when POC moves to a new price level
Reading the Profile
Price Labels (shown on the right side):
POC: Point of Control - highest volume price level
VAH: Value Area High - upper boundary of accepted value
VAL: Value Area Low - lower boundary of accepted value
LVN: Low Volume Node - expect fast movement through this zone
Color Intensity Interpretation:
Brighter colors = higher volume concentration
Dimmer colors = lower volume
Abrupt color changes = transition between volume zones
Gaps in the histogram = price levels with no trading activity
Technical Details
Volume Accumulation Logic:
For each bar in lookback period:
For each price level:
If bar's high/low range intersects price level:
Add bar's volume to that price level's total
Gradient Algorithm:
Traffic Light: Dual-range piecewise gradient (0-50% and 50-100% volume intensity)
Aurora Glass: Linear cyan-to-magenta interpolation
Obsidian Precision: Dark blue gradient with cyan highlights
Black Ice: Three-stage cyan intensity progression
Real-Time Updates:
The profile recalculates on every bar, including real-time tick data, ensuring the volume distribution always reflects current market structure.
Best Practices
Timeframe Selection: Use higher timeframes (4H, Daily) for swing trading, lower timeframes (5min, 15min) for day trading
Combine with Price Action: Volume profile shows WHERE, price action shows WHEN
Multiple Timeframe Analysis: Check daily VP for major levels, then drill down to intraday for entries
Volume Type Selection: Use "Bullish" volume in uptrends, "Bearish" in downtrends, or "Both" for complete picture
Adjust VA Percentage: 68% (default) captures one standard deviation; try 70% for tighter or 60% for broader value areas
Performance Notes
Maximum bars back: 5000 (handles deep historical analysis)
Maximum boxes: 500 (handles complex profiles)
Optimized calculation: Only recalculates on last bar for efficiency
Real-time capable: Updates as new ticks arrive

Volume essential parameters overlayVolume EPO – Essential Volume Parameters Overlay
1. Motivation and design philosophy
Volume EPO is designed as a conceptual overlay rather than a self contained trading system. The main idea behind this script is to take complex, foundational market concepts out of heavy, menu driven strategies and express them as lightweight, independent layers that sit on top of any chart or indicator.
In many TradingView scripts, a single strategy tries to handle everything at once: signal logic, risk settings, visual cues, multi timeframe controls, and conceptual explanations. This usually leads to long input menus, performance issues, and difficult maintenance. The architectural approach behind Volume EPO is the opposite: keep the core strategy lean, and move the explanation and measurement of key concepts into dedicated overlays.
In this framework, Volume EPO is the base layer for the concept of volume. It does not decide anything about entries or exits. Instead, it exposes and clarifies how different definitions of volume behave candle by candle. Other layers or strategies can then build on top of this understanding.
2. What Volume EPO does
Volume EPO focuses on four essential volume parameters for each bar:
- Buy volume - Sell volume - Total volume - Delta volume (the difference between buy and sell volume)
The script presents these parameters in a compact heads up display (HUD) table that can be positioned anywhere on the chart. It is designed to be visually minimal, language aware, and usable on top of any other indicator or price action without cluttering the view.
The indicator does not output signals, alerts, arrows, or strategy entries. It is a descriptive and educational tool that shows how volume is distributed, not a prescriptive tool that tells the trader what to do.
3. Two definitions of volume
A central theme of this script is that there is more than one way to define and interpret “volume” inside a single candle. Volume EPO implements and clearly separates two different approaches:
- A geometric, candle based approximation that uses only OHLC and volume of the current bar. - An intrabar, data driven definition that uses lower timeframe up and down volume when it is available.
The user can switch between these modes via the calculation method input. The mode is prominently shown inside the on chart table so that the context is always explicit.
3.1 Geometry mode (Source File, approximate)
In Geometry mode, Volume EPO works only with the current bar’s OHLC values and total volume. No lower timeframe data is required.
The candle’s range is defined as high minus low. If the range is positive, the position of the close inside that range is used as a simple model for how volume might have been distributed between buyers and sellers:
- The closer the close is to the high, the more of the total volume is attributed to the buying side. - The closer the close is to the low, the more of the total volume is attributed to the selling side. - In a rare case where the bar has no price range (for example a flat or doji bar), total volume is split evenly between buy and sell volume.
From this model, the script derives:
- Buy volume (approximated) - Sell volume (approximated) - Total volume (as reported by the bar) - Delta volume as the difference between buy and sell volume
This approach is intentionally labeled as “Geometry (Approx)” in the HUD. It is a theoretical reconstruction based solely on the candle’s geometry and total volume, and it is always available on any market or timeframe that provides OHLCV data.
3.2 Intrabar mode (Precise)
In Intrabar mode, Volume EPO uses the TradingView built in library for up and down volume on a user selected lower timeframe. Instead of inferring volume from the shape of the candle, it reads the underlying lower timeframe data when that data is accessible.
The script requests up and down volume from a lower timeframe such as 15 seconds, using the official TA library functions. The results are then interpreted as follows:
- Buy volume is taken as the absolute value of the up volume. - Sell volume is taken as the absolute value of the down volume. - Total volume is the sum of buy and sell volume. - Delta volume is provided directly by the library as the difference between up and down volume.
If valid lower timeframe data exists for a bar, the bar is counted as covered by Intrabar data. If not, that bar is marked as invalid for this precise calculation and is excluded from the covered count.
This mode is labeled “Precise” in the HUD, together with the selected lower timeframe, because it is anchored in actual intrabar data rather than in a geometric model. It provides a closer view of how buying and selling pressure unfolded inside the bar, at the cost of requiring more data and being dependent on the availability of that data.
4. Coverage, lookback, and what the numbers mean
The top part of the HUD reports not only which volume definition is active, but also an additional line that describes the effective coverage of the data.
In Intrabar (Precise) mode, the script displays:
- “Scanned: N Bars”
Here, N counts how many bars since the indicator was loaded have successfully received valid lower timeframe delta data. It is a measure of how much of the visible history has been truly covered by intrabar information, not a lookback window in the sense of a rolling calculation.
In Geometry mode, the script displays:
- “Lookback: L Bars”
In this extracted layer, the lookback value L is purely descriptive. It does not change how the current bar’s volume is computed, and it is not used in any iterative or statistical calculation inside this script. It is meant as a conceptual label, for example to keep the volume layer consistent with a broader framework where lookback length is a structural parameter.
Summarizing these two fields:
- Scanned tells you how many bars have been processed using real intrabar data. - Lookback is a descriptive parameter in Geometry mode in this specific overlay, not a direct driver of the computations.
5. The HUD layout on the chart
The on chart table is intentionally compact and structured to be read quickly:
- Header: a title identifying the overlay as Volume EPO. - Mode line: explicitly states whether the script is in Precise or Geometry mode, and for Precise mode also shows the lower timeframe used. - Coverage line: - In Precise mode, it shows “Scanned: N Bars”. - In Geometry mode, it shows “Lookback: L Bars”. - Volume block: - A line for buy and sell volume, marked with clear directional symbols. - A line for total volume and the absolute delta, accompanied by the sign of the delta. - Numeric formatting uses human friendly suffixes (for example K, M, B) to keep the display readable. - Footer: the current symbol and a time stamp, adjusted by a user selectable timezone offset so that the HUD can be aligned with the trader’s local time reference.
The table can be positioned anywhere on the chart and resized via inputs, and it supports multiple color themes and languages in order to integrate cleanly into different chart layouts.
6. How to use Volume EPO in practice
Volume EPO is meant to be read together with price action and other tools, not in isolation. Typical uses include:
- Studying how often a strong directional candle is actually supported by dominant buy or sell volume. - Comparing the behavior of delta volume between Geometry and Intrabar definitions. - Building a personal intuition for how intrabar data refines or contradicts the simple candle based approximation. - Feeding these insights into separate, lean strategy scripts that do not need to carry the full explanatory logic of volume inside them.
Because it is an overlay layer, Volume EPO can be stacked with other custom indicators without adding new signals or complexity to their logic. It simply adds a clear and consistent view of volume behavior on top of whatever the trader is already watching.
7. Educational and non signalling nature
Finally, it is important to stress that Volume EPO is not a trading system, not a signal generator, and not financial advice. The script does not tell the user when to enter or exit. It only reports how different definitions of volume describe the current bar.
Deciding whether to trade, how to trade, and which risk parameters to use remains entirely with the user and with their own strategy. Volume EPO provides context and clarity around the concept of volume so that those decisions can be informed by a better understanding of how buying and selling pressure is structured inside each candle.
Note: Even on lower timeframes, every reconstruction of volume remains an approximation, except at the true single tick level. However, the closer the chosen lower timeframe is to a one tick stream, the more accurately it can reflect the underlying order flow and balance between buying and selling pressure.

Low Volatility Profiles [BigBeluga]🔵 OVERVIEW
Low Volatility Profiles is a market compression and breakout-anticipation tool that identifies phases of low volatility using ADX and then builds a real-time volume profile inside the detected range.
This helps traders spot accumulation/distribution zones and prepare for explosive moves when volatility expands.
When volatility is low ➜ price coils ➜ volume organizes ➜ breakouts become highly actionable.
This tool visualizes that process with dynamic range boxes + volume bins + PoC extension.
🔵 CONCEPTS
Low-Volatility Detection — Uses ADX threshold & cross logic to define volatility contraction regimes.
Range Construction — Draws a price box that expands with highs/lows during the compression phase.
Micro Volume Profile — Builds a volume histogram inside the range using bins (micro volume nodes).
Delta Calculation — Tracks positive vs negative volume to gauge buyer/seller pressure within range.
Point of Control (PoC) — Highlights the price level with max traded volume inside the range.
PoC Extension — Optionally extends PoC into future bars to show potential reaction zone after breakout.
Breakout Validation — Ends the profile zone when price breaks above or below the modeled range.
Noise Removal — Automatically removes invalid or small ranges to prevent chart clutter.
This tool turns consolidation into actionable structure by exposing where smart money accumulates before trending moves.
🔵 FEATURES
ADX-Driven Range Detection — Identify when market transitions into low-volatility compression.
Configurable ADX Threshold — Set sensitivity for contraction zones.
Cross-Type Option — Detect low volatility via cross under / crossover logic.
Dynamic Range Box — Expands live with price as contraction unfolds.
Micro Volume Profile (Bins) — Distributes volume across bins inside range for micro POC mapping.
Volume Delta Visualization — Shows imbalance inside consolidation (accumulation vs distribution).
Real-Time PoC Highlight — Instantly shows most traded price inside the compression.
PoC Extension Mode — Extend PoC forward to project reaction levels post-breakout.
Clean Auto-Reset Logic — Removes boxes if range invalid or breakout occurs too fast.
Optional Filled Boxes — Heatmap-style profile visualization inside range body.
ADX Line + Threshold Plot — Visual assistance for volatility state monitoring.
🔵 HOW TO USE
Identify Accumulation Zones — When price enters low-volatility ADX condition and profile builds.
Watch the PoC — PoC acts as battle zone; move above/below can signal initiator strength.
Breakout Strategy — Trade break above/below the range after compression.
Mean Reversion Inside Range — Fade edges while price remains inside compression box.
Combine With Trend Tools — Use trend confirmation (MA/EMA/Flow indicators) after breakout.
Use Delta Clues — Positive delta tilt suggests accumulation; negative suggests distribution.
Monitor Range Size — Longer build + high PoC volume = stronger potential breakout energy.
🔵 CONCLUSION
Low Volatility Profiles isolates accumulation phases and maps volume concentration before volatility expansion.
By combining ADX compression, micro volume distribution, and PoC tracing, traders gain an edge in anticipating powerful breakout cycles and institutional positioning.
Trade the quiet moment before the storm — where smart money prepares the move, and the real opportunity emerges.

Liquidity Void Zone Detector [PhenLabs]📊 Liquidity Void Zone Detector
Version: PineScript™v6
📌 Description
The Liquidity Void Zone Detector is a sophisticated technical indicator designed to identify and visualize areas where price moved with abnormally low volume or rapid momentum, creating "voids" in market liquidity. These zones represent areas where insufficient trading activity occurred during price movement, often acting as magnets for future price action as the market seeks to fill these gaps.
Built on PineScript v6, this indicator employs a dual-detection methodology that analyzes both volume depletion patterns and price movement intensity relative to ATR. The revolutionary 3D visualization system uses three-layer polyline rendering with adaptive transparency and vertical offsets, creating genuine depth perception where low liquidity zones visually recede and high liquidity zones protrude forward. This makes critical market structure immediately apparent without cluttering your chart.
🚀 Points of Innovation
Dual detection algorithm combining volume threshold analysis and ATR-normalized price movement sensitivity for comprehensive void identification
Three-layer 3D visualization system with progressive transparency gradients (85%, 78%, 70%) and calculated vertical offsets for authentic depth perception
Intelligent state machine logic that tracks consecutive void bars and only renders zones meeting minimum qualification requirements
Dynamic strength scoring system (0-100 scale) that combines inverted volume ratios with movement intensity for accurate void characterization
Adaptive ATR-based spacing calculation that automatically adjusts 3D layering depth to match instrument volatility
Efficient memory management system supporting up to 100 simultaneous void visualizations with automatic array-based cleanup
🔧 Core Components
Volume Analysis Engine: Calculates rolling volume averages and compares current bar volume against dynamic thresholds to detect abnormally thin trading conditions
Price Movement Analyzer: Normalizes bar range against ATR to identify rapid price movements that indicate liquidity exhaustion regardless of instrument or timeframe
Void Tracking State Machine: Maintains persistent tracking of void start bars, price boundaries, consecutive bar counts, and cumulative strength across multiple bars
3D Polyline Renderer: Generates three-layer rectangular polylines with precise timestamp-to-bar index conversion and progressive offset calculations
Strength Calculation System: Combines volume component (inverted ratio capped at 100) with movement component (ATR intensity × 30) for comprehensive void scoring
🔥 Key Features
Automatic Void Detection: Continuously scans price action for low volume conditions or rapid movements, triggering void tracking when thresholds are exceeded
Real-Time Visualization: Creates 3D rectangular zones spanning from void initiation to termination, with color-coded depth indicating liquidity type
Adjustable Sensitivity: Configure volume threshold multiplier (0.1-2.0x), price movement sensitivity (0.5-5.0x), and minimum qualifying bars (1-10) for customized detection
Dual Color Coding: Separate visual treatment for low liquidity voids (receding red) and high liquidity zones (protruding green) based on 50-point strength threshold
Optional Compact Labels: Toggle LV (Low Volume) or HV (High Volume) circular labels at void centers for quick identification without visual clutter
Lookback Period Control: Adjust analysis window from 5 to 100 bars to match your trading timeframe and market volatility characteristics
Memory-Efficient Design: Automatically manages polyline and label arrays, deleting oldest elements when user-defined maximum is reached
Data Window Integration: Plots void detection binary, current strength score, and average volume for detailed analysis in TradingView's data window
🎨 Visualization
Three-Layer Depth System: Each void is rendered as three stacked polylines with progressive transparency (85%, 78%, 70%) and calculated vertical offsets creating authentic 3D appearance
Directional Depth Perception: Low liquidity zones recede with back layer most transparent; high liquidity zones protrude with front layer most transparent for instant visual differentiation
Adaptive Offset Spacing: Vertical separation between layers calculated as ATR(14) × 0.001, ensuring consistent 3D effect across different instruments and volatility regimes
Color Customization: Fully configurable base colors for both low liquidity zones (default: red with 80 transparency) and high liquidity zones (default: green with 80 transparency)
Minimal Chart Clutter: Closed polylines with matching line and fill colors create clean rectangular zones without unnecessary borders or visual noise
Background Highlight: Subtle yellow background (96% transparency) marks bars where void conditions are actively detected in real-time
Compact Labeling: Optional tiny circular labels with 60% transparent backgrounds positioned at void center points for quick reference
📖 Usage Guidelines
Detection Settings
Lookback Period: Default: 10 | Range: 5-100 | Number of bars analyzed for volume averaging and void detection. Lower values increase sensitivity to recent changes; higher values smooth detection across longer timeframes. Adjust based on your trading timeframe: short-term traders use 5-15, swing traders use 20-50, position traders use 50-100.
Volume Threshold: Default: 1.0 | Range: 0.1-2.0 (step 0.1) | Multiplier applied to average volume. Bars with volume below (average × threshold) trigger void conditions. Lower values detect only extreme volume depletion; higher values capture more moderate low-volume situations. Start with 1.0 and decrease to 0.5-0.7 for stricter detection.
Price Movement Sensitivity: Default: 1.5 | Range: 0.5-5.0 (step 0.1) | Multiplier for ATR-normalized price movement detection. Values above this threshold indicate rapid price changes suggesting liquidity voids. Increase to 2.0-3.0 for volatile instruments; decrease to 0.8-1.2 for ranging or low-volatility conditions.
Minimum Void Bars: Default: 10 | Range: 1-10 | Minimum consecutive bars exhibiting void conditions required before visualization is created. Filters out brief anomalies and ensures only sustained voids are displayed. Use 1-3 for scalping, 5-10 for intraday trading, 10+ for swing trading to match your time horizon.
Visual Settings
Low Liquidity Color: Default: Red (80% transparent) | Base color for zones where volume depletion or rapid movement indicates thin liquidity. These zones recede visually (back layer most transparent). Choose colors that contrast with your chart theme for optimal visibility.
High Liquidity Color: Default: Green (80% transparent) | Base color for zones with relatively higher liquidity compared to void threshold. These zones protrude visually (front layer most transparent). Ensure clear differentiation from low liquidity color.
Show Void Labels: Default: True | Toggle display of compact LV/HV labels at void centers. Disable for cleaner charts when trading; enable for analysis and review to quickly identify void types across your chart.
Max Visible Voids: Default: 50 | Range: 10-100 | Maximum number of void visualizations kept on chart. Each void uses 3 polylines, so setting of 50 maintains 150 total polylines. Higher values preserve more history but may impact performance on lower-end systems.
✅ Best Use Cases
Gap Fill Trading: Identify unfilled liquidity voids that price frequently returns to, providing high-probability retest and reversal opportunities when price approaches these zones
Breakout Validation: Distinguish genuine breakouts through established liquidity from false breaks into void zones that lack sustainable volume support
Support/Resistance Confluence: Layer void detection over key horizontal levels to validate structural integrity—levels within high liquidity zones are stronger than those in voids
Trend Continuation: Monitor for new void formation in trend direction as potential continuation zones where price may accelerate due to reduced resistance
Range Trading: Identify void zones within consolidation ranges that price tends to traverse quickly, helping to avoid getting caught in rapid moves through thin areas
Entry Timing: Wait for price to reach void boundaries rather than entering mid-void, as voids tend to be traversed quickly with limited profit-taking opportunities
⚠️ Limitations
Historical Pattern Indicator: Identifies past liquidity voids but cannot predict whether price will return to fill them or when filling might occur
No Volume on Forex: Indicator uses tick volume for forex pairs, which approximates but doesn't represent true trading volume, potentially affecting detection accuracy
Lagging Confirmation: Requires minimum consecutive bars (default 10) before void is visualized, meaning detection occurs after void formation begins
Trending Market Behavior: Strong trends driven by fundamental catalysts may create voids that remain unfilled for extended periods or permanently
Timeframe Dependency: Detection sensitivity varies significantly across timeframes; settings optimized for one timeframe may not perform well on others
No Directional Bias: Indicator identifies liquidity characteristics but provides no predictive signal for price direction after void detection
Performance Considerations: Higher max visible void settings combined with small minimum void bars can generate numerous visualizations impacting chart rendering speed
💡 What Makes This Unique
Industry-First 3D Visualization: Unlike flat volume or liquidity indicators, the three-layer rendering with directional depth perception provides instant visual hierarchy of liquidity quality
Dual-Mode Detection: Combines both volume-based and movement-based detection methodologies, capturing voids that single-approach indicators miss
Intelligent Qualification System: State machine logic prevents premature visualization by requiring sustained void conditions, reducing false signals and chart clutter
ATR-Normalized Analysis: All detection thresholds adapt to instrument volatility, ensuring consistent performance across stocks, forex, crypto, and futures without constant recalibration
Transparency-Based Depth: Uses progressive transparency gradients rather than colors or patterns to create depth, maintaining visual clarity while conveying information hierarchy
Comprehensive Strength Metrics: 0-100 void strength calculation considers both the degree of volume depletion and the magnitude of price movement for nuanced zone characterization
🔬 How It Works
Phase 1: Real-Time Detection
On each bar close, the indicator calculates average volume over the lookback period and compares current bar volume against the volume threshold multiplier
Simultaneously measures current bar's high-low range and normalizes it against ATR, comparing the result to price movement sensitivity parameter
If either volume falls below threshold OR movement exceeds sensitivity threshold, the bar is flagged as exhibiting void characteristics
Phase 2: Void Tracking & Qualification
When void conditions first appear, state machine initializes tracking variables: start bar index, initial top/bottom prices, consecutive bar counter, and cumulative strength accumulator
Each subsequent bar with void conditions extends the tracking, updating price boundaries to envelope all bars and accumulating strength scores
When void conditions cease, system checks if consecutive bar count meets minimum threshold; if yes, proceeds to visualization; if no, discards the tracking and resets
Phase 3: 3D Visualization Construction
Calculates average void strength by dividing cumulative strength by number of bars, then determines if void is low liquidity (>50 strength) or high liquidity (≤50 strength)
Generates three polyline layers spanning from start bar to end bar and from top price to bottom price, each with calculated vertical offset based on ATR
Applies progressive transparency (85%, 78%, 70%) with layer ordering creating recession effect for low liquidity zones and protrusion effect for high liquidity zones
Creates optional center label and pushes all visual elements into arrays for memory management
Phase 4: Memory Management & Display
Continuously monitors polyline array size (each void creates 3 polylines); when total exceeds max visible voids × 3, deletes oldest polylines via array.shift()
Similarly manages label array, removing oldest labels when count exceeds maximum to prevent memory accumulation over extended chart history
Plots diagnostic data to TradingView’s data window (void detection binary, current strength, average volume) for detailed analysis without cluttering main chart
💡 Note:
This indicator is designed to enhance your market structure analysis by revealing liquidity characteristics that aren’t visible through standard price and volume displays. For best results, combine void detection with your existing support/resistance analysis, trend identification, and risk management framework. Liquidity voids are descriptive of past market behavior and should inform positioning decisions rather than serve as standalone entry/exit signals. Experiment with detection parameters across different timeframes to find settings that align with your trading style and instrument characteristics.

Adaptive Window Volume ProfileThe indicator builds a rolling volume profile over a chosen time window (1, 3, 12 months or lower), finds POC, VAH/VAL, RH/RL, HVN/LVN, and then overlays volume-driven bar colors (climax, initiative, absorption) filtered by a 30-day RVWAP trend, so you can see where big volume traded and who is winning there right now.
Example Use Case:
How to use it on 4H with 3-month and 12-month rolling profiles:
On a 4H chart, you run two copies of the indicator, both in Rolling Lookback mode, both using the Full (Overlap) engine:
Instance A – 12-month rolling profile (macro map):
-Rolling Unit: Months
-Rolling Length: 12
This gives you the 1-year composite:
-12M RH / RL → outer range of where almost all yearly volume traded (macro high/low “rails”).
-12M VAH / VAL → yearly value area: where the market has been comfortable doing business over the last year.
-12M POC → the single most traded price of the last 12 months (macro gravity).
-12M HVNs/LVNs → long-term shelves (acceptance) and gaps (knife-edges).
Use this instance to answer:
Where are we in the last year’s distribution, and are we approaching macro extremes or living in fair value?
-Combine it with the 30-day RVWAP regime the script computes:
-Above RVWAP and RVWAP rising → macro bull tilt.
-Below RVWAP and RVWAP falling → macro bear tilt.
For example:
-Price near 12M RL with RVWAP bull → potential deep-discount accumulation zone.
-Price near 12M RH with RVWAP bear → potential exhaustion / distribution zone.
Instance B – 3-month rolling profile (tactical map)
-Rolling Unit: Months
-Rolling Length: 3
This builds a 3-month composite on top of your 4H chart:
-3M RH / RL → extremes of the current quarter’s trading.
-3M VAH / VAL → current “fair value box” for the last 90-ish days.
-3M POC → where recent volume concentrates most heavily.
-3M HVNs/LVNs → fresh shelves and gaps inside the bigger yearly structure.
You use this instance for actual trade locations and management:
-Pullbacks into 3M VAL / RL that still sit inside the 12M value and in a bull RVWAP regime → high-probability dip-buy zones; you then look for bull initiative/absorption bar colors to confirm entry.
-Rallies into 3M VAH / RH that line up near 12M VAH / RH in a bear RVWAP regime → good areas to look for shorts, especially when you see bear climax/initiative bars there.
-3M LVNs that coincide with 12M LVNs or VA edges act as sharp decision points: acceptance through often means expansion; rejection often means reversal.
How it all fits together
On your 4H chart, with both instances active:
-12M profile = macro context and big terrain (where the yearly battlefield is).
-3M profile = tactical zones (where to actually trade inside that terrain).
-Bar colors (climax / initiative / absorption) filtered by 30-day RVWAP = timing + confirmation at those levels, favoring the side that has trend and effort behind it.
So the indicator, used this way, becomes:
-one instance to tell you where the big war is being fought (12M)
-one instance to tell you where the current campaign inside that war is concentrated (3M)
-bar colors to tell you whether the team you want to back is actually showing up with size when price hits those levels.

Volume Dynamics Pro [ChartNation]Volume Dynamics Pro by ChartNation is an advanced volume profile indicator that visualizes volume distribution across price levels using a proprietary mirrored butterfly design. The indicator identifies high-volume nodes (areas of significant trading activity) and the Point of Control (POC) - the price level with the highest traded volume within the lookback period.
KEY FEATURES:
Dynamic Volume Profile: Displays volume distribution across 25 price bins with a mirrored butterfly visualization that extends into future bars for forward-looking analysis
Point of Control (POC): Automatically identifies and highlights the price level with maximum volume, featuring a pulsing animation and optional price label with customizable positioning
Multiple Anchoring Modes: Choose between Rolling, Daily, Weekly, Monthly, or Session-based profile calculations to match your trading timeframe
Smart Range Calculation: Three range modes (Fixed Lookback, Hybrid Smart, Percentage-Based) automatically adjust the volume profile range based on recent price action
Volume-Responsive Visualization: Line thickness and glow intensity scale with volume magnitude, making high-volume areas immediately visible
Premium Statistics Box: Real-time display of POC price, total volume, range metrics, and price position relative to POC
Advanced Alert System: Configurable alerts for POC crosses, range breakouts, high-volume zone entries, and volume spikes
Professional Styling: Volume-based line styles (solid/dashed/dotted), gradient bias coloring (support/resistance), dual-tone depth borders, and customizable glow effects
HOW IT WORKS:
The indicator divides the price range into 25 bins and calculates total volume traded at each level. The mirrored butterfly profile displays this distribution, with wider sections indicating higher volume. The POC line marks the price with maximum activity - a critical level often acting as support or resistance.
Volume traces are color-coded: green tint below current price (potential support), red tint above (potential resistance). The intensity of coloring increases as price approaches each level, helping traders identify nearby high-volume zones.
USE CASES:
Identify institutional order flow and accumulation/distribution zones
Locate high-probability support and resistance levels based on actual trading activity
Track POC shifts to understand changing market structure
Confirm breakout validity by analyzing volume at key price levels
Optimize entry/exit points around high-volume nodes
SETTINGS OVERVIEW:
The indicator offers extensive customization across multiple groups: POC styling and extensions, statistics box display, profile anchoring, range calculation modes, alert configuration, line styles, volume-proportional thickness, gradient bias, glow system, depth borders, POC pulse animation, and volume profile display parameters.

Consolidation Value Zones (Recio)Consolidation Value Zones introduces an original algorithm to identify consolidation ranges and locate areas of importance within them. This new method "looks" at the chart and draws zones based on price with the goal of producing actionable zones which appear natural, as if they were found through a human analysis.
> Consider the following...
The chart image above displays Bitcoin, at no specific date, for no specific reason. What I have done here is simply glanced at the chart for about 5 seconds, and circled a few areas which stood out as "obvious" consolidation. It does not take a savant to look at a chart and circle ranging price. However, what we have just done defies many common systems for identifying consolidation. We have located ranges of various zone lengths, as small as roughly 25 bars to as large as roughly 100 bars. Regardless of this, we still determined these zones with our eyes and brain in a few seconds, for some it's practically instant. The issue with us humans doing this, is that we are subjective. We did not really use any concrete rules to determine these areas with our eyes. So the problem becomes "How do we identify these zones in a way which seems natural to us with a repeatable system?" Because of this, my approach is simply a logical attempt to reverse engineer our human intuition.
> Consolidation Value Zones
The name of this indicator is generic. To dissect it, we are identifying consolidation ranges, then using a volume profile to determine the value zone within that range. The specific method used to identify these consolidation zones is something I've personally been referring to as the "skewer" method. Another name that may fit better is "Linear Range Alignment/Overlap".
Ultimately, the goal is to locate a single price level or range that overlaps many adjacent bars.
This should, in theory, return areas of visually obvious consolidation.
> The Skewer Method (Identification Method & Bar Gap Allowances)
One consistent concept across the different identification methods for determining consolidation is time. How long do we chop around before calling it consolidation? This is the "Identification Threshold". Once we have located a consolidation zone "this" wide, we will then consider it as consolidation.
In the chart image above, we are considering a six-bar consolidation formation. The figure on the left shows an example of a perfect raw bar overlap, we can see that the six bars all overlap at one price range. This is a perfect example of what we are looking to identify as consolidation. Unfortunately, if this was all we looked at, we would have a very scarce identification method.
For that reason, we have the example on the right, which shows the additional allowances for the identification of these ranges. At most, the example on the right shows a gapless three-bar overlap. However, if we allow the identification to bridge across the gaps, we are able to draw a zone directly through the center and still be within our parameters. This allowance is the "Bar Gap Allowance" and will determine the leniency of the identification.
Between our identification threshold and bar gap allowance, we can start to piece together how the script is "looking" at our chart.
> Detecting Consolidation (Live Detection)
To aid in transparency and user understanding, the live detection calculation can be seen on the chart as a box, skewering the recent historical bars with a number next to it, indicating the number of bars found as potential consolidation.
As we can see in the chart image above, the script, by default, is looking for a 15-bar consolidation, with a 5-bar gap allowance. In the image, the specific gap count is labeled, we can see the script scan backwards as far as it can before counting five gaps in the data. Once that occurs, the detection stops.
Notice how the zone found is a range, consisting of all price levels which meet the parameters. The lower level of the range only had two gaps, but the upper level reached five.
> Consolidation Range and Value Zones (Volume Profiles)
Once the script has identified the consolidation formation, it calculates a volume profile across the identified consolidation range. From this it calculates and draws the Point of Control (POC) and Value Area in addition to the full consolidation range.
Once we have our zones drawn, and understand what they identify, we can go one step further and apply concepts from volume profile trading.
Range High/Low: Displays the current extent of the identified consolidation.
Value High/Low: Shows the specific area within the consolidation where buyers and sellers found the most value.
POC: The single point, where the most volume was transacted during consolidation.
In a balanced market, we would anticipate price to rotate around POC, oscillating from Value High (VAH) to Value Low (VAL). In contrast, a market in motion moves directionally, building volume at new price levels as value, naturally the POC shifts with it.
> Zone Extensions
Unlike many other scripts, there is no mitigation logic at play here, since crossing a zone simply tells us "buyers and sellers are not currently active here", but it does not guarantee that value cannot return or react from previous areas of value.
Obviously the current zone will always be most relevant, but historical zones can retain relevance depending on the context of the market.
Remember: Each area of consolidation is an area where buyers and sellers were once facing off, resulting in price's consolidation. Amidst this, the value zone was the area of greatest agreement between the participants at that time. When moving outside of a range, we would typically look at historical value areas and price's interaction with them for further context.
Due to the ever changing market, there is no fixed extension lookback that will cover every scenario. By default, the Extension Lookback is "1", meaning the script will extend the most recent zone forward until a new zone is detected.
Note: For clarity, zone extensions are colored differently from core zones.
The following chart image shows a few examples of these unique interactions.
As seen in the chart image, looking to previous areas of value as well as POC can provide context in the form of acceptance or rejection at these levels, providing further insight into the auction for us to respond to.
The zones do contain logic to maintain a clean display. By default, the zones extend conditionally when price returns to the previous consolidation range. If desired, the zones can be extended regardless of price action; this can be toggled with the option "Regardless Extension Mode", as seen below.
> Hollow Candles & Zone Merging
When consolidation is identified, a hollow candle is drawn; these can be used to see exactly when each zone is identified. It is important to understand that consolidation zones stemming from the same origin are merged into one zone. This is a frequent occurrence when the consolidation threshold is passed, but the consolidation continues. For this reason you will often see multiple hollow candles in the later areas of the zones.
Similarly, zones from different origin points that overlap are also merged into one consolidation zone. This ensures that no core zones overlap.
Additionally, every time a zone is merged, a new volume profile for the area is calculated.
> Bar Gap Allowance Type (Technical Explanation)
The specific bar gap allowance value can be altered, but so can the type of allowance being used. While some analyses may benefit from counting the total amount of bar gaps within the consolidation, others may benefit from detecting based on consecutive bar gaps.
The chart image above displays the gap counts for each gap allowance type.
The total bar gap allowance type will count until the gap amount is reached, then terminate detection once the allowed number of gaps has been exceeded.
The consecutive bar gap allowance type resets its count once it finds a valid bar within range, by doing so, it only counts the bars that separate each island of in-range bars.
Both methods have merit.
> Implementation
This identification method has proven effective to identify consolidation across market types. As a result, there cannot be one configuration of settings to fit every application. Adapting the detection type and method for each trader's specific market conditions is highly recommended.
When determining parameters, it is helpful to consider time, as it plays a major role in the identification method.
On a 1D chart, the default threshold of 15 corresponds to 15 days, or about 3 weeks depending on the ticker. To identify periods of one-week consolidation, a threshold of 5 would be suitable. To detect perfect gapless weeks, a bar gap allowance of 0 could be used, as seen in the chart image below.
Additional Example:
In the chart image above, we see a 15-second forex chart over the span of a few hours. The detection parameters are set up to detect 15-minute consolidation with a 2-minute max dead zone (consecutive bar gap).
> Detection Source
By default, the script detects consolidation ranges using the full extent of candle wicks. While this is traditional, detection can also be done using only the candle bodies. These identifications are much more nuanced, detecting only from confirmed candle price action; they do not trigger at the same frequency as wick detection.
Optionally, a "Wick/Body Average" can be chosen as the source for detection; as the name implies, this uses the average value between the candle body and its respective wick.
> Additional Settings
The settings mentioned thus far serve as core parameters for identifying consolidation. The following parameters are simply included for the benefit of the advanced user. It is not recommended to adjust these settings under normal circumstances.
- Value Area Percent: Default = 68.26, while traditionally 70 for volume profiles, 68.26 is accurate to the values of a standard bell-curve distribution. The differences are minimal in application.
- VP Rows: Default = 99, Sets the number of rows to be used when calculating the Volume Profiles (VP); note that higher values will lead to a slower calculation. Max value: 999
> Final Notes
If you have made it this far, thank you for reading.
I hope you find value in this new consolidation identification system and understand the logic behind it.
That's it.
付費腳本

OutsiderEdge – Node Breach Engine (NBE)Overview – What is the Node Breach Engine (NBE)?
NBE is a swing/session volume-profile engine that builds profiles between pivots (or per session), tracks closed & developing POC, and prints breach signals when price challenges the control node. It quantifies node strength, buy/sell composition (CVD) at the POC and the entire profile, Value Area levels (VAH/VAL), VWAP distance, time at price, and introduces a PoV (Point of Void; the LVN located inside the Value Area): to highlight low-participation corridors where rotations or rejections often form. A lightweight EMA smoothed trend can optionally filter signals by prevailing bias.
Use it to answer fast: How strong is this node? Is the profile buy- or sell-led? Are we accepting/rejecting control? Is the developing POC migrating? Is the VA’s LVN (PoV) about to rotate back to POC or reject?
🔹 FEATURES
Volume Profile Core (Swing or Session)
Build pivot-to-pivot or session profiles with configurable row density and Value Area %.
Draw VAH/VAL with optional VA fill and optional profile window background.
Control Node (POC) – Closed & Developing
Closed POC highlighted on finished windows.
Developing POC path stitched bar-by-bar on the active segment (visual migration of control).
Optional POC row highlight and extend-until-touch behavior.
PoV – Point of Void
Detects the lowest-volume row within the current VA band (between VAL and VAH).
Plots a PoV anchor/line you can use as a rotation target or rejection boundary:
Rotations: VAH ↔ PoV (LVN) ↔ POC ↔ VAL.
Rejections: Thin participation at PoV often flips acceptance back toward POC.
Works alongside POC/VA to map acceptance vs. rejection with finer granularity than a single control node.
Node Context Tooltip (Deep Dive)
Compact tooltips on closed profiles: POC price, Node Strength % (POC/Total), CVD split (Buy%/Sell%), VWAP distance %, bars at price.
Profile Buy/Sell Overview (Stacked Bars)
Two stacked horizontal bars (Buy ▲ / Sell ▼) whose width matches the histogram and thickness is configurable.
Auto-placed above or below the profile using swing H/L logic.
Available for closed and developing profiles.
CVD at POC and Full-Profile
Quick labels for Buy% / Sell% at the POC.
Stacked bars summarize full-profile pressure at a glance.
Trend Context
Gradient EMA base vs. smoothed EMA wave for bull/bear bias.
Filter signals to trend direction (only ▲ in uptrend, only ▼ in downtrend).
Breach Signals with Practical Filters
Signals print when price touches/rejects the POC.
Filters: rejection close, ATR momentum guard, wick confirmation, ± margin tolerance, session time filter.
One-shot per bar; coded with object-limit hygiene.
Swing % Change Labels
Small labels at swing H/L showing % move across the last swing window.
Alerts
POC Breach Signal alert for automation/notifications.
🔹 USAGE
In the examples below, you see chart snapshot with labeled alerts/points of POV and POC rejections.
1 — Bearish POC Rejection (▼)
Price tags POC and closes below; ATR guard; EMA wave is bearish. Treat as trend-aligned continuation, reversals or risk tighten on longs.
2 — Bearish POV (LVN) Rejection (▼)
Price probes POV and fails to accept; low participation at PoV flips acceptance. Useful for rotation setups or partials.
3 — Bullish POV Rejection (▲)
Price tags POV and closes above; ATR guard; EMA wave is bullish. Treat as trend-aligned continuation, reversals or risk tighten on shorts.
Treat every signal as context, not as a command. The edge comes from combining location (POC/VA/PoV) with pressure (Node Strength/CVD/VWAP distance) and your structure/timing rules.
🔹 NAVIGATING MARKET CONDITIONS
Trending markets
Expect POC drift with trend; breaches tend to follow-through. Favor trend-aligned breaches; use PoV and VA for add/trim decisions.
Ranges
Frequent VA rotations VAH ↔ PoV ↔ POC ↔ VAL. Fades can work with tight invalidation; lean on PoV to avoid fighting acceptance near POC.
Regime shifts
Repeated failed breaches, PoV rejections, and developing POC re-anchoring are early tells. Adjust filters (ATR guard, wick) and window density as volatility changes.
🔹 SETTINGS SUMMARY
Profile Type: Swing / Session
Window: Present (developing) or Closed Profiles
Rows, lookback cap, Value Area %, optional background
Show POC (closed/developing), POC row highlight
VAH/VAL visibility, optional VA fill
Enable PoV detection (LVN inside VA).
Style controls; optional display with VA/POC.
Rejection close, ATR × multiplier, Wick % threshold, ± Margin %, Session time (trade inside/skip inside)
Enable EMA wave; lengths & smoothing
Toggle CVD; thickness (rows); colors; label text
Swing % change, tooltips, color controls
POC and POV Breach Alerts
🔹 GOOD PRACTICES
Think location + pressure: POC/VA/POV (where) × Node Strength/CVD/VWAP distance (how strong).
Align with HTF structure and liquidity; let POC/POV/VA act as decision levels (initiate, add, reduce, invalidate).
Calibrate row density per symbol/TF; too coarse = blind spots, too fine = noise.
Keep filters honest—if you must loosen them to force a trade, the setup isn’t there.
🔹 LIMITATIONS / DISCLAIMER
NBE does not use lookahead and does not repaint, but no indicator guarantees outcomes.
Node Strength, CVD, PoV, and thresholds are contextual, not signals on their own.
Use independent validation, position sizing, and strict risk management.
Trading involves substantial risk. This tool is for educational purposes only and is not financial advice. Past performance does not guarantee future results. You are solely responsible for your trading decisions and risk management.
Release Notes
v1.1 — PoV (Point of Void) & Profile CVD Bars
Added PoV = LVN inside Value Area as a dedicated anchor/line.
Added stacked profile Buy/Sell bars for closed & developing profiles (width-matched, thickness configurable).
Improved developing VA line/fill updates and object cleanup.
v1.0 — Initial invite-only
Swing/Session profiles; VAH/VAL + optional VA fill
Closed POC highlight + Developing POC path
Node Context Tooltip (POC price, Node Strength, CVD, VWAP distance, bars at price)
EMA wave (trend filter) + breach filters (rejection, ATR guard, wick, time, ± margin)
POC Breach Signal alert & price-panel markers

Delta Arbitrage [by Oberlunar]Delta Arbitrage turns fragmented exchange activity into a single, readable pulse. Each broker breathes at its own rhythm; this tool measures the share of “buy vs. sell” participation per broker, weights those brokers by liquidity/activity, and blends them into one continuous bias. The result is a chart you can read in seconds: aqua when buy-side dominates, red when sell-side does—stronger shades for stronger imbalances.
Delta Arbitrage indicator supports several ways to colour candles based on the aggregated, cross-venue delta, so you can match visual feedback to the strength/consensus of flow.
Examples
LONG opportunity — broad bullish agreement (>70% weighted Buy%)
In this case, a LONG setup formed because a high proportion of brokers simultaneously pushed bullish volumetric deltas (>70%).
The corridor then stayed positive across multiple bars, with sustained long strength in agreement across venues:
Follow-through:
SHORT opportunity — broad bearish agreement (<20% weighted Buy%)
Here, a SHORT setup formed because a high proportion of brokers simultaneously pushed bearish volumetric deltas (<20%).
The corridor remained negative over several bars, showing high-intensity short pressure in cross-venue agreement:
Follow-through:
Spectral mode
You can enable the spectral mode, where range candles are colored only when multiple brokers are in volumetric agreement. You’ll see bullish pressure when weighted Buy% exceeds ~70%; when direction changes, range candles fade out and the lower tiles flip red to reflect rising short pressure.
Example:
How it’s built (in plain words)
For every selected broker, the script computes a robust Buy% over a rolling window and maps it to a signed bias (−1…+1).
Venues are then combined with flexible weighting—Equal, Last Volume, SMA Volume, or Relative-to-SMA—to emphasise who is active now .
A small neutral band near zero calms noise; an intensity curve (gamma) makes strong pushes visually obvious without overshooting weak ones.
What you see
Tinted bars/background : the aggregate bias colours the chart so the prevailing side is instantly clear.
Dashboard : a compact meter for each venue (SELL⇄BUY), its normalised weight, and exact Buy%/bias, plus a summary line for the weighted & unweighted aggregates. It shows whether one venue is dragging the whole market or if participation is broad.
Lower panel (timeline) : a tile-per-bar strip using the same bias logic. Long, saturated runs = sustained participation; choppy, desaturated tiles around zero = balance/compression. The strip’s height is fixed vs. a recent range, so it remains legible on any zoom.
How to act on it (minimal, auditable rules)
Entries: a one-shot arrow when the weighted Buy% crosses a high/low threshold (e.g., >70 for longs, <30 for shorts).
Exits: trail the indicator itself—close when the weighted Buy% retraces by a set number of points from its peak (long) or trough (short).
Context: prefer entries that align with a fresh, persistent run in the lower strip and supportive rows in the dashboard; fade/exit when the strip desaturates or flips.
Do not operate when the average volumetric pressure (avg) is around 50% +- 15%
Why it matters
This is not tick-level microstructure; it’s a fast, stable cross-venue proxy designed for operational use on any timeframe. By unifying “who’s in charge, for how long, and how strongly,” the indicator reduces discretionary noise and turns participation into a tradable, testable context.
— Oberlunar 👁 ★

Volume Profile Area [BigBeluga]🔵 OVERVIEW
The Volume Profile Area is an advanced profiling tool that calculates and visualizes the value area within a chosen period’s volume distribution. It first builds a main profile of the entire range, then constructs a secondary profile inside the defined value area, allowing traders to examine market balance and key trading zones in greater detail.
🔵 CONCEPTS
Volume Profile – Distributes traded volume across price levels to highlight areas of market activity.
Value Area (VA) – The price range containing a chosen percentage of total volume (commonly 50–70%).
Point of Control (PoC) – The price level with the highest traded volume, often acting as a magnet for price.
Nested Profiles – A profile inside the VA adds a second layer of precision, showing where liquidity clusters within the “fair value” zone.
🔵 FEATURES
Main Profile – Full distribution of volume over the selected lookback period.
Secondary Profile – Built only inside the VA of the main profile, highlighting intrabalance structure.
Customizable PoC Selection – Choose between showing the PoC of the
Main Profile ,
the Area Profile ,
their Average ,
or None .
Dynamic Value Area Levels – Automatically plots VAL (Value Area Low) and VAH (Value Area High) with labels.
Overlay Toggles – Show/hide range extremes, VA lines, or PoCs for a cleaner chart view.
Visual Profiles – Main profile shaded in darker blue; the VA profile inside is lighter for clear separation.
Automatic Scaling – Profiles adapt to period highs/lows and auto-adjust bins for consistent resolution.
Volume Labels – PoCs can display traded volume, giving numeric confirmation of liquidity concentration.
🔵 HOW TO USE
Set the Period to define how many bars to include in the main profile.
Adjust the Value Area % to control how much volume defines the VA (e.g., 50% by default).
Pick your PoC option: Main , Area , or Average , depending on focus.
Use VAH/VAL lines as support/resistance levels where most trading occurred.
Compare reactions at Main vs VA PoC levels to spot potential breakouts or mean reversions.
🔵 CONCLUSION
The Volume Profile Area extends traditional profiling by nesting a secondary VA profile inside the main distribution. This dual-layer approach reveals not just where the market was active overall, but where liquidity concentrated within the “fair value” zone—powerful for refining entries, exits, and risk placement across intraday and swing horizons.

Project Pegasus SideMap • VRP Heatmap • Volume Node DetectionDescription CME_MINI:NQ1!
Project Pegasus – Volume SideMap V 1.0 builds a right-anchored horizontal volume heatmap silhouette, visualizing buy/sell participation per price level over any chosen lookback or visible range. It automatically detects Low-Volume Nodes (LVN), Medium-Volume Nodes (MVN), and High-Volume Nodes (HVN), while also marking Top Volume Peaks, POI Lines (Most-Touched Levels), and complete Value Area Levels (POC / VAH / VAL) including optional session highs/lows.
What’s Unique
Right-Fixed Rendering – All profile rows are anchored to the chart’s right edge, creating a consistent visual reference during live trading.
Gap-Free Silhouette – Each price row blends seamlessly with its neighbors, producing a clean and continuous volume shape.
Triple-Tier Node Detection (LVN / MVN / HVN) – Automatically highlights zones of rejection, transition, and acceptance based on relative volume strength.
Dynamic Binning System – Adapts to price range and lookback while preserving proportional per-row volume distribution.
POI Finder (Most Touches) – Highlights price rows that have been touched most frequently by bars (traffic clusters).
Top-N Peaks – Sorts and draws the strongest single-price clusters by total volume while respecting minimum spacing.
Integrated Value Area Metrics – Calculates and plots POC, VAH, and VAL with optional session High/Low markers.
Color Modes – Choose between heatmap intensity (volume-based) or buy/sell ratio blending for directional context.
Performance Optimized – Rebuilds only when structure changes, ensuring smooth operation even with large histories.
Technical Overview
1. Binning & Aggregation
The full price range is divided into a user-defined number of rows (bins) of equal height.
For each bar, traded volume is distributed across all intersecting bins proportionally to price overlap.
A buy/sell proxy is estimated based on candle close position, producing per-row Buy, Sell, and Total Volume arrays.
2. Silhouette Rendering
Each row’s strength = total volume ÷ maximum volume.
Two color modes:
• Volume Mode → intensity scales by relative volume (heatmap).
• Ratio Mode → blend between sell and buy base colors based on dominance (close position).
Weak or neutral rows can be faded or forced to minimum width via strength and ratio-deviation filters.
3. Node Detection (LVN / MVN / HVN)
Relative bands are defined by lower/upper % thresholds.
Consecutive rows meeting criteria are grouped into “bands.”
Optional gap-merge unifies nearby bands separated by small gaps (in ticks).
Quality filters:
• Min. Average in Band (%) → enforces minimum average participation.
• Min. Prominence vs. Neighbors (%) → compares contrast against adjacent volume peaks.
Enforces minimum center distance (in ticks) to prevent overlap.
Each valid band draws a Top/Bottom line pair and optional mid-label (LVN/MVN/HVN).
4. Volume Peaks
Ranks all rows by total volume (descending) and selects top N peaks with spacing filters.
Drawn as horizontal lines or labeled markers (P1, P2, etc.).
5. POI Lines (Most Touches)
During aggregation, each row counts how many bars overlap it.
The top X rows with highest touch counts are drawn as POI lines—often strong participation or mean-retest zones.
6. Value Area (POC / VAH / VAL)
POC = row with highest total volume.
Expands outward symmetrically until the configured Value Area % of total volume is covered.
VAH and VAL mark the acceptance range; optional High/Low lines outline total range boundaries.
7. Right-Fix Layout
All components are rendered relative to the chart’s rightmost bar.
Width dynamically scales with visible bars × % width setting, ensuring proportional scaling across zoom levels.
How to Use
Read market structure:
HVNs = high acceptance or balance areas → likely mean-reversion zones.
LVNs = thin participation → breakout or rejection points (“air pockets”).
MVNs = transition areas between acceptance and rejection.
Trade around POC / VAH / VAL:
These levels represent fair-value boundaries and rotational pivots.
POI & Peaks:
Use them as strong reference lines for responsive trading decisions.
Ratio-Color Mode:
Exposes directional imbalance and potential absorption zones visually.
Best practice:
Live trading → right-fix active, moderate row count.
Post-session analysis → higher granularity, LVN/HVN/MVN and peaks enabled with labels.
Key Settings
Core
Lookback length or visible-range mode
Row count (granularity)
Profile width (% of visible bars)
Right offset, minimum box width, transparency
Date Filter
Aggregate only bars from a defined start date onward.
Coloring
Buy/Sell ratio mode toggle
Base colors for buy and sell volume
Filters
Minimum ratio deviation (±) → ignore nearly balanced rows
Minimum volume strength (%) → fade weak rows
LVN / MVN / HVN Detection
Independent enable toggles
Lower/upper % thresholds
Minimum band height (rows)
Merge small gaps (ticks)
Minimum average in band (%)
Minimum prominence vs. neighbors (%)
Minimum distance between bands (ticks)
Line color, width, style, and label options
Peaks
Number of peaks (0–20)
Minimum distance between peaks (ticks)
Color, width, style, label placement
POI Lines
Enable toggle
POI count (1–5)
Minimum gap between POIs (rows)
Color, width, style, label offset
Value Levels (POC / VAH / VAL)
Show/hide Value Area Levels
Value Area % coverage
POC / VAH / VAL line styles, widths, colors
Optional Session High/Low lines
Notes & Limitations
Optimized for intraday and swing data; accuracy depends on chart volume granularity.
Large lookbacks with high row counts and all detection layers enabled may impact performance—adjust parameters for balance.
Buy/Sell ratio is a visual approximation based on candle structure, not actual order-book delta.
Designed as a contextual visualization tool, not a trade signal generator.
Disclaimer
For educational and informational purposes only.
Not financial advice.
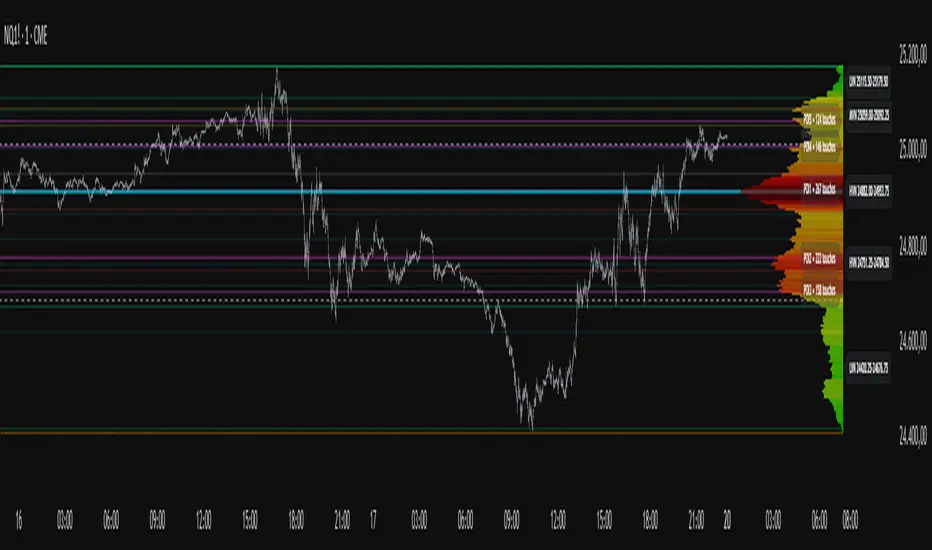
Volume Profile Two-Tone - Hit Counter - Meter V1 Volume Profile Two-Tone - Hit Counter - Meter V1
Overview
The Volume Profile Two-Tone - Hit Counter - Meter V1 is a Pine Script v6 indicator for TradingView, designed to visualize buy and sell activity distribution across price levels within a user-defined window or intraday session. It plots a dual-color horizontal histogram showing buying (green) and selling (red) volume intensity, along with optional hit-count numbers and meter overlays. The profile dynamically updates as new bars form, providing an intuitive picture of where market participants are most active.
The enhanced V1 edition introduces persistent hit counts, real-time adaptive row rebuilding, and improved memory management for smoother performance in both rolling-window and session modes.
How It Works
The indicator divides the selected range into rows (price bins) and aggregates trade volume (or tick volume) per bar.
Each bin separately sums up bullish and bearish contributions based on candle direction and delta logic, then draws side-by-side histogram bars:
• Buy Volume (green): Total volume from bullish bars within the bin.
• Sell Volume (red): Total volume from bearish bars within the bin.
A rolling or session-based window determines how many recent bars are analyzed. Value Area (VA), Point of Control (POC), and total hits per bin are computed continuously. The display auto-adjusts as price moves, keeping the profile anchored to the latest visible bars.
Behind the scenes, optimized arrays manage active boxes, lines, and labels for each bin. Functions like ensure_rows() rebuild buffers only when necessary, guaranteeing efficiency without repainting past data. Persistent hit-tracking ensures each price level maintains its count even when temporarily hidden.
Key Features
• Dual-Tone Volume Histogram: Buy/sell split with distinct colors for immediate visual contrast.
• Rolling or Session Profiles: Choose between continuous rolling windows or intraday session resets.
• Persistent Hit Counts: Displays total touches per bin, remaining stored even when bins refresh.
• Adaptive Row Management: Automatic rebuilding when zooming, scrolling, or changing resolution.
• Value Area + POC Detection: Highlights the most active price levels and volume concentration zones.
• Meter Overlay Option: Adds gradient bars or directional meters for quick trend context.
• Performance Optimized: Uses lightweight arrays and cached line handles for minimal CPU load.
• Custom Color Control: Editable buy/sell colors, opacity, row count, and profile width.
• Full Persistence Mode: Profiles remain visually consistent across bar updates without redraw gaps.
What It Displays
The Volume Profile Two-Tone - Hit Counter - Meter V1 presents an adaptive horizontal histogram beside the chart’s candles, revealing how volume is distributed across price.
• Green segments show dominant buying interest; red segments reveal selling pressure.
• POC line identifies the highest-volume price.
• Hit-count numbers quantify how often price traded at each level.
• Optional meters display relative directional strength within the same range.
This visual layering helps traders quickly identify supply/demand zones, balance areas, and developing auction profiles across intraday or multi-session contexts.
Originality
The Pine Script v6 indicator uses efficient array management (array.new_*, array.set, array.get) and native math operations for rendering.
It avoids external dependencies, relying only on built-in TradingView functions like request.security, box.new, line.new, and label.new for dynamic plotting.
Common Ways People Use It
• Scalpers: Study short-term imbalances or high-activity levels to time entries/exits.
• Day Traders: Track evolving session volume and POC migration.
• Swing Analysts: Compare rolling distributions to identify value shifts over multiple days.
• Volume Profilers: Combine with VWAP or order-flow tools for deeper context.
Configuration Notes
Profile Mode: Select Rolling Window (bars) or Session (intraday).
Rows and Width: Default = 72 rows, 44 bars width.
Colors and Opacity: Adjust to match chart theme.
Performance Mode: Choose Accurate or Fast (approximate) for speed control.
Show Hits / Meter: Enable hit-count numbers and gradient meters for added context.
Legal Disclaimer
For informational and educational purposes only—not investment, financial, or trading advice. Past performance does not guarantee future results; trading involves significant risk. Provided “as is,” without warranties. Consult a qualified professional before making decisions. By using, you accept all risks and agree to this disclaimer.

Cumulative Volume Delta Profile and Heatmap [BackQuant]Cumulative Volume Delta Profile and Heatmap
A multi-view CVD workstation that measures buying vs selling pressure, renders a price-aligned CVD profile with Point of Control, paints an optional heatmap of delta intensity, and detects classical CVD divergences using pivot logic. Built for reading who is in control, where participation clustered, and when effort is failing to produce result.
What is CVD
Cumulative Volume Delta accumulates the difference between aggressive buys and aggressive sells over time. When CVD rises, buyers are lifting the offer more than sellers are hitting the bid. When CVD falls, the opposite is true. Plotting CVD alongside price helps you judge whether price moves are supported by real participation or are running on fumes.
Core Features
Visual Analysis Components
CVD Columns - Plot of cumulative delta, colored by side, for quick read of participation bias.
CVD Profile - Price-aligned histogram of CVD accumulation using user-set bins. Shows where net initiative clustered.
Split Buy and Sell CVD - Optional two-sided profile that separates positive and negative CVD into distinct wings.
POC - Point of Control - The price level with the highest absolute CVD accumulation, labeled and line-marked.
Heatmap - Semi-transparent blocks behind price that encode CVD intensity across the last N bars.
Divergence Engine - Pivot-based detection of Bearish and Bullish CVD divergences with optional lines and labels.
Stats Panel - Top level metrics: Total CVD, Buy and Sell totals with percentages, Delta Ratio, and current POC price.
How it works
Delta source and sampling
You select an Anchor Timeframe that defines the higher time aggregation for reading the trend of CVD.
The script pulls lower timeframe volume delta and aggregates it to the anchor window. You can let it auto-select the lower timeframe or force a custom one.
CVD is then accumulated bar by bar to form a running total. This plot shows the direction and persistence of initiative.
Profile construction
The recent price range is split into Profile Granularity bins.
As price traverses a bin, the current delta contribution is added to that bin.
If Split Buy and Sell CVD is enabled, positive CVD goes to the right wing and negative CVD to the left wing.
Widths are scaled by each side’s maximum so you can compare distribution shape at a glance.
The Point of Control is the bin with the highest absolute CVD. This marks where initiative concentrated the most.
Heatmap
For each bin, the script computes intensity as absolute CVD relative to the maximum bin value.
Color is derived from the side in control in that bin and shaded by intensity.
Heatmap Length sets how far back the panels extend, highlighting recurring participation zones.
Divergence model
You define pivot sensitivity with Pivot Left and Right .
Bearish divergence triggers when price confirms a higher high while CVD fails to make a higher high within a configurable Delta Tolerance .
Bullish divergence triggers when price confirms a lower low while CVD fails to make a lower low.
On trigger, optional link lines and labels are drawn at the pivots for immediate context.
Key Settings
Delta Source
Anchor Timeframe - Higher TF for the CVD narrative.
Custom Lower TF and Lower Timeframe - Force the sampling TF if desired.
Pivot Logic
Pivot Left and Right - Bars to each side for swing confirmation.
Delta Tolerance - Small allowance to avoid near-miss false positives.
CVD Profile
Show CVD Profile - Toggle profile rendering.
Split Buy and Sell CVD - Two-sided profile for clearer side attribution.
Show Heatmap - Project intensity panels behind price.
Show POC and POC Color - Mark the dominant CVD node.
Profile Granularity - Number of bins across the visible price range.
Profile Offset and Profile Width - Position and scale the profile.
Profile Position - Right, Left, or Current bar alignment.
Visuals
Bullish Div Color and Bearish Div Color - Colors for divergence artifacts.
Show Divergence Lines and Labels - Visualize pivots and annotations.
Plot CVD - Column plot of total CVD.
Show Statistics and Position - Toggle and place the summary table.
Reading the display
CVD columns
Rising CVD confirms buyers are in control. Falling CVD confirms sellers.
Flat or choppy CVD during wide price moves hints at passive or exhausted participation.
CVD profile wings
Thick right wing near a price zone implies heavy buy initiative accumulated there.
Thick left wing implies heavy sell initiative.
POC marks the strongest initiative node. Expect reactions on first touch and rotations around this level when the tape is balanced.
Heatmap
Brighter blocks indicate stronger historical net initiative at that price.
Stacked bright bands form CVD high volume nodes. These often behave like magnets or shelves for future trade.
Divergences
Bearish - Price prints a higher high while CVD fails to do so. Effort is not producing result. Potential fade or pause.
Bullish - Price prints a lower low while CVD fails to do so. Capitulation lacks initiative. Potential bounce or reversal.
Stats panel
Total CVD - Net initiative over the window.
Buy and Sell volume with percentages - Side composition.
Delta Ratio - Buy over Sell. Values above 1 favor buyers, below 1 favor sellers.
POC Price - Current control node for plan and risk.
Workflows
Trend following
Choose an Anchor Timeframe that matches your holding period.
Trade in the direction of CVD slope while price holds above a bullish POC or below a bearish POC.
Use pullbacks to CVD nodes on your profile as entry locations.
Trend weakens when price makes new highs but CVD stalls, or new lows while CVD recovers.
Mean reversion
Look for divergences at or near prior CVD nodes, especially the POC.
Fade tests into thick wings when the side that dominated there now fails to push CVD further.
Target rotations back toward the POC or the opposite wing edge.
Liquidity and execution map
Treat strong wings and heatmap bands as probable passive interest zones.
Expect pauses, partial fills, or flips at these shelves.
Stops make sense beyond the far edge of the active wing supporting your idea.
Alerts included
CVD Bearish Divergence and CVD Bullish Divergence.
Price Cross Above POC and Price Cross Below POC.
Extreme Buy Imbalance and Extreme Sell Imbalance from Delta Ratio.
CVD Turn Bullish and CVD Turn Bearish when net CVD crosses zero.
Price Near POC proximity alert.
Best practices
Use a higher Anchor Timeframe to stabilize the CVD story and a sensible Profile Granularity so wings are readable without clutter.
Keep Split mode on when you want to separate initiative attribution. Turn it off when you prefer a single net profile.
Tune Pivot Left and Right by instrument to avoid overfitting. Larger values find swing divergences. Smaller values find micro fades.
If volume is thin or synthetic for the symbol, CVD will be less reliable. The script will warn if volume is zero.
Trading applications
Context - Confirm or question breakouts with CVD slope.
Location - Build entries at CVD nodes and POC.
Timing - Use divergence and POC crosses for triggers.
Risk - Place stops beyond the opposite wing or outside the POC shelf.
Important notes and limits
This is a price and volume based study. It does not access off-book or venue-level order flow.
CVD profiles are built from the data available on your chart and the chosen lower timeframe sampling.
Like all volume tools, readings can distort during roll periods, holidays, or feed anomalies. Validate on your instrument.
Technical notes
Delta is aggregated from a lower timeframe into an Anchor Timeframe narrative.
Profile bins update in real time. Splitting by side scales each wing independently so both are readable in the same panel.
Divergences are confirmed using standard pivot definitions with user-set tolerances.
All profile drawing uses fixed X offsets so panels and POC do not swim when you scroll.
Quick start
Anchor Timeframe = Daily for intraday context.
Split Buy and Sell CVD = On.
Profile Granularity = 100 to 200, Profile Position = Right, Width to taste.
Pivot Left and Right around 8 to 12 to start, then adapt.
Turn on Heatmap for a fast map of interest bands.
Bottom line
CVD tells you who is doing the lifting. The profile shows where they did it. Divergences tell you when effort stops paying. Put them together and you get a clear read on control, location, and timing for both trend and mean reversion.

Anchored Session Volume Profile • Heatmap Profiles • Asia/EU/US Description
This indicator builds Anchored Session Volume Profiles for Asia, EU, and US sessions on intraday charts and renders them as right-docked line histograms (heatmap or classic style). Each session computes its own POC, VAH, VAL and optional Session High/Low lines. An optional per-price-bin Delta overlay estimates buy/sell pressure inside the profile rows for quick order-flow context.
What’s unique
Three independent session anchors (Asia/EU/US) with custom start/end times, bin size in ticks, and Value Area %.
Right-fixed live rendering or post-close persistence (draw levels only after the session closes).
Adaptive width: profile width scales with elapsed session length (anchor → now/end) within user limits.
Heatmap profile: row tint scales by relative volume; or Classic single-color with optional gradient.
Per-row Delta ticks (outside/inside, configurable direction) derived from bar delta and overlap with each price bin.
Clean POC/VAH/VAL line styling, optional ray extension, and Session High/Low rays per session.
How it works (technical)
Binning: Rows are built with a user-defined bin height in ticks. Arrays expand/shrink as price extends; the base is shifted when new lows appear to keep bins aligned.
Accumulation: For each bar within the active session window, traded volume is distributed to intersecting bins proportionally to the price overlap with that bin.
Value Area: POC is the highest-volume bin. VA is grown symmetrically around the POC until the selected coverage (VA%) is reached.
Delta per bin (optional): A bar-level delta proxy volume * (close − open) / range (clamped) is split into buy/sell and allocated to bins proportionally to the same overlap share, producing a per-row delta magnitude for rendering ticks.
Rendering modes:
Right fixed: refreshes each bar; lines/histogram are docked at the anchor X-position.
Draw Levels after Session Close: on close, only POC/VAH/VAL (and optional Session High/Low) are persisted.
No lookahead: All computations use confirmed bars; levels are deterministic on close.
How to use
Use the Asia/EU/US profiles to read participation hand-offs and session-driven rotations.
Trade off POC/VAH/VAL as acceptance/rejection references; confluence with session High/Low often marks responsive flows.
Employ Delta ticks per row to spot absorption, one-sided stacking, or fading participation inside the profile without leaving TradingView.
Prefer right-fixed during live trading and post-close when you want persistent session levels.
Key settings
General per session: Start/End (hh:mm), Bin size (ticks), Value Area %, toggle POC/VAH/VAL lines.
Rendering: Heatmap vs. Classic, orientation (Left/Right), gradient on/off, row thickness, right offset, adaptive width limits.
Delta (per price bin): global on/off, per-session on/off, tick width, max tick length (bars), outside/inside placement, direction (sign-based / always left / always right), colors.
Levels: POC/VAH/VAL styles (solid/dashed/dotted), widths, colors, extend right (ray).
Session High/Low: per-session on/off, style, width, colors, optional right-ray extension.
Notes & limitations
Designed for intraday data; accuracy depends on the feed’s volume granularity.
Large histories + small bins + delta ticks can be heavy; tune bin size, adaptive width, and delta max length for performance.
Timezone for anchors is set internally to Europe/Berlin.
Educational tool — not a signal generator.
Disclaimer
For educational and informational purposes only. Not financial advice.

Dynamic Volume Trace Profile [ChartPrime]⯁ OVERVIEW
Dynamic Volume Trace Profile is a reimagined take on volume profile analysis. Instead of plotting a static horizontal histogram on the side of your chart, this indicator projects dynamic volume trace lines directly onto the price action. Each bin is color-graded according to its relative strength, creating a living “volume skeleton” of the market. The orange trace highlights the current Point of Control (POC)—the price level with maximum historical traded volume within the lookback window. On the right side, the tool builds a mini profile, showing absolute volume per bin alongside its percentage share, where the POC always represents 100% strength .
⯁ KEY FEATURES
Dynamic On-Chart Bins:
The range between highest high and lowest low is split into 25 bins. Each bin is drawn as a horizontal trace line across the lookback chart period.
Gradient Color Encoding:
Trace lines fade from transparent to teal depending on relative volume size. The more intense the teal, the stronger the historical traded activity at that level.
Automatic POC Highlight:
The bin with the highest aggregated volume is flagged with an orange line . This POC adapts bar-by-bar as volume distribution shifts.
Right-Side Volume Profile:
At the chart’s right edge, the script prints a box-style profile. Each bin shows:
• Total volume (absolute units).
• Percentage of max volume, in parentheses (POC bin = 100%).
This gives both raw and normalized context at a glance.
Adjustable Lookback Window:
The lookback defines how many bars feed the profile. Increase for stable HTF zones or decrease for responsive intraday distributions.
POC Toggle & Styling:
Optionally toggle POC highlighting on/off, adjust colors, and set line thickness for better integration with your chart theme.
⯁ HOW IT WORKS (UNDER THE HOOD)
Step Sizing:
over last 100 bars is divided by to calculate bin height.
Volume Aggregation:
For each bar in the , the script checks which bin the close falls into, then adds that bar’s volume to the bin’s counter.
Gradient Mapping:
Bin volume is normalized against the max volume across all bins. That value is mapped onto a gradient from transparent → teal.
POC Logic:
The bin with highest volume is colored orange both on the dynamic trace and in the right-side profile.
Right-Hand Profile:
Boxes are drawn for each bin proportional to volume / maxVolume × 50 units, with text labels showing both absolute volume and normalized %.
⯁ USAGE
Use the orange trace as the dominant “magnet” level—price often gravitates to the POC.
Watch for clusters of strong teal traces as areas of high acceptance; thin or faint zones mark low-liquidity gaps prone to fast moves.
On intraday charts, tighten lookback to reveal session-based distributions . For swing or position trading, expand lookback to surface more durable volume shelves.
Compare the right-side profile % to judge how “top-heavy” or “bottom-heavy” the current distribution is.
Use bright, intense color traces as context for confluence with structure, OBs, or liquidity hunts.
⯁ CONCLUSION
Dynamic Volume Trace Profile takes the traditional volume profile and fuses it into the body of price itself. Instead of a fixed sidebar, you see gradient traces layered directly on the chart, giving real-time context of where volume concentrated and where price may be drawn. With built-in POC highlighting, normalized % readouts, and an adaptive right-side profile, it offers both precision levels and market structure awareness in a cleaner, more intuitive form.

Volume Profile 3D (Zeiierman)█ Overview
Volume Profile 3D (Zeiierman) is a next-generation volume profile that renders market participation as a 3D-style profile directly on your chart. Instead of flat histograms, you get a depth-aware profile with parallax, gradient transparency, and bull/bear separation, so you can see where liquidity stacked up and how it shifted during the move.
Highlights:
3D visual effect with perspective and depth shading for clarity.
Bull/Bear separation to see whether up bars or down bars created the volume.
Flexible colors and gradients that highlight where the most significant trading activity took place.
This is a state-of-the-art volume profile — visually powerful, highly flexible, and unlike anything else available.
█ How It Works
⚪ Profile Construction
The price range (from highest to lowest) is divided into a number of levels (buckets). Each bar’s volume is added to the correct level, based on its average price. This builds a map of where trading volume was concentrated.
You can choose to:
Aggregate all volume at each level, or
Split bullish vs. bearish volume , slightly offset for clarity.
This creates a clear view of which price zones matter most to the market.
⚪ 3D Effect Creation
The unique part of this indicator is how the 3D projection is built. Each volume block’s width is scaled to its relative size, then tilted with a slope factor to create a depth effect.
maxVol = bins.bu.max() + bins.be.max()
width = math.max(1, math.floor(bucketVol / maxVol * ((bar_index - start) * mult)))
slope = -(step * dev) / ((bar_index - start) * (mult/2))
factor = math.pow(math.min(1.0, math.abs(slope) / step), .5)
width → determines how far the volume extends, based on relative strength.
slope → creates the angled projection for the 3D look.
factor → adjusts perspective to make deeper areas shrink naturally.
The result is a 3D-style volume profile where large areas pop forward and smaller areas fade back, giving you immediate visual context.
█ How to Use
⚪ Support & Resistance Zones (HVNs and Value Area)
Regions where a lot of volume traded tend to act like walls:
If price approaches a high-volume area from above, it may act as support.
From below, it may act as resistance.
Traders often enter or exit near these zones because they represent strong agreement among market participants.
⚪ POC Rejections & Mean Reversions
The Point of Control (POC) is the single price level with the highest volume in the profile.
When price returns to the POC and rejects it, that’s often a signal for reversal trades.
In ranging markets, price may bounce between edges of the Value Area and revert to POC.
⚪ Breakouts via Low-Volume Zones (LVNs)
Low volume areas (gaps in the profile) offer path of least resistance:
Price often moves quickly through these thin zones when momentum builds.
Use them to spot breakouts or continuation trades.
⚪ Directional Insight
Use the bull/bear separation to see whether buyers or sellers dominated at key levels.
█ Settings
Use Active Chart – Profile updates with visible candles.
Custom Period – Fixed number of bars.
Up/Down – Adjust tilt for the 3D angle.
Left/Right – Scale width of the profile.
Aggregated – Merge bull/bear volume.
Bull/Bear Shift – Separate bullish and bearish volume.
Buckets – Number of price levels.
Choose from templates or set custom colors.
POC Gradient option makes high volume bolder, low volume lighter.
-----------------
Disclaimer
The content provided in my scripts, indicators, ideas, algorithms, and systems is for educational and informational purposes only. It does not constitute financial advice, investment recommendations, or a solicitation to buy or sell any financial instruments. I will not accept liability for any loss or damage, including without limitation any loss of profit, which may arise directly or indirectly from the use of or reliance on such information.
All investments involve risk, and the past performance of a security, industry, sector, market, financial product, trading strategy, backtest, or individual's trading does not guarantee future results or returns. Investors are fully responsible for any investment decisions they make. Such decisions should be based solely on an evaluation of their financial circumstances, investment objectives, risk tolerance, and liquidity needs.

Quadro Volume Profile [BigBeluga]🔵 OVERVIEW
The Quadro Volume Profile is a precision-engineered volume profiling tool that segments market activity into four distinct quadrants surrounding the current price. By separating bullish and bearish volume above and below the current price, it helps traders identify dominant forces and high-interest price zones with ease. Each quadrant includes label annotations showing total volume and its share of overall activity — delivering powerful insights into the market’s internal structure.
🔵 CONCEPTS
Four-Quadrant Volume Distribution : Volume is separated into Buy and Sell profiles both above and below the current price.
Directional Volume Logic : Bullish and bearish candle volume is allocated to specific bins, creating color-coded volume stacks.
Dynamic PoC Detection : Point of Control (PoC) levels are calculated per quadrant and optionally displayed.
Lookback-Based Anchoring : The volume histogram is anchored to a fixed lookback window, ensuring consistency and historical context.
Label-Based Analytics : Each quadrant displays a labeled breakdown of direction, total volume, and percentage weight of total activity.
🔵 FEATURES
Four separate volume profiles:
Upper Left: Bearish volume (Sell Quad above price)
Upper Right: Bullish volume (Buy Quad above price)
Lower Left: Bullish volume (Buy Quad below price)
Lower Right: Bearish volume (Sell Quad below price)
Live Labels for Each Quad:
Displays BUY or SELL direction
Shows total volume per quadrant (e.g. 607.49K)
Displays percent share of total quad volume (e.g. 18.87%)
Toggle visibility for each profile and each Point of Control (PoC) dashed PoC lines with volume annotations
Adjustable calculation period (lookBack), number of bins, and horizontal offset
Color gradient intensity represents volume strength per bin
Auto-cleaning visuals to keep the chart uncluttered
Gradient color control for Buy and Sell volumes
Clean midline split between upper and lower quadrants
🔵 HOW TO USE
Select your desired calculation period (default: 200 bars) to define the range for volume analysis.
Adjust the bins parameter for more or less resolution in volume distribution.
Toggle each quadrant on/off depending on your preference using the settings panel:
“Upper Sell Quad” – shows bearish volume above current price (left)
“Upper Buy Quad” – shows bullish volume above current price (right)
“Lower Buy Quad” – shows bullish volume below current price (left)
“Lower Sell Quad” – shows bearish volume below current price (right)
Enable or disable PoC lines for each quad to highlight where volume peaked.
Use the gradient coloring to identify volume imbalances — sharp differences between opposing quads often indicate key zones of rejection or breakout.
Monitor the midline level which splits the four quadrants — it serves as a psychological pivot zone.
🔵 CONCLUSION
The Quadro Volume Profile offers a powerful and visually intuitive way to dissect market activity around price. By splitting volume into four quadrants, traders can better interpret order flow, identify dominant volume zones, and spot potential reversals or continuation setups. Whether you're trading breakouts, liquidity sweeps, or range-bound behavior — this tool adds a structured layer of volume context to your charting workflow.

DeltaFlow Volume Profile [BigBeluga]🔵 OVERVIEW
The DeltaFlow Volume Profile builds a compact volume profile next to price and enriches every bin with flow context : bullish vs. bearish participation (%), a per-bin Delta % , an optional Delta Heat Map , and a PoC band with the bin’s absolute volume. This lets you see not just where volume clustered, but who (buyers or sellers) dominated inside each price slice.
🔵 CONCEPTS
Binned Volume Profile : Price range over a user-defined LookBack is split into Bins ; each bin aggregates traded volume.
Bull/Bear Split : Within every bin, volume is separated by candle direction into Bull Volume and Bear Volume , then normalized to % of the bin’s displayed size.
Delta % : The difference between Bull % and Bear % for the bin. Positive = buyer dominance; negative = seller dominance.
Delta Heat Map : Bin background shading that scales with both total volume strength and delta bias.
PoC (Point of Control) : The most significant bin gets a PoC band and a label with its absolute volume.
🔵 FEATURES
Profile with Flow : A clean horizontal volume bar per bin plus stacked Bull % and Bear % .
Per-Bin Delta Label : A readable “Δ xx%” tag at the start of each bin shows dominance at a glance.
Delta Heat Map : Optional gradient that intensifies with higher volume and stronger delta.
PoC Highlight : Optional PoC band colored separately, labeled with absolute volume (e.g., “1.23M”).
Configurable Inputs : LookBack, number of Bins (10–100), toggles for Delta, Heat Map, Volume Bars, and PoC color.
Readable Colors : Separate inputs for bullish (volume +) and bearish (volume –) hues.
🔵 HOW TO USE
Set the window : Choose LookBack and Bins to balance detail vs. performance (more bins = finer resolution).
Enable “Volume Bars” to display the bull/bear split as two stacked percent bars inside each bin.
High Bull % near support → constructive demand.
High Bear % near resistance → active supply.
Use Δ labels (toggle “Delta”) to quickly spot bins with clear buyer/seller control; combine with price position for confluence.
Turn on Delta Heat Map to prioritize areas with both large volume and strong imbalance.
Watch the PoC : The PoC band marks the most traded (and often magnet) level; its label shows absolute size for context.
Trade ideas :
Breakout continuation when Δ stays positive across consecutive upper bins.
Reversion risk when price enters a large bearish-Δ cluster below.
Manage risk around the PoC; reactions there can be sharp.
🔵 CONCLUSION
DeltaFlow Volume Profile upgrades a classic profile with flow intelligence. The bull/bear split, explicit Δ %, heat-weighted backdrop, and PoC volume label make dominant participation and key price shelves obvious. Use it to filter levels, time entries with imbalance, and validate breakouts or fades with objective volume-flow evidence.

RTH Levels: VWAP + PDH/PDL + ONH/ONL + IBAlgo Index — Levels Pro (ONH/ONL • PDH/PDL • VWAP±Bands • IB • Gaps)
Purpose. A session-aware, non-repainting levels tool for intraday decision-making. Designed for futures and indices, with clean visuals, alerts, and a one-click Minimal Mode for screenshot-ready charts.
What it plots
• PDH/PDL (RTH-only) – Prior Regular Trading Hours high/low, computed intraday and frozen at the RTH close (no 24h mix-ups, no repainting).
• ONH/ONL – Prior Overnight high/low, held throughout RTH.
• RTH VWAP with ±σ bands – Volume-weighted variance, reset each RTH.
• Initial Balance (IB) – First N minutes of RTH, plus 1.5× / 2.0× extensions after IB completes.
• Today’s RTH Open & Prior RTH Close – With gap detection and “gap filled” alert.
• Killzone shading – NY Open (09:30–10:30 ET) and Lunch (11:15–13:30 ET).
• Values panel (top-right) – Each level with live distance in points & ticks.
• Right-edge level tags – With anti-overlap (stagger + vertical jitter).
• Price-scale tags – Native trackprice markers that always “stick” to the axis.
⸻
New in v6.4
• Minimal Mode: one click for a clean look (thinner lines, VWAP bands/IB extensions hidden, on-chart right-edge labels off; price-scale tags remain).
• Theme presets: Dark Hi-Contrast / Light Minimal / Futures Classic / Muted Dark.
• Anti-overlap controls: horizontal staggering, vertical jitter, and baseline offset to keep tags readable even when levels cluster.
⸻
Quick start (2 minutes)
1. Add to chart → keep defaults.
2. Sessions (ET):
• RTH Session default: 09:30–16:00 (US equities cash hours).
• Overnight Session default: 18:00–09:29.
Adjust for your market if you use different “day” hours (e.g., many use 08:20–13:30 ET for COMEX Gold).
3. Theme & Minimal Mode: pick a Theme Preset; enable Minimal Mode for screenshots.
4. Visibility: toggle PD/ON/VWAP/IB/References/Panel to taste.
5. Right-edge labels: turn Show Right-Edge Labels on. If they crowd, tune:
• Anti-overlap: min separation (ticks)
• Horizontal offset per tag (bars)
• Vertical jitter per step (ticks)
• Right-edge baseline offset (bars)
6. Alerts: open Add alert → Condition: and pick the events you want.
⸻
How levels are computed (no repainting)
• PDH/PDL: Intraday H/L are accumulated only while in RTH and saved at RTH close for “yesterday’s” values.
• ONH/ONL: Accumulated across the defined Overnight window and then held during RTH.
• RTH VWAP & ±σ: Volume-weighted mean and standard deviation, reset at the RTH open.
• IB: First N minutes of RTH (default 60). Extensions (1.5×/2.0×) appear after IB completes.
• Gaps: Today’s RTH open vs prior RTH close; “Gap Filled” triggers when price trades back to prior close.
⸻
Practical playbooks (how to trade around the levels)
1) PDH/PDL interactions
• Rejection: Price taps PDH/PDL then closes back inside → mean-reversion toward VWAP/IB.
• Acceptance: Close/hold beyond PDH/PDL with momentum → continuation to next HTF/IB target.
• Alert: PD Touch/Break.
2) ONH/ONL “taken”
• Often one ON extreme is taken during RTH. ONH Taken / ONL Taken → check if it’s a clean break or sweep & reclaim.
• Sweep + reclaim near VWAP can fuel rotations through the ON range.
3) VWAP ±σ framework
• Balanced: First tag of ±1σ often reverts toward VWAP.
• Trend: Persistent trade beyond ±1σ + IB break → target ±2σ/±3σ.
• Alerts: VWAP Cross and VWAP Reject (cross then immediate fail back).
4) IB breaks
• After IB completes, a clean IB break commonly targets 1.5× and sometimes 2.0×.
• Quick return inside IB = possible fade back to the opposite IB edge/VWAP.
• Alerts: IB Break Up / Down.
5) Gaps
• Gap-and-go: Opening drive away from prior close + VWAP support → trend until IB completion.
• Gap-fill: Weak open and VWAP overhead/underfoot → trade toward prior close; manage on Gap Filled alert.
Pro tip: Stack confluences (e.g., ONL sweep + VWAP reclaim + IB hold) and respect your execution rules (e.g., require a 5-minute close in direction, or your order-flow confirmation).
⸻
Inputs you’ll actually touch
• Sessions (ET): Session Timezone, RTH Session, Overnight Session.
• Visibility: toggles for PD/ON/VWAP/IB/Ref/Panel.
• VWAP bands: set σ multipliers (±1/±2/±3).
• IB: duration (minutes) and extension multipliers (1.5× / 2.0×).
• Style & Theme: Theme Preset, Main Line Width, Trackprice, Minimal Mode, and anti-overlap controls.
⸻
Alerts included
• PD Touch/Break — High ≥ PDH or Low ≤ PDL
• ONH Taken / ONL Taken — First in-RTH take of ONH/ONL
• VWAP Cross — Close crosses VWAP
• VWAP Reject — Cross then immediate fail back
• IB Break Up / Down — Break of IB High/Low after IB completes
• Gap Filled — Price trades back to prior RTH close
Setup: Add alert → Condition: Algo Index — Levels Pro → choose event → message → Notify on app/email.
⸻
Panel guide
The top-right panel shows each level plus live distance from last price:
LevelValue (Δpoints | Δticks)
Coloring: green if level is below current price, red if above.
⸻
Styling & screenshot tips
• Use Theme Preset that matches your chart.
• For dark charts, “Dark Hi-Contrast” with Main Line Width = 3 works well.
• Enable Trackprice for crisp axis tags that always stick to the right edge.
• Turn on Minimal Mode for cleaner screenshots (no VWAP bands or IB extensions, on-chart tags off; price-scale tags remain).
• If tags crowd, increase min separation (ticks) to 30–60 and horizontal offset to 3–5; add vertical jitter (4–12 ticks) and/or push tags farther right with baseline offset (bars).
⸻
Behavior & limitations
• Levels are computed incrementally; tables refresh on the last bar for efficiency.
• Right-edge labels are placed at bar_index + offset and do not track extra right-margin scrolling (TradingView limitation). The price-scale tags (from trackprice) do track the axis.
• “RTH” is what you define in inputs. If your market uses different day hours, change the session strings so PDH/PDL reflect your definition of “yesterday’s session.”
⸻
FAQ
Q: My PDH/PDL don’t match the daily chart.
A: By design this uses RTH-only highs/lows, not 24h daily bars. Adjust sessions if you want a different definition.
Q: Right-edge tags overlap or don’t sit at the far right.
A: Increase min separation / horizontal offset / vertical jitter and/or push tags farther with baseline offset. If you want markers that always hug the axis, rely on Trackprice.
Q: Can I change killzones?
A: Yes—edit the session strings in settings or request a version with user inputs for custom windows.
⸻
Disclaimer
Educational use only. This is not financial advice. Always apply your own risk management and confirmation rules.
⸻
Enjoy it? Please ⭐ the script and share screenshots using Minimal Mode + a Theme Preset that fits your style.

Advanced Volume Profile Pro Delta + POC + VAH/VAL# Advanced Volume Profile Pro - Delta + POC + VAH/VAL Analysis System
## WHAT THIS SCRIPT DOES
This script creates a comprehensive volume profile analysis system that combines traditional volume-at-price distribution with delta volume calculations, Point of Control (POC) identification, and Value Area (VAH/VAL) analysis. Unlike standard volume indicators that show only total volume over time, this script analyzes volume distribution across price levels and estimates buying vs selling pressure using multiple calculation methods to provide deeper market structure insights.
## WHY THIS COMBINATION IS ORIGINAL AND USEFUL
**The Problem Solved:** Traditional volume indicators show when volume occurs but not where price finds acceptance or rejection. Standalone volume profiles lack directional bias information, while basic delta calculations don't provide structural context. Traders need to understand both volume distribution AND directional sentiment at key price levels.
**The Solution:** This script implements an integrated approach that:
- Maps volume distribution across price levels using configurable row density
- Estimates delta (buying vs selling pressure) using three different methodologies
- Identifies Point of Control (highest volume price level) for key support/resistance
- Calculates Value Area boundaries where 70% of volume traded
- Provides real-time alerts for key level interactions and volume imbalances
**Unique Features:**
1. **Developing POC Visualization**: Real-time tracking of Point of Control migration throughout the session via blue dotted trail, revealing institutional accumulation/distribution patterns before they complete
2. **Multi-Method Delta Calculation**: Price Action-based, Bid/Ask estimation, and Cumulative methods for different market conditions
3. **Adaptive Timeframe System**: Auto-adjusts calculation parameters based on chart timeframe for optimal performance
4. **Flexible Profile Types**: N Bars Back (precise control), Days Back (calendar-based), and Session-based analysis modes
5. **Advanced Imbalance Detection**: Identifies and highlights significant buying/selling imbalances with configurable thresholds
6. **Comprehensive Alert System**: Monitors POC touches, Value Area entry/exit, and major volume imbalances
## HOW THE SCRIPT WORKS TECHNICALLY
### Core Volume Profile Methodology:
**1. Price Level Distribution:**
- Divides price range into user-defined rows (10-50 configurable)
- Calculates row height: `(Highest Price - Lowest Price) / Number of Rows`
- Distributes each bar's volume across price levels it touched proportionally
**2. Delta Volume Calculation Methods:**
**Price Action Method:**
```
Price Range = High - Low
Buy Pressure = (Close - Low) / Price Range
Sell Pressure = (High - Close) / Price Range
Buy Volume = Total Volume × Buy Pressure
Sell Volume = Total Volume × Sell Pressure
Delta = Buy Volume - Sell Volume
```
**Bid/Ask Estimation Method:**
```
Average Price = (High + Low + Close) / 3
Buy Volume = Close > Average ? Volume × 0.6 : Volume × 0.4
Sell Volume = Total Volume - Buy Volume
```
**Cumulative Method:**
```
Buy Volume = Close > Open ? Volume : Volume × 0.3
Sell Volume = Close ≤ Open ? Volume : Volume × 0.3
```
**3. Point of Control (POC) Identification:**
- Scans all price levels to find maximum volume concentration
- POC represents the price level with highest trading activity
- Acts as significant support/resistance level
- **Developing POC Feature**: Tracks POC evolution in real-time via blue dotted trail, showing how institutional interest migrates throughout the session. Upward POC migration indicates accumulation patterns, downward migration suggests distribution, providing early trend signals before price confirmation.
**4. Value Area Calculation:**
- Starts from POC and expands up/down to encompass 70% of total volume
- VAH (Value Area High): Upper boundary of value area
- VAL (Value Area Low): Lower boundary of value area
- Expansion algorithm prioritizes direction with higher volume
**5. Adaptive Range Selection:**
Based on profile type and timeframe optimization:
- **N Bars Back**: Fixed lookback period with performance optimization (20-500 bars)
- **Days Back**: Calendar-based analysis with automatic timeframe adjustment (1-365 days)
- **Session**: Current trading session or custom session times
### Performance Optimization Features:
- **Sampling Algorithm**: Reduces calculation load on large datasets while maintaining accuracy
- **Memory Management**: Clears previous drawings to prevent performance degradation
- **Safety Constraints**: Prevents excessive memory usage with configurable limits
## HOW TO USE THIS SCRIPT
### Initial Setup:
1. **Profile Configuration**: Select profile type based on trading style:
- N Bars Back: Precise control over data range
- Days Back: Intuitive calendar-based analysis
- Session: Real-time session development
2. **Row Density**: Set number of rows (30 default) - more rows = higher resolution, slower performance
3. **Delta Method**: Choose calculation method based on market type:
- Price Action: Best for trending markets
- Bid/Ask Estimate: Good for ranging markets
- Cumulative: Smoothed approach for volatile markets
4. **Visual Settings**: Configure colors, position (left/right), and display options
### Reading the Profile:
**Volume Bars:**
- **Length**: Represents relative volume at that price level
- **Color**: Green = net buying pressure, Red = net selling pressure
- **Intensity**: Darker colors indicate volume imbalances above threshold
**Key Levels:**
- **POC (Blue Line)**: Highest volume price - major support/resistance
- **VAH (Purple Dashed)**: Value Area High - upper boundary of fair value
- **VAL (Orange Dashed)**: Value Area Low - lower boundary of fair value
- **Value Area Fill**: Shaded region showing main trading range
**Developing POC Trail:**
- **Blue Dotted Lines**: Show real-time POC evolution throughout the session
- **Migration Patterns**: Upward trail indicates bullish accumulation, downward trail suggests bearish distribution
- **Early Signals**: POC movement often precedes price movement, providing advance warning of institutional activity
- **Institutional Footprints**: Reveals where smart money concentrated volume before final POC establishment
### Trading Applications:
**Support/Resistance Analysis:**
- POC acts as magnetic price level - expect reactions
- VAH/VAL provide intermediate support/resistance levels
- Profile edges show areas of low volume acceptance
**Developing POC Analysis:**
- **Upward Migration**: POC moving higher = institutional accumulation, bullish bias
- **Downward Migration**: POC moving lower = institutional distribution, bearish bias
- **Stable POC**: Tight clustering = balanced market, range-bound conditions
- **Early Trend Detection**: POC direction change often precedes price breakouts
**Entry Strategies:**
- Buy at VAL with POC as target (in uptrends)
- Sell at VAH with POC as target (in downtrends)
- Breakout plays above/below profile extremes
**Volume Imbalance Trading:**
- Strong buying imbalance (>60% threshold) suggests continued upward pressure
- Strong selling imbalance suggests continued downward pressure
- Imbalances near key levels provide high-probability setups
**Multi-Timeframe Context:**
- Use higher timeframe profiles for major levels
- Lower timeframe profiles for precise entries
- Session profiles for intraday trading structure
## SCRIPT SETTINGS EXPLANATION
### Volume Profile Settings:
- **Profile Type**: Determines data range for calculation
- N Bars Back: Exact number of bars (20-500 range)
- Days Back: Calendar days with timeframe adaptation (1-365 days)
- Session: Trading session-based (intraday focus)
- **Number of Rows**: Profile resolution (10-50 range)
- **Profile Width**: Visual width as chart percentage (10-50%)
- **Value Area %**: Volume percentage for VA calculation (50-90%, 70% standard)
- **Auto-Adjust**: Automatically optimizes for different timeframes
### Delta Volume Settings:
- **Show Delta Volume**: Enable/disable delta calculations
- **Delta Calculation Method**: Choose methodology based on market conditions
- **Highlight Imbalances**: Visual emphasis for significant volume imbalances
- **Imbalance Threshold**: Percentage for imbalance detection (50-90%)
### Session Settings:
- **Session Type**: Daily, Weekly, Monthly, or Custom periods
- **Custom Session Time**: Define specific trading hours
- **Previous Sessions**: Number of historical sessions to display
### Days Back Settings:
- **Lookback Days**: Number of calendar days to analyze (1-365)
- **Automatic Calculation**: Script automatically converts days to bars based on timeframe:
- Intraday: Accounts for 6.5 trading hours per day
- Daily: 1 bar per day
- Weekly/Monthly: Proportional adjustment
### N Bars Back Settings:
- **Lookback Bars**: Exact number of bars to analyze (20-500)
- **Precise Control**: Best for systematic analysis and backtesting
### Visual Customization:
- **Colors**: Bullish (green), Bearish (red), and level colors
- **Profile Position**: Left or Right side of chart
- **Profile Offset**: Distance from current price action
- **Labels**: Show/hide level labels and values
- **Smooth Profile Bars**: Enhanced visual appearance
### Alert Configuration:
- **POC Touch**: Alerts when price interacts with Point of Control
- **VA Entry/Exit**: Alerts for Value Area boundary interactions
- **Major Imbalance**: Alerts for significant volume imbalances
## VISUAL FEATURES
### Profile Display:
- **Horizontal Bars**: Volume distribution across price levels
- **Color Coding**: Delta-based coloring for directional bias
- **Smooth Rendering**: Optional smoothing for cleaner appearance
- **Transparency**: Configurable opacity for chart readability
### Level Lines:
- **POC**: Solid blue line with optional label
- **VAH/VAL**: Dashed colored lines with value displays
- **Extension**: Lines extend across relevant time periods
- **Value Area Fill**: Optional shaded region between VAH/VAL
### Information Table:
- **Current Values**: Real-time POC, VAH, VAL prices
- **VA Range**: Value Area width calculation
- **Positioning**: Multiple table positions available
- **Text Sizing**: Adjustable for different screen sizes
## IMPORTANT USAGE NOTES
**Realistic Expectations:**
- Volume profile analysis provides structural context, not trading signals
- Delta calculations are estimations based on price action, not actual order flow
- Past volume distribution does not guarantee future price behavior
- Combine with other analysis methods for comprehensive market view
**Best Practices:**
- Use appropriate profile types for your trading style:
- Day Trading: Session or Days Back (1-5 days)
- Swing Trading: Days Back (10-30 days) or N Bars Back
- Position Trading: Days Back (60-180 days)
- Consider market context (trending vs ranging conditions)
- Verify key levels with additional technical analysis
- Monitor profile development for changing market structure
**Performance Considerations:**
- Higher row counts increase calculation complexity
- Large lookback periods may affect chart performance
- Auto-adjust feature optimizes for most use cases
- Consider using session profiles for intraday efficiency
**Limitations:**
- Delta calculations are estimations, not actual transaction data
- Profile accuracy depends on available price/volume history
- Effectiveness varies across different instruments and market conditions
- Requires understanding of volume profile concepts for optimal use
**Data Requirements:**
- Requires volume data for accurate calculations
- Works best on liquid instruments with consistent volume
- May be less effective on very low volume or exotic instruments
This script serves as a comprehensive volume analysis tool for traders who need detailed market structure information with integrated directional bias analysis and real-time POC development tracking for informed trading decisions.

Volume Pressure Analysis - Live DataVolume Pressure Gauge and Volume Percentage Indicator – Pine Script Guide
This indicator provides a simplified, real-time visualization of both volume pressure (buy vs. sell activity) and today’s trading volume in comparison to historical averages. It is designed to help traders assess whether buyers or sellers dominate the current session and whether today’s volume is significant relative to recent behaviour.
________________________________________
Key Functional Segments
1. Inputs and Configuration
Users can configure the length of the Simple Moving Average (SMA) used to calculate average volume, set the position of the gauge table on the chart, and toggle the visibility of the volume pressure display. This allows flexibility in integrating the tool with various trading styles and chart layouts.
2. Volume Data Calculations
The indicator calculates three key volume metrics:
• volToday: The current day’s volume.
• volAvg: The average volume over the user-defined SMA period (default is 20 bars).
• volPct: The current volume as a percentage of the average.
This enables traders to quickly recognize whether current trading activity is above or below normal, which can be a precursor to potential trend strength or weakness.
3. Volume Pressure Calculation
The script estimates buying and selling pressure based on price movement and volume. It distributes volume into upward (buy) and downward (sell) segments and expresses them as percentages of the total volume. This gives an immediate sense of whether bulls or bears are more active in the current session.
4. Visual Representation (Progress Bars)
The indicator renders a simplified visual gauge using horizontal bar segments (pseudo-bars) to reflect the proportion of buy and sell pressure. The length of each bar correlates with the strength of pressure from buyers or sellers, helping users assess dominance without analyzing candlestick behavior in depth.
5. Table Display
A compact table is drawn on the chart showing:
• Buy pressure percentage and corresponding bar.
• Sell pressure percentage and corresponding bar.
• Volume percentage compared to the recent average.
This format makes it easy to evaluate volume dynamics at a glance, without cluttering the price chart or relying on separate overlays.
________________________________________
How Traders Benefit from This Indicator
• Momentum Shift Detection: Early signs of trend reversal can be observed when volume pressure flips direction.
• Breakout Validation: High volume combined with dominant pressure supports the credibility of breakout moves.
• False Move Avoidance: If price moves on low volume or mixed pressure, traders can avoid low-probability entries.
• Market Context Awareness: Users can assess whether a day is behaving normally in terms of participation or is unusually quiet or aggressive.
________________________________________
Basic Usage Guide
1. Add the script to your TradingView chart and set your preferred SMA length for volume comparison.
2. Customize the table’s position using the X and Y settings for clarity and alignment.
3. Interpret the outputs:
o A higher red bar indicates dominant sell pressure.
o A higher green bar indicates dominant buy pressure.
o Volume % above 100% suggests above-average activity, while values below 100% may imply low conviction.
4. Apply to trading decisions:
o High buy pressure and high volume may indicate a strong long opportunity.
o High sell pressure and high volume may support short setups.
o Low volume or conflicting signals may call for caution.
5. Combine with other tools such as trend indicators, support/resistance zones, or price action patterns for more reliable trade setups.
________________________________________
Practical Example
• Sell Pressure: 70% → Suggests strong seller control; potential for short setups.
• Buy Pressure: 30% → Weak buying interest; long trades may carry risk.
• Volume Percentage: 120% → Indicates a surge in participation; movement may have greater validity.
________________________________________
Tips for New Traders
• Use this indicator as a confirmation tool rather than a standalone strategy.
• Begin on higher timeframes (4-hour or daily) to develop familiarity.
• Compare multiple examples to identify reliable patterns over time.
• Always incorporate proper risk management, including stop losses.
________________________________________
Disclaimer from aiTrendview
This indicator is intended solely for educational and informational use. It does not constitute investment advice, trade signals, or financial recommendations. aiTrendview and its affiliates are not liable for any trading losses incurred through use of this tool. All trading involves risk. Past performance of any indicator does not guarantee future results. Users should conduct independent research and consult with a certified financial advisor before making any trading decisions.
