PowerDays - Day of the Week HUDDescription: Midnight HUD & Daily Session Dividers
This indicator is designed to provide a clean, "Heads-Up Display" (HUD) for daily session tracking. It solves the common problem of cluttered charts by pinning the days of the week to the top of the chart window in a perfectly horizontal line, ensuring they remain visible and aligned regardless of price volatility or vertical scrolling.
Key Features:
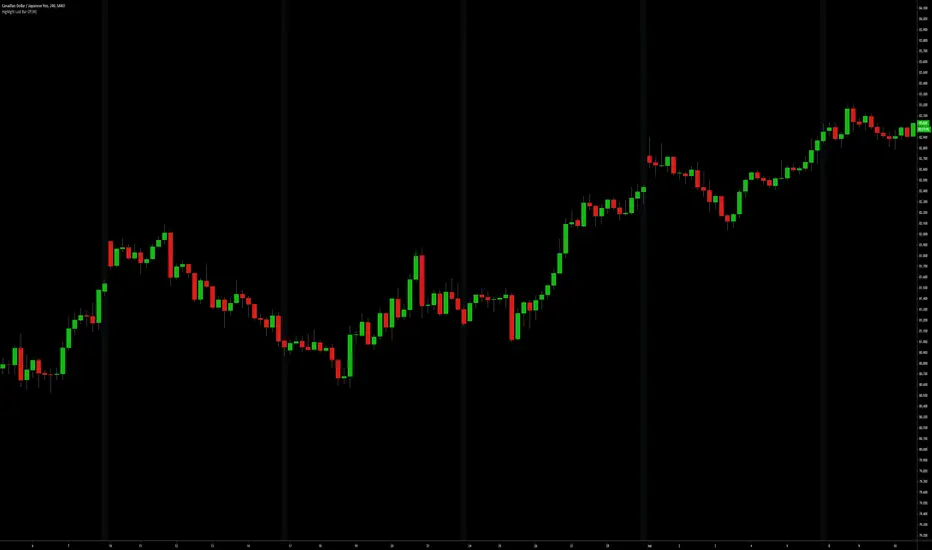
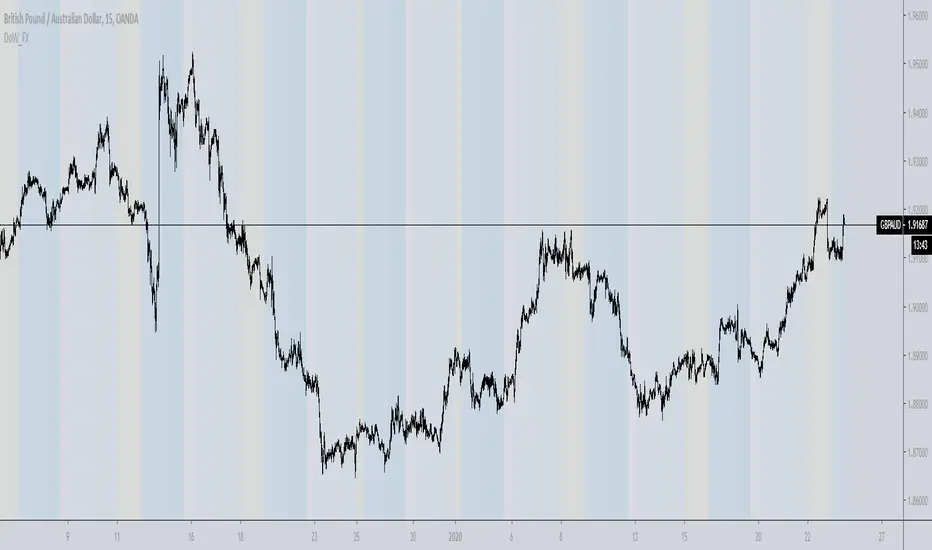
Strict Midnight Dividers: Unlike standard "New Day" indicators that trigger at the exchange open (which can be 6:00 PM for some futures or forex pairs), this indicator plots a vertical dashed line at exactly 00:00 based on your chart's time zone.
Centered HUD Labels: Days of the week (MONDAY, TUESDAY, etc.) are plotted in a level horizontal row at the top of the pane. Labels are mathematically centered between midnight dividers to provide a clear visual of the current trading day’s range.
"Error-Proof" Architecture: Built using primitive plotting methods to avoid common Pine Script "Undeclared Identifier" errors, ensuring high compatibility across different TradingView versions and devices.
Fully Customizable: Includes a built-in color picker to adjust the Royal Blue labels and session dividers to match your specific chart theme.
Pine Script®指標