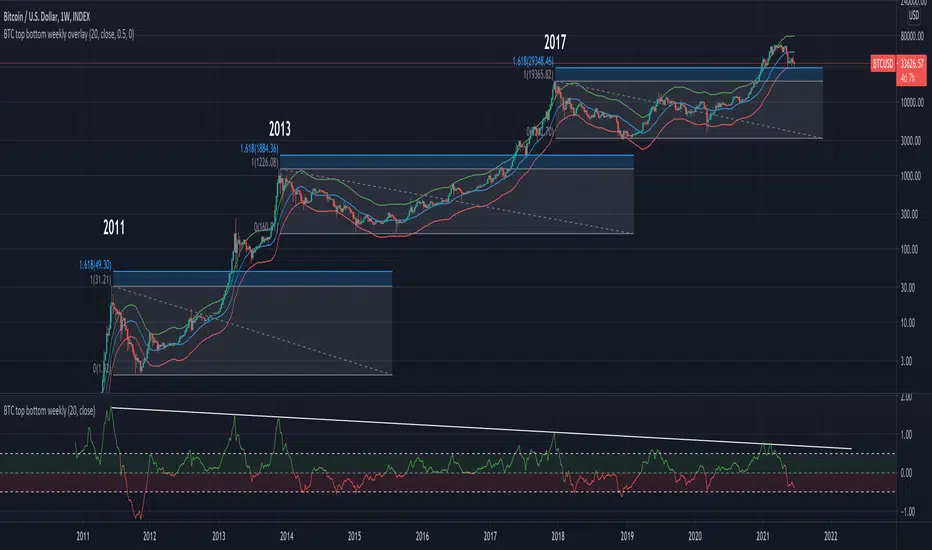
BTC top bottom weekly bandsThis indicator is based on the 20 weekly simple moving average and it could be used to help finding potential tops and bottoms on a weekly BTC chart.
When using the provided "coef" parameter set to the default of 0.5 it shows how most bottoms since 2013 have hit the lower band of this indicator.
The lower band is calculated as exp(coef) * sma(close)
Instructions:
- Use with the symbol INDEX:BTCUSD so you can see the price since 2010
- Set the timeframe to weekly
- Use logarithmic chart (toggle "log" on)
Optionals:
- change the coef to 0.6 for a more conservative bottom
- change the coef to 0.4 for a more conservative top
週圖表
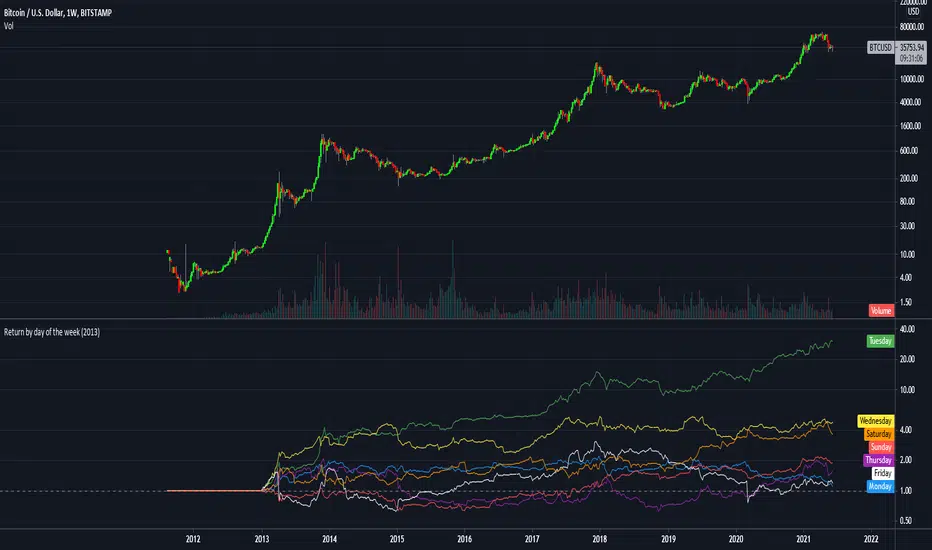
Return by day of the weekBuy on Mondays sell on Tuesdays.
Just a simple tracking of returns.
It works only on the weekly charts
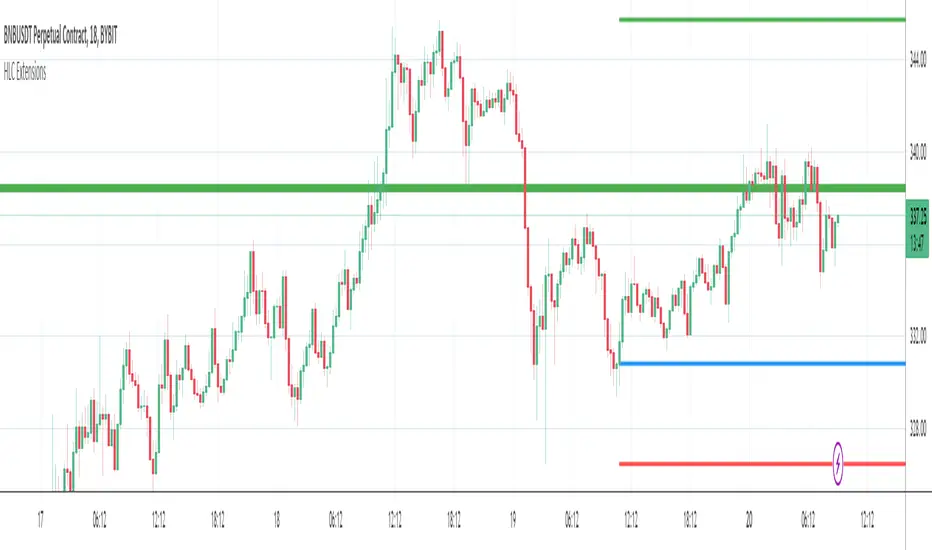
Yesterdays & Last Weeks High Low Close ExtensionsPlots the Extensions of Yesterdays and Last Weeks High Low Close
Unfortunately all of the levels wont always show therefore it is good use this in conjunction with my Levels script
I tried to combine the 2 scripts but doing so gave me memory overload errors in Tradingview thats why I have made them separate
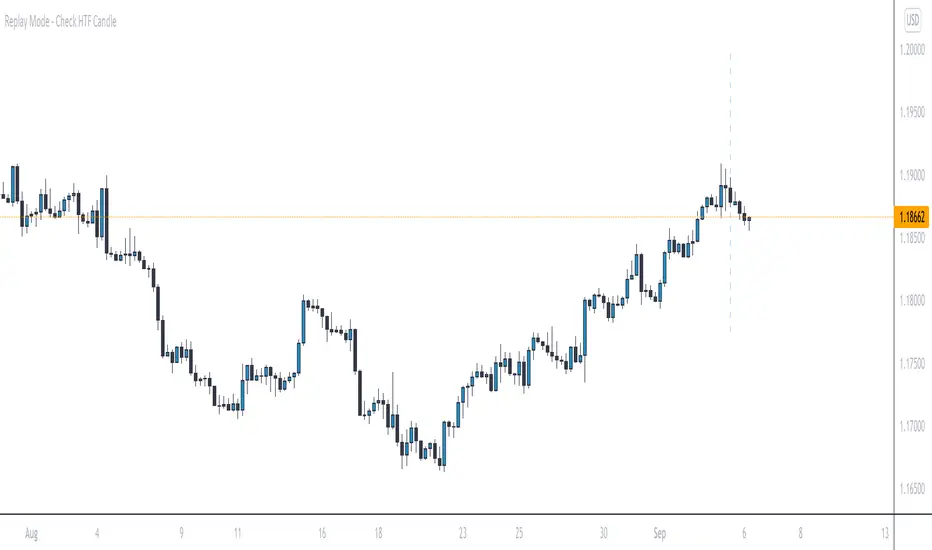
Replay Mode - Check HTF CandleThis indicator is intended to be used while using Replay Mode.
A vertical line will be drawn when you can safely check the 4H, Daily, or Weekly candle without seeing future price.
It is similar to the built-in Session Breaks, but has the benefit of not needing to remove one candle before checking the Daily.
When the line is the color of your 4H settings, it is safe to check the 4H candle.
When the line is the color of your Daily settings, it is safe to check the 4H and Daily candles.
When the line is the color of your Weekly settings, it is safe to check the 4H, Daily and Weekly candles
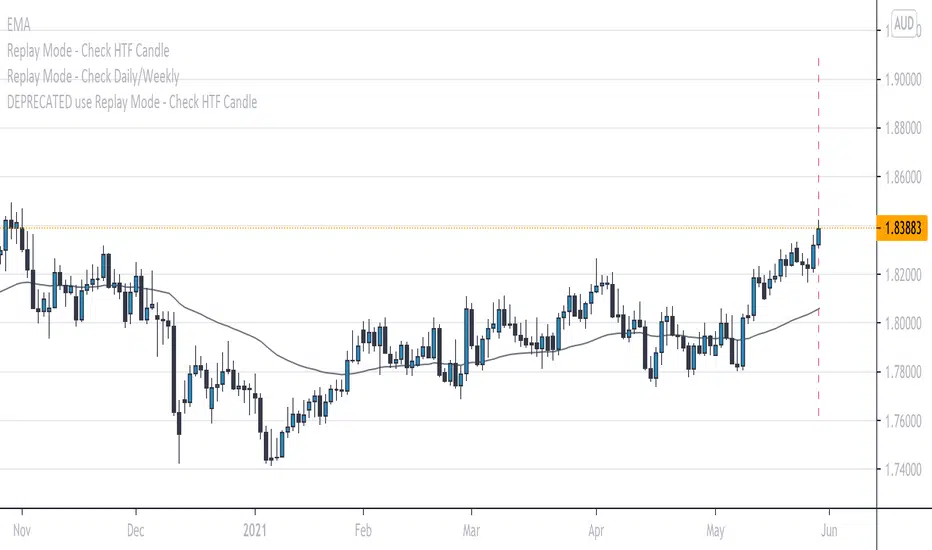
Replay Mode - Check Daily/WeeklyThis indicator is intended to be used while using Replay Mode.
It is similar to the built-in Session Breaks, but has the benefit of not needing to remove one candle before checking the Daily.
When on an intraday chart (timeframe less than Daily), a vertical line will be drawn when you can safely check the Daily or Weekly candle without seeing future price.
When the line is the color of your Daily settings, it is safe to check the Daily candle.
When the line is the color of your Weekly settings, it is safe to check both the Daily and Weekly candle.

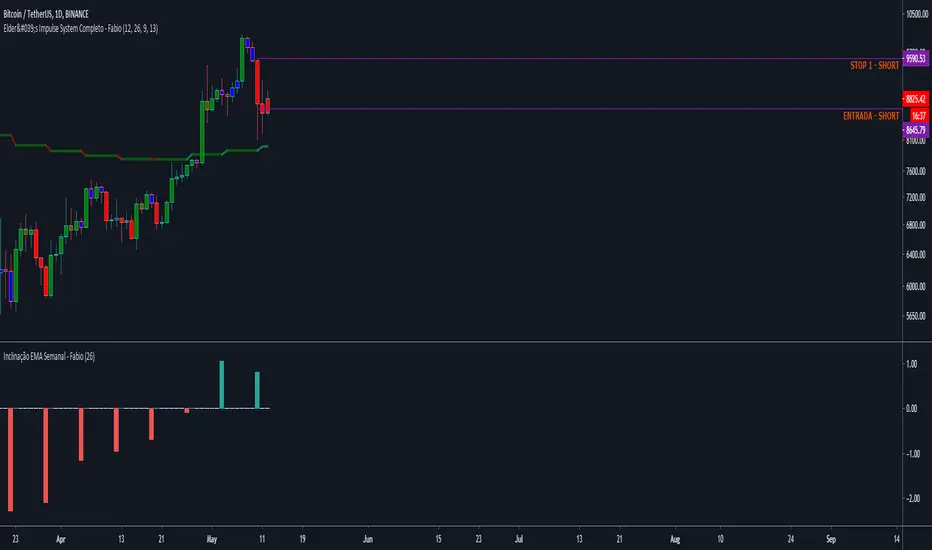
First Week Trend [MX]I created this indicator based on one of my ways of analyzing the BTC trend in particular, I noticed that the break of the first weekly candle usually indicates the trend for the rest of the month.
This indicator has a bug in which if you change the timeframe of the indicator it will show erroneous values
If you use the candlestick chart, you will need to pull the visual order of this indicator to the top to overlay the colors of the standard candles, or simply hide the standard candles
the trend colors are bugged in timeframes other than the weekly
special thanks to @xdecow who helped me with the code
////////////////////////////////////////////////////////////////////////
Eu criei esse indicador baseado em uma das minhas formas de analisar a tendência do BTC em específico, eu notei que o rompimento do primeiro candle do semanal costuma indicar a tendência para o resto do mês.
Esse script tem um bug em que se mudar o timeframe do indicador ele irá mostrar valores errados
Se você usa o gráfico de candlesticks, você precisará puxar para o topo a ordem visual desse indicador para sobrepor as cores do candles padrões, ou simplesmente ocultar os candles padrões
as cores da tendencia estão bugados em outros timeframes diferentes do semanal
agradecimentos especiais ao @xdecow que me ajudou no código

Pre and Market OpeningsPre and Market Openings is to enable you to quickly visualize the opening markets and how they could influence trading.
The below script has used the market time data from the below links:
Tokyo/Asia www.tradinghours.com
London www.tradinghours.com
New York www.tradinghours.com
The below script aims to plot:
Daily Asia Open
Weekly Asia Open
Daily London Open
Weekly London Open
Daily New York Open
Weekly New York Open
Using background colour it also shows market sessions (pre-market) for London and New York and regular for London, New York and Asia.
There is also plotted text for days of the week and sessions.
As you can see from the picture below that these market openings can act as support and resistance:
BTC
ETH

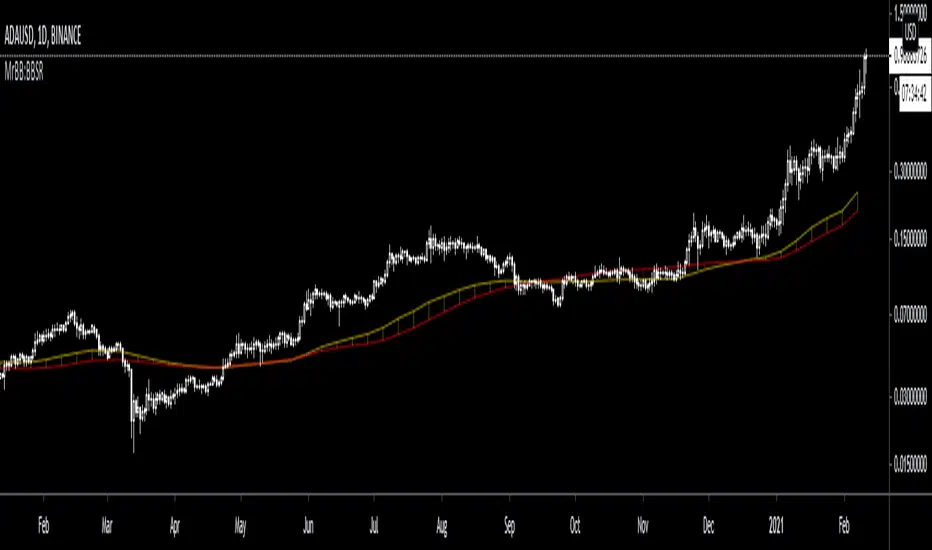
MrBB:BullBear Support BandVery simple and effective S/R band. Created bycombining the weekly 21EMA and weekly 20SMA, it provides strong support/resistance depending on market direction, and works as a basing area for retraces during parabolic (and normal) bull markets.
Key Levels SpacemanBTC IDWMKey levels, plotted automatically
Additional timeframes can be added on request
Useful for seeing strength of the trend in the market

Weekly/Daily/Hourly/Minutes Colored Background IntervalsThis is my "Weekly/Daily/Hourly/Minutes Colored Background Intervals" assistant. I wouldn't describe it as an indicator, it just exhibits coloration of referenced periods of time with bgcolor() in Pine. With the arrival of 2021, I pondered the necessity of needing a visualization pre-2021 to visually recognize periodicity of market movements by the week, day, hour, or an adjustable period of minutes. While this script is simply generic, I hope you may find useful in your endeavors as a member on TradingView.
Explaining the script's usage, the "Minutes" input can be adjusted from anywhere between 5-55 minutes for only intraday. This can be modified to accommodate 90 minutes (1.5hrs) or any other minutes period desirable by tweaking certain numbers up to 1440. Minutes and Hourly backgrounds are disabled by default for most daily traders. Changing the input() code to `true` will provide them on by default when the script loads, if you choose that route. Each time periods background color is enable/disable capable. All of the colors are easily adjustable to any combination you can ponder for your visual acuity with the color swatch provided by input(type=input.color). The coloring can be "swapped" by input() depending on how you wish to start and end the day visually. I thought this would come in handy. The weekly background can have different starting points, whether it be Sunday, Monday, or any other day such as Friday for example.
The entire script's contents isn't intended for complete re-use as is for publicly published scripts. It's more along the lines of code that could be used to personally modify indicators you have, depending on the time frames you may actually be trading on. The code is basically modular, so you can use bits and pieces of it in your personally modified Pine Editor scripts that you wish to customize for yourself. I will say that the isXxx() functions are completely reusable in any script without any need for author permission inquiries from me, as easy as copy and paste. Those may come in handy for many folks. If you find them useful in certain circumstances, use isXxx() functions as you please. Day of the week detection by functions will have applications beyond my current intended use for them.
Of notable mention, this is a miniature lesson by example of how the new input(type=input.color) may be used. I'm also using `var` inside functions to aid in computational efficiency of the script runtime. The colors are permanently stored at the very beginning of the scripts operation inside the function and just reused from that point onward. Its a rare use case, but well suited for this scripts intention. Once again I have demonstrated the "Power of Pine" for developers of any experience level to learn from via code elegance.
When available time provides itself, I will consider your inquiries, thoughts, and concepts presented below in the comments section, should you have any questions or comments regarding this indicator. When my indicators achieve more prevalent use by TV members , I may implement more ideas when they present themselves as worthy additions. Have a profitable future everyone!

Heiken Ashi MTF Strategy- IndicatorHello, this is both a strategy and indicator that revolves around Heikin Ashi candles.
In this case we take 3 different time frames, in this example we use daily , weekly and monthly.
The conditions for entry are :
For long : we check that we have a green daily candle, at the same time we check that the weekly and monthly candles are also green.
For short : We check that all candles, daily, weekly and monthly and red.
For exit of long : as soon as 1 of the 3 candles, daily or weekly or monthly converts to red, we exit.
For exit of short : as soon as 1 of the 3 candles converts to green, we exit.
This strategy- indicator can be adapted to any type of market.

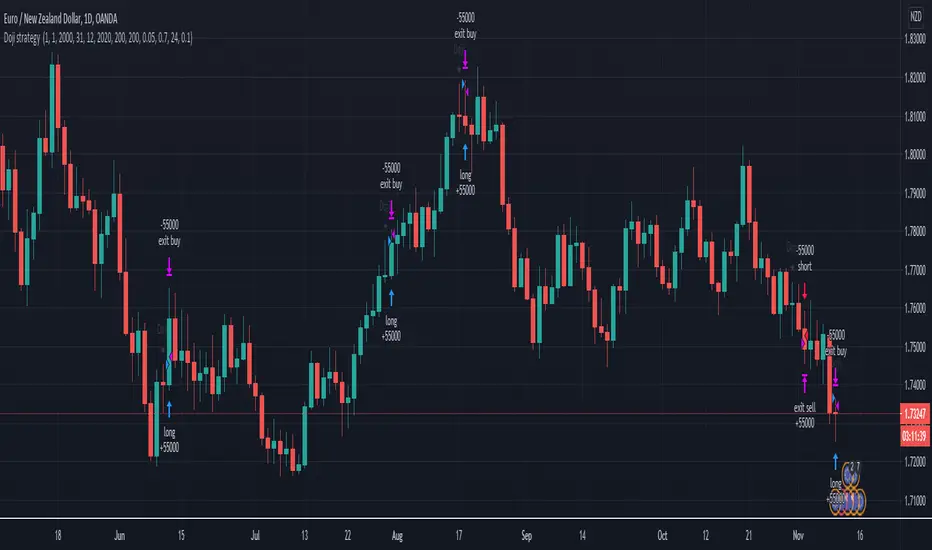
Doji swing strategyThis is a simple strategy based on Doji star candlestick
This strategy is suited for big time frames, like 4h -1Day and so on.
It places two orders: long at doji star high or previous candle high and short at doji star low or previous candle low.
It can also be applied volume average, in order to filter between trades .
This strategy works very well with high time frames like Weekly TF because it eliminates the noise in doji formation.
It also has inside a risk management made of SL/TP , or if not prefered it can exit based on a exit condition.
If you have any questions, please let me know !
EMA with time-interval dependant visiblity settingThis scrip exposes 4 Exponential Moving Average (EMA) indicators which their visibility can be set to a daily or weekly time-frame (aka intervals). Based on your current chart time-frame, the matching EMA indicators come on and off.
This helps to have meaningful EMAs relevant to your time internal.
In a traditional 10 EMA indicates a plotted indicator would bear a meaning of a 10 day EMA when in daily and 10 week EMA when in weekly chart which may or may not be useful as some who for example only require a 10 week EMA for thier analysis and wouldn't want to cloud a daily chart with an EMA which won't resemble a valuable output for this particular user.
With EMA+, you can choose to see the 10 week EMA only when your chart is in the weekly time interval, so when switched to a daily interval a 10x EMA is not shown anymore.
If you prefer to see a 10 week EMA and a 21 day EMA on the other hand, you will only have 1 EMA shown when in weekly mode which is a 10 week EMA and one EMA when in daily mode with is 21 day EMA.

Monthly MA Close Generates buy or sell signal if monthly candle closes above or below the signal MA.
Long positions only.
Inputs:
-Change timeframe MA
-Change period MA
-Use SMA or EMA
-Display MA
-Use another ticker as signal
-Select time period for backtesting
This script is not necessarily written to maximize profits, but to minimize losses.
Although it can outperform 'Buy & Hold' on some occasions when there is a multiple month bearisch trend.
You can optimise this strategy by changing the signal MA inputs.
I would suggest aiming for the best Profit Factor starting from the monthly ("M") setting.
You can always fine-tune the results at a lower timeframe.
The option to use another ticker for providing signals can give you a more stable and unified results.
For example using AMEX:SPY as signal with default parameters gives better results with NASDAQ:AAPL than if you would use NASDAQ:AAPL itself.
I used the anti-repainting function from PineCoders to prevent repainting.
This script is best used for multi-month trading positions & Daily or 4H setting of your chart.

MTF Ichimoku CloudIchimoku Cloud , Multiple Time Frames, based on the script : MTF Selection Framework functions (PineCoders)
Possible display:
- four differents Ichimoku
- Tenkan, Kijun, Chikou and Kumo (monochrome or not)
- labels : offset from line, color if you change style and with/without abbreviation
Time Frames :
- 1m
- 3m
- 5m
- 15m
- 30m
- 45m
- 1h
- 2h
- 3h
- 4h
- Daily
- Weekly
- Monthly

Superstock 10-30 WMA Band script I was reading Jesse Stine's Insider Buy Superstocks book, and one of the technical traits he mentioned of a superstock (read the book, seriously, very strongly recommended) was a breakout above the 30 weekly moving average. He goes on to mention that after breakout, the 10 WMA often acts as a support line where you can add to your position. This script is inspired by the visual direction of Chris Moody's slingshot system, and how it displays MA's. The skinny line is the 10 WMA and the bigger line is the 30.

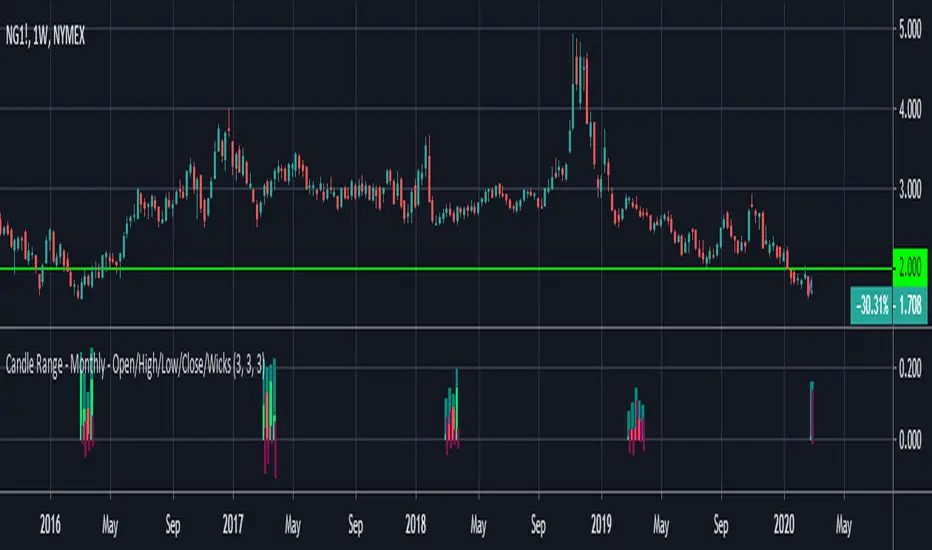
Candle Range - Monthly - Open/High/Low/Close/Wicks (Oldinvestor)This candle range comparison is similar to my original script Candle Range Compare .
This script is to compares the size of open/close high/low and wick size side by side. This version of the script allows you to only show a chosen month of each year to compare. I hadn't even thought to try and vanish the part of the chart I'm not looking at. I'll consider that later (may never happen, I am limited on time).
I have also included check boxes to turn on/off certain candles. This part is pretty self explanatory. For example: if you wish to not see wicks in front of the open/close, go to the settings for the study and uncheck the box for "Show Wicks".
Warning: The script does not work so well on monthly candles? Some of the candles are missing...
Good luck
Oldinvestor
Custom Time ranges. Daily price ranges.Addition to previous time range script, now containing daily ranges. You can select a day of the week, and have it show the high, low, mid, and open of that day.
For the time bands:
Monday = 2
Tuesday = 3
Wednesday = 4
Thursday = 5
Friday = 6
Saturday = 7
Sunday = 1
Example 1:
1500-1800:2
This will colour the background between 3pm and 6pm on Mondays.
Example 2:
0000-0600:247
This will colour the background between midnight and 6am on Mondays, Wednesdays, and Saturdays.
For the Daily price ranges:
Just select the tick-box forthe day, and then the price levels you'd like to see.
I want to add specific weekly levels to this, for example: week 06 of year 2020, but I've not figured out how to do it yet. If anyone knows, I'd appreciate it if you let me know. I'll then update this script.
As always, any questions you may have, please leave in comments below and I'll respond when I have time.
If you notice anything good with this indicator, let me know. We are all in this to make money after all! ;)

RVC-Weekly-Pivots-GANN-LevelsPurpose:
Weekly - Fibonacci pivot levels and Gann levels calculation and marking on Chart automatically.
Mainly expected to use for trading on NIFTY and BankNifty
Kindly share your comments and suggestions to improve

MultiTimeFrame Fractals D W M [xdecow]This indicator shows fractals in different timeframes. With the possibility of coloring the bars with any combination of current, daily, weekly and monthly timeframes.
The return points are calculated as follows:
high > last 3 highs and close above highest low
low < last 3 lows and closes below lowest high
The direction of higher timeframes fractals tend to be more durable and reliable. This indicator helps to find the fractal alignment of different timeframes, so that you can look for trade opportunities in the same direction as the higher timeframes and improve your chances.

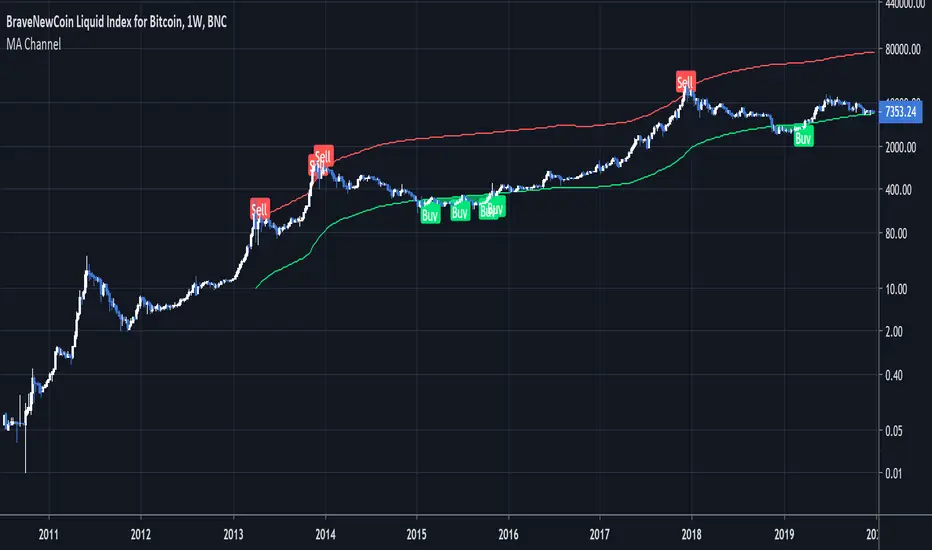
Moving Average ChannelIntended for use on BTC long term (BNC:BLX Weekly) with Logarithmic charts only
As Bitcoin is adopted, it moves through market cycles. These are created by periods where market participants are over-excited causing the price to over-extend, and periods where they are overly pessimistic where the price over-contracts. Identifying and understanding these periods can be beneficial to the long term investor. This long term investment tool is a simple and effective way to highlight those periods.
Buying Bitcoin when the price drops below the green line has historically generated outsized returns. Selling Bitcoin when price goes above the red line has been historically effective for taking profits.
NOTE: 144 Week = 2¾ Years. 104 Weeks = 2 Years. Originally created by Philip Swift