Delta Volume Weighted - IntradayResets at the start of the day's session (9:50 am on the ASX).
Takes the first candle and checks if its a green candle (close > open), and adds the volume to a total (which starts at 0 at the start of the day).
Subtracts it if the candles in red.
Continues to do this along with all the candles.
The volume is also multiplied by the difference between open and close so that large candles with large volume have more weight and move the indicator more.
Weighted

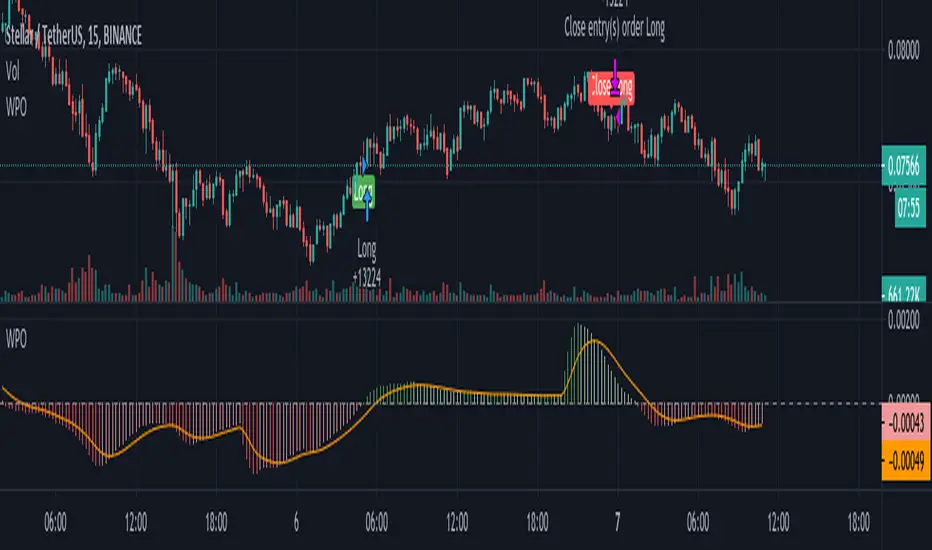
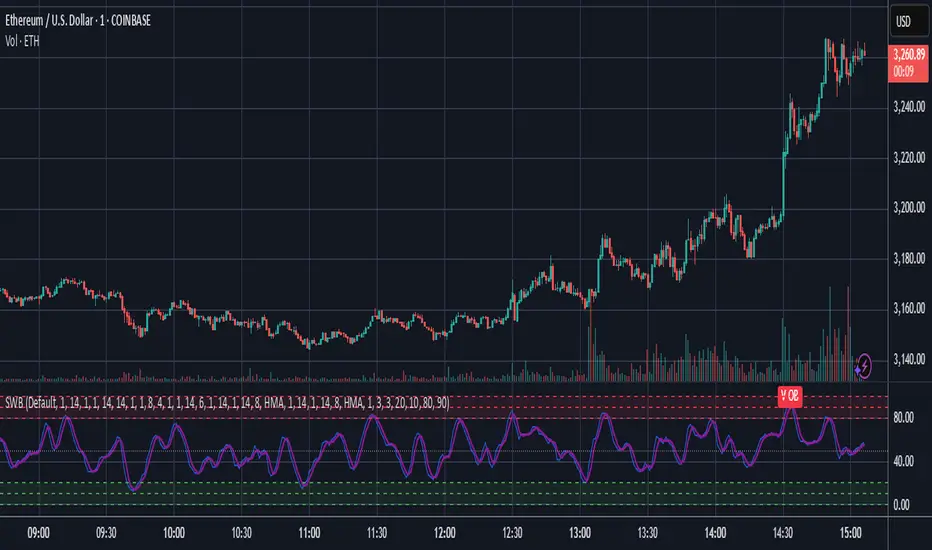
Weighted Price OscillatorThis is the study version of the Weighted Price Oscillator (STRATEGY) indicator.
Weighted Price Oscillator is an unique indicator that shows the relationship between two custom variables that trigger signals upon specific conditions. When WPO (short for weighted price oscillator ) crosses over the signal or zero line, it creates a buy signal and conversely below the signal or zero line, it generates a take profit signal. All of which are provided that the specific conditions are met.
Inside the script's options, the following options are: signal sensitivity, enable signal background color, and take profit percentage. The signal sensitivity allows you to adjust the script's trigger sensitivity, so that the script can fire signals appropriate for a specific timeframe. Enabling signal background color will provide a visual on the oscillator when a buy or take profit signal is being created. And lastly, the take profit percentage option is for configuring the trade size percentage of which you want to take profit with.
PM me for access.
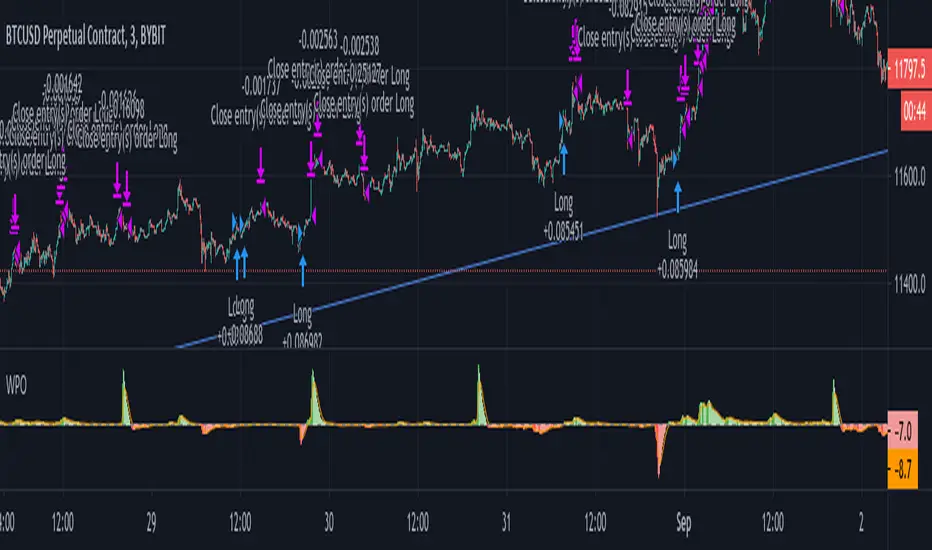
Weighted Price Oscillator (STRATEGY)Weighted Price Oscillator is an unique indicator that shows the relationship between two custom variables that trigger signals upon specific conditions. When WPO (short for weighted price oscillator) crosses over the signal or zero line, it creates a buy signal and conversely below the signal or zero line, it generates a take profit signal. All of which are provided that the specific conditions are met.
Inside the script's options, the following options are: signal sensitivity, enable signal background color, and take profit percentage. The signal sensitivity allows you to adjust the script's trigger sensitivity, so that the script can fire signals appropriate for a specific timeframe. Enabling signal background color will provide a visual on the oscillator when a buy or take profit signal is being created. And lastly, the take profit percentage option is for configuring the trade size percentage of which you want to take profit with.
PM me for access.
Volume Weighted DeviationsVolume !weighted!
deviations.
Important: I don't really know how people generally compute deviations from VWAP/VWMA, but smth tells me generally it's just a Av Dev/St Dev based on mean, not on appropriate basis, like volume weighted mean in our case. This version is mathematically correct, it first calculates weighted mean, than utilizes this weighted in mean in AvDev & StDef functions modified to take into account weights.

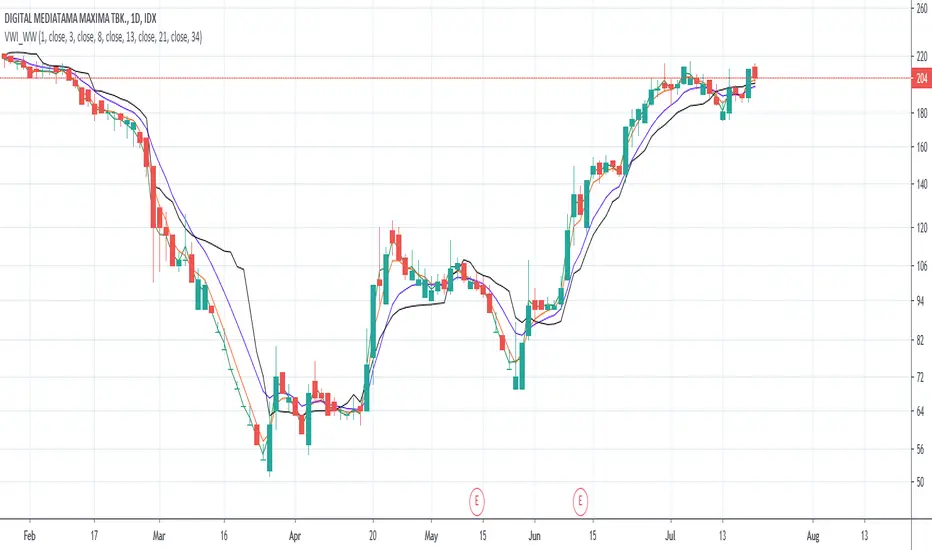
Volume-Weighted Indicators VWMA/VWAP/EMA_by WWAs traders and investors now urge to console volume factors into their price action analysis. This script is an attempt to combine volume-weighted moving average (VWMA), volume-weighted average price (VWAP), along with the exponential moving average (EMA). I have found that this indicator works quite well with the stock market.
How to use the indicator:
Buy when the VWAP and EMA lines crossing up VWMA.
Sell when the VWAP and EMA crossing down each other OR both VWAP and EMA crossing down VWAP
Any modificatio is welcomed, but please let me know.
Stochastic Weights - Basic [BigBitsIO]This script is a compilation of several different stochastic indicators (and RSI) where the K value of each indicator is equally weighted. The purpose of the indicator is to combine many indicators together in a fashion that weights them easier. By default, the Stochastic and Stochastic RSI are both enabled - the idea is to speed up the relatively slower Stochastic and to slow down the relatively fast Stochastic RSI. Other Stochastics are also available, including some of my own custom calculations that can also be added to the weighted calculation. Only the K value is weighted, as the D value is just a moving average of the weighted K.
Explained:
- Calculates enabled indicators
- Calculates the weighted value of K for enabled indicators
- Calculates a D value from the weighted K
FAQ:
- Why is this script useful?
- To weight multiple indicators together so that you can attempt to find optimal values shared amongst the indicators. Ex: If Stochastic RSI is 100 and Stochastic is 50, K would be 75 and not particularly high. If you add in a 50 RSI, the K would be 67 in this example. If we weight indicators together that all have a high value they could potentially help find elements that align together to produce a stronger signal.
DISCLAIMER: For educational and entertainment purposes only. Nothing in this content should be interpreted as financial advice or a recommendation to buy or sell any sort of security or investment including all types of crypto. DYOR, TYOB.
LWMA: Linear Weighted Moving AverageCouldn't find searching for Linearly Weighted Moving Average (LWMA) in tradingview. Found one with the LWMA title, but it uses plain WMA calculation without the linearity which more heavily weights recent price data, which I need, so I try to made one.
LWMAs are also quicker to react to price changes than SMA and EMA. If you want a moving average with less lag than an SMA, try a LWMA.
It kind of also have a more clarity in defining the price trend and reversals. Trade signals usually based on crossovers, they can also indicate areas of potential support or resistance. But beware though, multiple false signals may also occur before a significant trend develops. Use a filter, some decent volatility oscillator might do the job.
--
The formula for this Linearly Weighted Moving Average is:
LWMA = (( P n∗ W 1)+( P n−1∗ W 2)+( P n−2∗ W 3)...) / ∑W
P = Price for the period
n = The most recent period, n-1 is the prior period, and n-2 is two periods prior
W = The assigned weight to each period, with the highest weight going first and then descending linearly based on the number of periods being used.
I hope I'm doing right translating it to Pine Script 4. Let me know if I miss something.

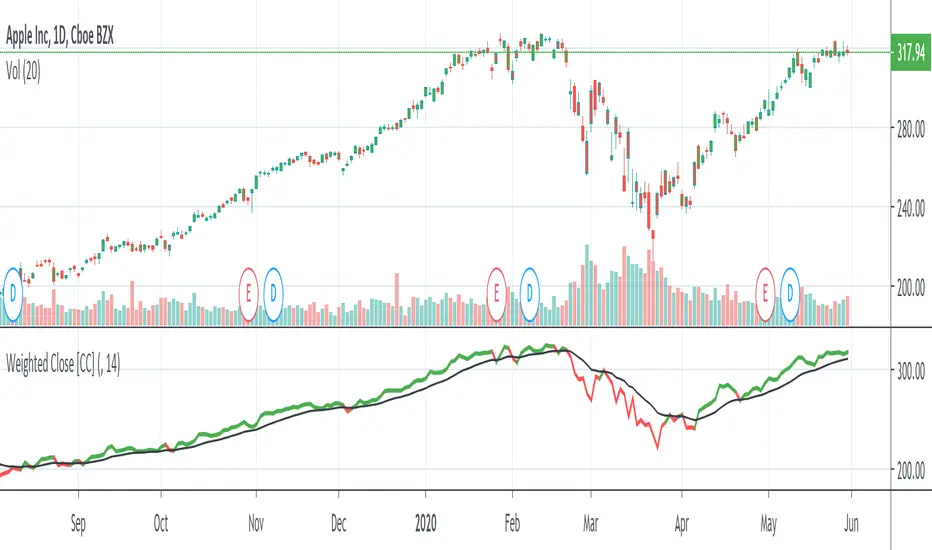
Weighted Close [CC]The weighted close isn't an option for an input yet on TV so here is my contribution. It gives more weight to the close prices and I have included a signal line to look for buy and sell signals. Buy when the indicator goes over its signal line and sell when it falls below it.
This was a special request so let me know what other scripts you would like to see me publish or if you want something custom done!
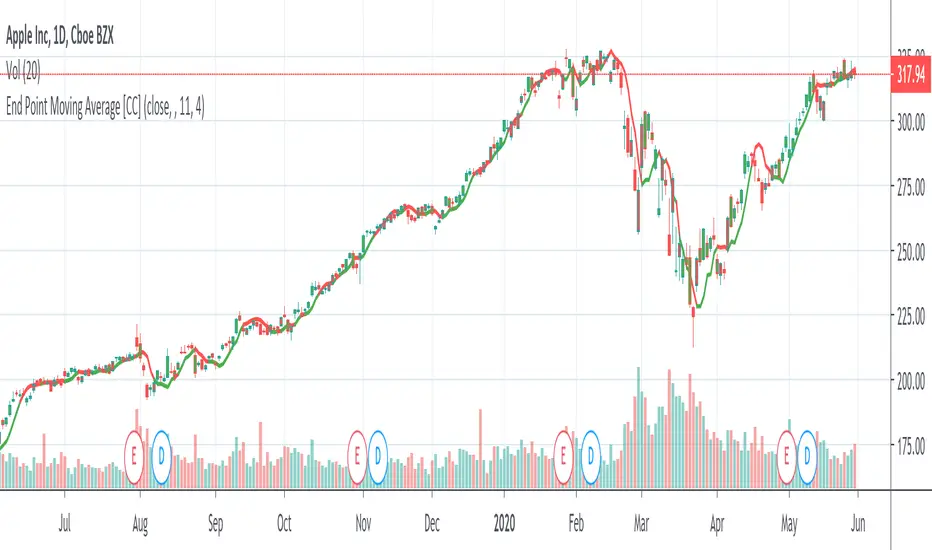
End Point Moving Average [CC]The End Point Moving Average was created by Patrick E. Lafferty (Stocks & Commodities V13 (413-417)) and it is essentially a variation of the weighted moving average but the weight system is different. Feel free to change the offset and length amounts to adjust to your needs but I'm using the default amounts in my script. This hugs the price very closely and I think you will enjoy this script as much as I had making it. As always buy when the indicator line is green and sell when it is red!
Let me know if you would like me to publish other scripts or if you want something custom done!
Note: I'm republishing this because the original script couldn't be found in searches so this will fix that.
CBG Swing HighLow MAThis indicator will show the swing high and lows for the number of bars back. It's very easy to use and shows good support and resistance levels.
I then took it a step further and added a moving average with all the standard types in my indicators:
SMA
EMA
Weighted
Hull
Symmetrical
Volume Weighted
Wilder
Linear Regression
I then added Bollinger Bands to show the standard deviation from the midline.
Finally, I added a simple bar coloring scheme: green if above the upper BB, Red if below and orange if in the middle.
I am just testing this out so please use with caution. If anyone in the community wants to run some backtests, that would be great and we would all appreciate it.
Of course you can keep it all simple and turn off all the moving averages and bollinger bands.
Enjoy! :-)

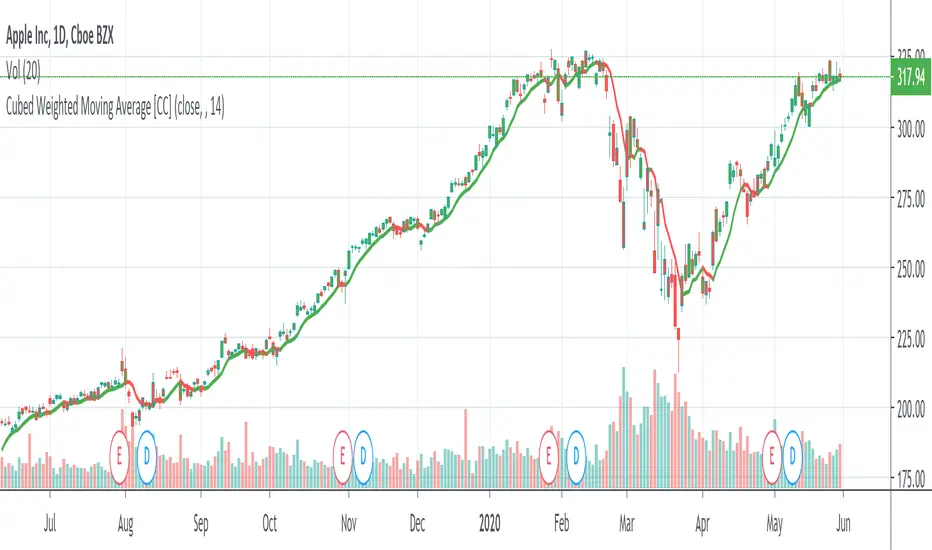
Cubed Weighted Moving AverageThis is another indicator that I have created that is my favorite script yet for a weighted moving average. This indicator is very similiar to a classic weighted moving average but in this version I'm cubing the weights. It hugs the price very closely as you can see and of course buy when the indicator line is green and sell when it is red.
Let me know if you would like me to publish other scripts or if you want something custom done!
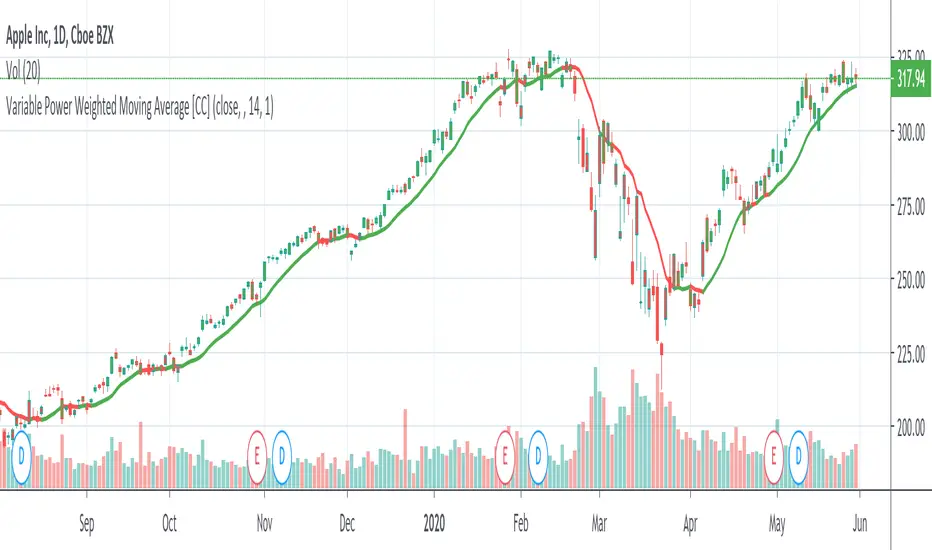
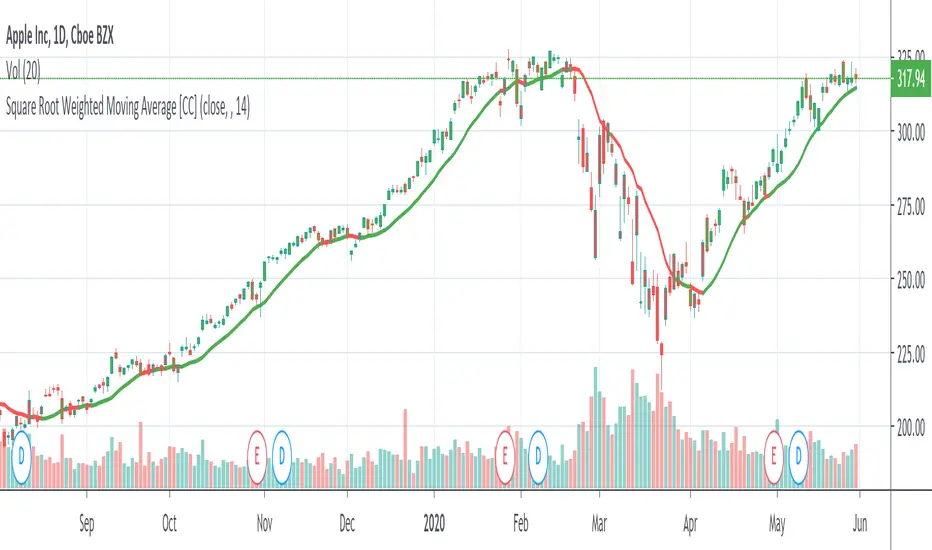
Variable Power Weighted Moving AverageThe Variable Power Weighted Moving Average was created by RedKTrader so make sure you follow them! This is a very handy indicator where you can change the weights of the weighted moving average yourself!
For an easy guide here are common values to use to convert this indicator into other indicators:
Power = 0 = Simple Moving Average
Power = 0.5 = Square Root Weighted Moving Average
Power = 1 = Weighted Moving Average
Power = 2 = Squared Weighted Moving Average
Try it out and let me know what you think!
Let me know if you have other ideas for me or if you want something custom done!
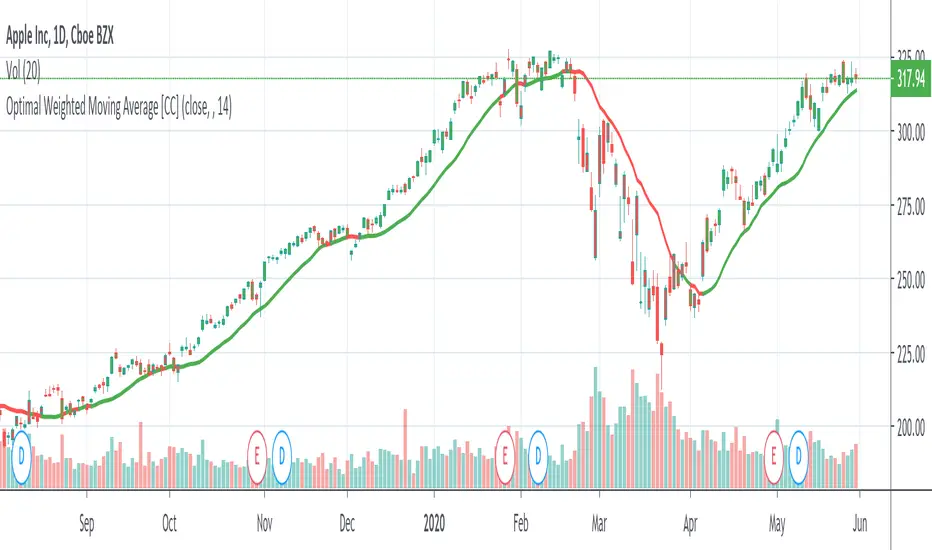
Optimal Weighted Moving AverageThe Optimal Weighted Moving Average was created by Thomas Hutchinson and Peter G. Zhang, Ph.D. (Stocks & Commodities V. 11:12 (500-505)) and it is very similar to a classic weighted moving average but it uses the correlation between the input and the optimal weighted moving average output to use as the weights. Buy when the line turns green and sell when it turns red.
Let me know if you would like to see me publish any other scripts or if you want something custom done!
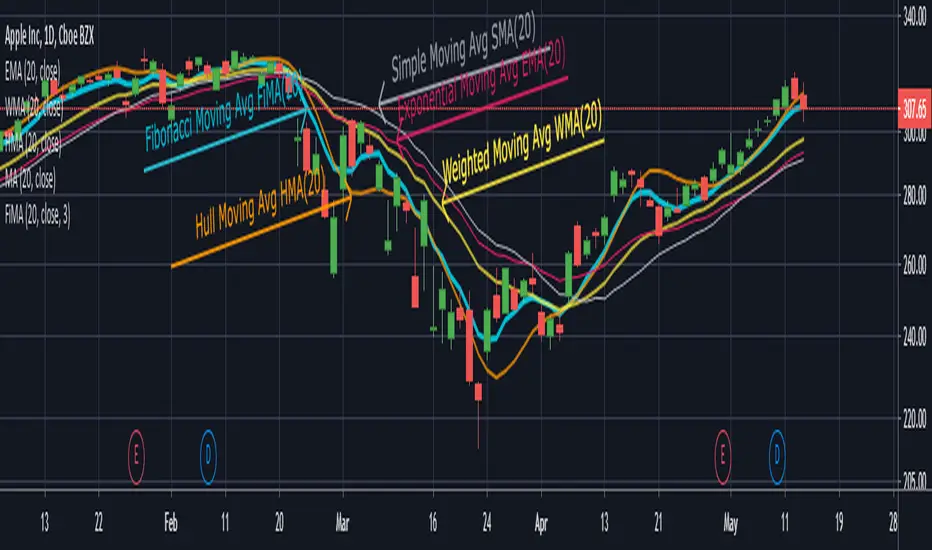
TA Basics: Creating a Fibonacci Weighted Moving AverageIn the previous 2 posts in this series, we played around with simple math concepts to create a zero-lag moving average that can deliver fast response and less lag - that we can use to enable better trend following, or as filter / signal.
here we take a step further - instead of using equal weight for the moving average (as in the Simple moving average) or linear weights (as in the weighted moving average), we get to pick THE MAGIC SEQUENCE, Fibonacci.
we will use the Fibonacci Sequence as weights to produce our moving average - so practically, we create a "Fibonacci Weighted Moving Average" (let's call it FiMA) - and compare the result with other commonly-used moving averages of the same length
in a Fibonacci moving average, the data will be weighted based on the Fibonacci Series starting from 1 (for the furthest data point)
so for example, if we use a length of 10, the weights will be 1, 1, 2, 3, 5, 8, 13, 21, 34, 55 with the 55 being the weight applied to the most recent / current bar's selected value (close, hl2, hc3..etc) and moving backward
before i posted this script, i searched around to see if someone else has already wrote this - i found a couple, but the approach we use here in this code is different - i can't claim it to be more efficient - i honestly don't know - but the resulting code here, IMHO, is more compact and easier to integrate in other studies that you may like to put together to leverage this idea, to create your own indicators and strategies.
the reason the code here is more compact, is that it utilizes a shorter formula to calculate the FIb(n) - i included the source where i found that formula, and i tested it before using it in the code.
i also added an optional "extra smoothing" for the resulting MA, by simply calling the fima() function a second time (so like doing a 2-pass filter), with a smaller length on the result of the 1st pass. keep this smoothing small not to produce too much lag.
i like the outcome when compared to other moving averages - it has a fast response to data/trend change and less overshoot - but honesty i didn't see any real "Fibonacci Magic" :) .. but i'll leave the final judgement to those who use it - this is more of an experimental code in all cases - please feel free to use, change and share feedback.
Squared Weighted Moving AverageThe Squared Weighted Moving Average is similar to the classic Weighted Moving Average but the difference is that it squares the weights instead of the classic weight values. Buy if the indicator line is green and sell when it goes red.
Let me know if you would like to see any more scripts from me or if you want something custom done!

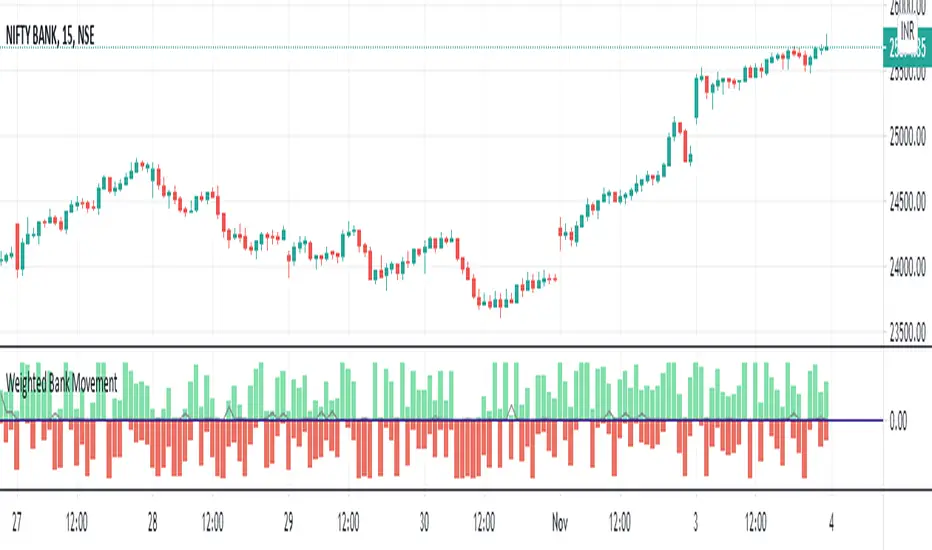
Weighted Bank MovementThe indicator comprises of a solid line that moves from -100 to +100 signifying the % of weighted movement among 12 banking stock constituting to the BANK NIFTY movement.
A positive value denotes the percentage of banks among the 12 banks that are trading above the previous HLC average ( High , Low , Close ) and vice versa a negative value denotes the percentage of banks trading below the previous HLC ( High , Low , Close ) average.
Comments and feedback are welcome.
Should you have any doubts or wish to access the script then please feel free to DM me.
Square Root Weighted Moving AverageThe Square Root Weighted Moving Average is similar to the classic Weighted Moving Average but the difference is that it uses the square root of the weights instead of the classic weight values. Buy if the indicator line is green and sell when it goes red.
Let me know if you would like to see any more scripts from me or if you want something custom done!
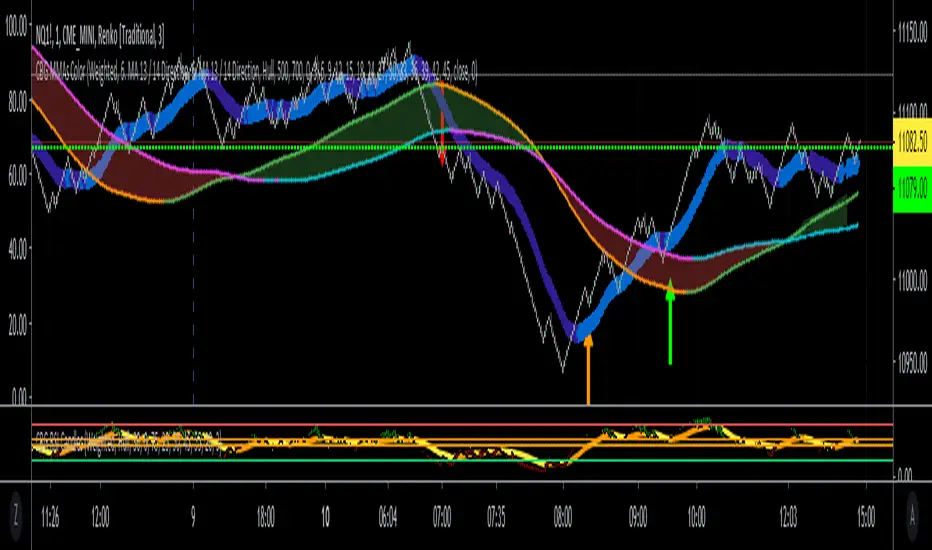
CBG MultiAverages ColorsThe latest version of my multiple moving averages. Now includes up to 14 moving averge lines plus a separate slow and fast moving average that can be assigned a different MA type.
In the screen shot is the fast/slow set to Hull with 15/50 periods. It is overlaid on top of my Key Numbers indicator.
7 moving averages in 1 indicator, including the Hull Moving Average .
SMA
EMA
Weighted
Hull
Symetrical
Volume Weighted
Wilder
Linear Regression
Lots of other features like background shading and paint bar colors.
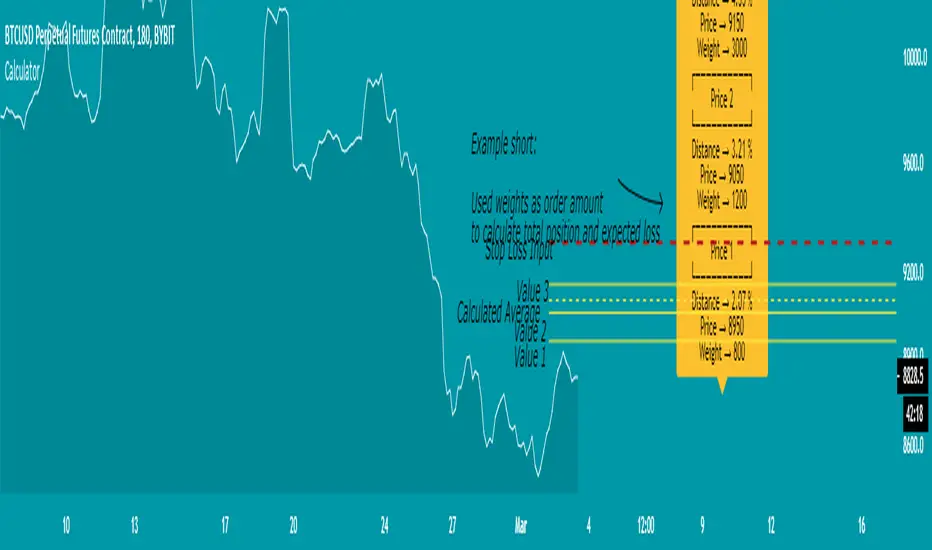
Weighted Average Calculator - evoTest version of a weighted average calculator, will make an update later with more functions and a better view.
For now it's mainly useful for getting an average value and see how you can ladder into your position,
if you use the weights as the amount you want to order, you can see the total value and expected loss in the label.
You can use the weights as percentage or any numbers you like, but expected loss won't apply to that for now (before update)
5 values and weights available
If you have ideas to add anything or find mistakes send me a message.
Calculator (weighted) - evoA tool to calculate the average price and position size.
The "Risk Amount" input means the amount of dollars you lose if the trade gets stopped out (it should be based on a small percentage of your account).
TIPS
- If you use the weights to calculate an average price, make sure it adds up to 100% in total or you will get a weird number.
- Keep an eye on the risk amount if you take a trade, if I ever update the script it might set back to default which will change your position size.
- I tested it all but you might trade in a different way than me, so do your own calculation for every new thing you try with it.
If you find any bug please tell me so that no one ends up with a weird calculation or position size.

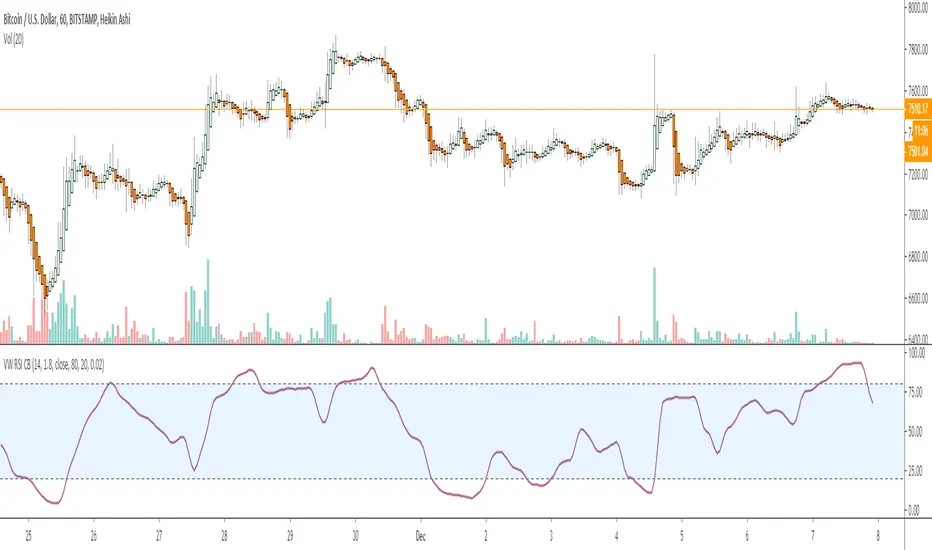
RSI background by AvesTradingHello,
This is RSI indicator that shows background color, when proper levels reached, instead of line in another pane. Customizable options are available:
- source
- length
- overbought level
- oversold level
I have added as well RMA of RSI for extra confirmation if needed. I hope you enjoy and will leave me some feedback! Don't forget to follow me for new releases.
Cheers
Aves
Please remember that the indicators provided by me are for educational purposes only.

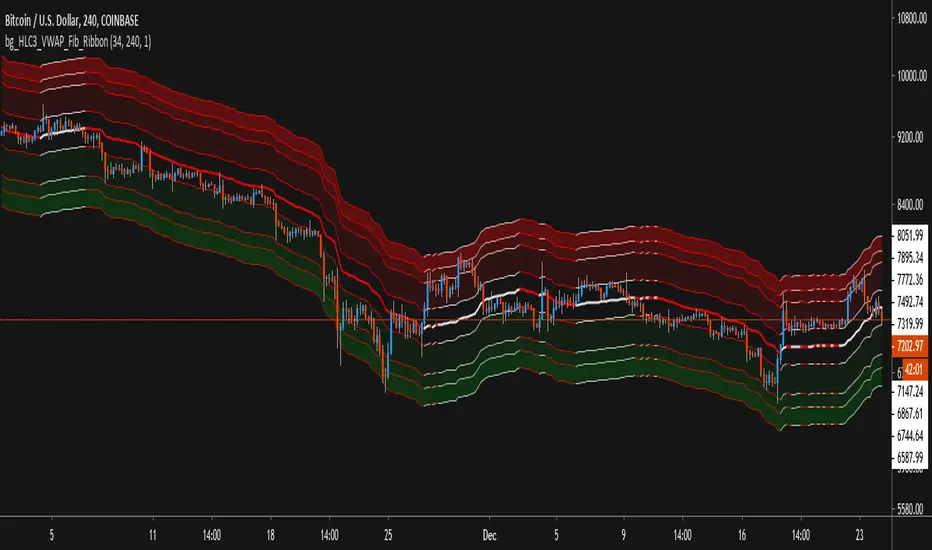
HLC3_VWAP_Fib_RibbonThis Script use Volume Weighted Average Price (VWAP) combined with Fibonacci Deviations of that value as Ribbons to show Support and Resistance levels, as well as estimate good Buy and Sell areas based on the extremity of distance from the central VWAP.
Features:
- Alerts exist for price crossover / crossunder the VWAP value, as well as any of the Fib Ribbon levels.
- Ribbons & Fills can be toggled on/off, leaving just the VWAP as a single line if desired.
- Using the Amplification setting, you can expand or contract the ribbons while maintaining the Fib Ratio, to fit different time-frames and volatility.
- Time-Frame and Length of VWAP can be changed while staying on the same Time-Frame chart view.
Volume Weighted RSI [ChuckBanger]This is volume weighted RSI (Relative Strength Index). In compressing to regular RSI it look like this:
The relative strength index detect an overbought/sold market when higher/lower than a certain level, often 80/20. An overbought market is more attractive to sell because prices are no longer attractive to buy, it has reached its value of interest for traders looking to go long, we can then expect the price to correct and start a trend of opposite direction, while an oversold market is more attractive to buy based on the same logic.
The idea of talking about overbought and oversold without taking into account the volume can be a bit strange, since volume is directly related to the market traded, an higher volume can show sign of a more active market, which can describe the terms : overbought/sold a bit better. The money flow index for example, use volume, but it is interesting to provide other alternatives like this indicator.
With OB and OS signals