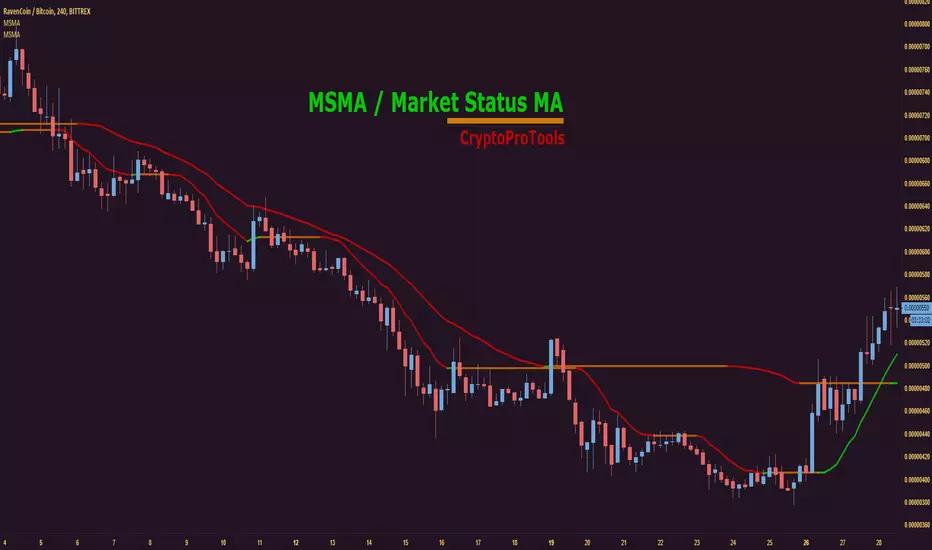
Market Status Moving AverageGet a quick easy view of the current market status.
Examples used above are lengths 6 and 15, but you can tweak to your liking.
Want to stop sweating the small stuff and see the bigger picture? Try increasing the length to 50, 100 etc
Green = Bullish
Orange = Consolidation / Flat
Red = Bearish
--------------------------------------------------------------------
--------------------------------------------------------------------
Check out some of our other recent releases below :
加權移動平均線(WMA)
Add More Usual 5 MAsAdd 5 more usual emas. Maintains coherence of the temporal framework that is being observed.


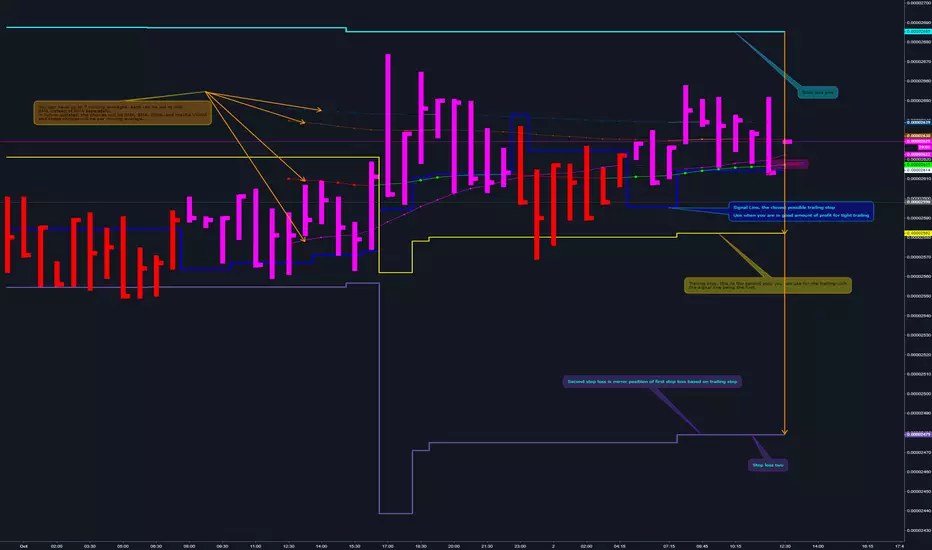
NeoIchi TrailingThis is the separation of moving average parts from NeoIchi indicator with addition of four different ATR setting that can be used for Stop Loss and Trailing Stops. The NeoIchi indicator won't have any moving averages any more, the code is secured but every one have access to use this indicator on their charts.
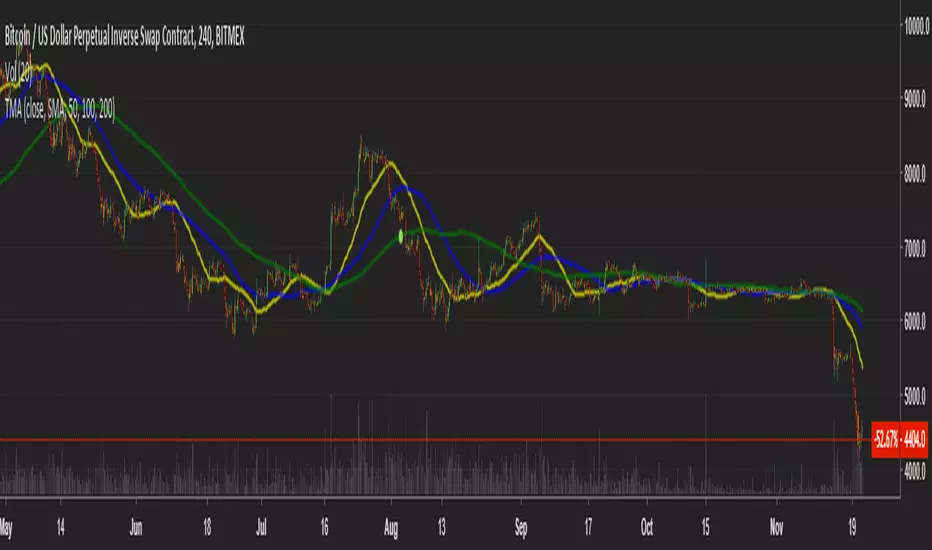
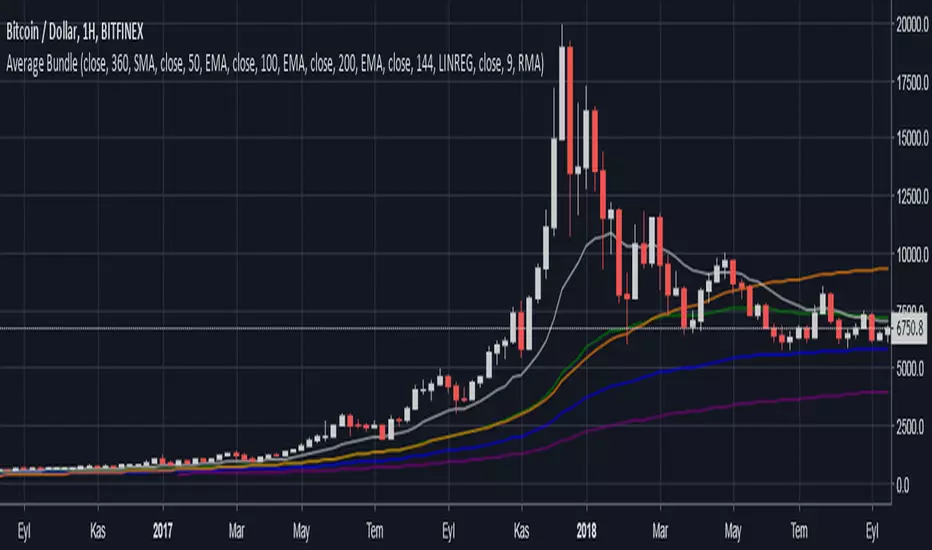
Average BundleSix (6) average indicators in single package.
All averages have adjustable source, length and type individually
Every average can be enabled or disabled individually.
Color, thickness and other style parameters are adjustable on Style section.
Supported types are:
EMA - Exponential Moving Average
SMA - Simple Moving Average
RMA - Running Moving Average
WMA - Weighted Moving Average
LINREG - Linear Regression
Investopedia is a good source to learn about moving average types.
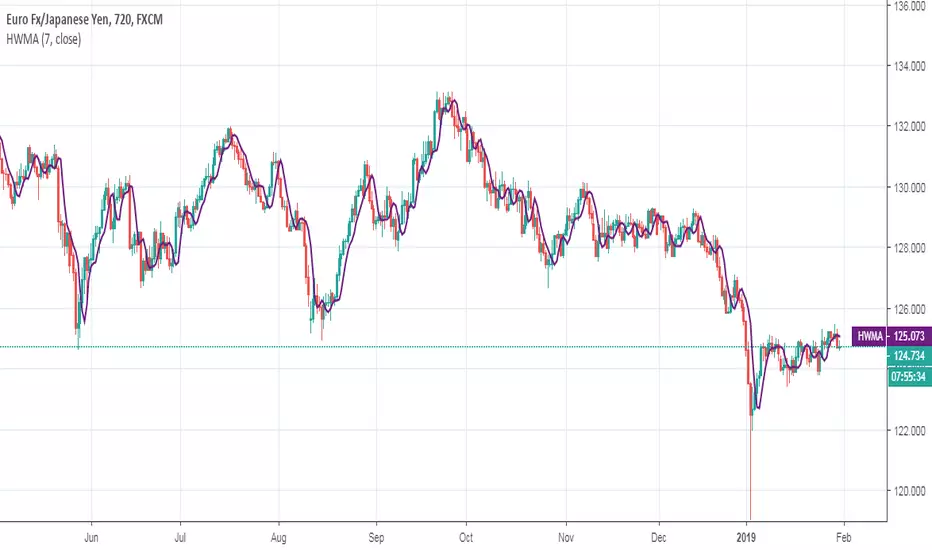
Henderson Weighted Moving AverageHenderson Weighted Moving Average script.
This indicator was originally developed by Robert Henderson in 1916 (Transaction of Actuarial Society of America, 17, pp. 43-48: Note on Graduation by Adjusted Average).
Spencer 21-Point Moving AverageSpencer 21-Point Moving Average script.
This indicator was originally developed by John Spencer in 1904 (J.I.A. 38, 334: On the graduation of the rates of sickness and mortality presented by the experience of the Manchester Unity of Oddfellows during the period 1893 - 1897).

Spencer 15-Point Moving AverageSpencer 15-Point Moving Average script.
This indicator was originally developed by John Spencer in 1904 (J.I.A. 38, 334: On the graduation of the rates of sickness and mortality presented by the experience of the Manchester Unity of Oddfellows during the period 1893 - 1897).

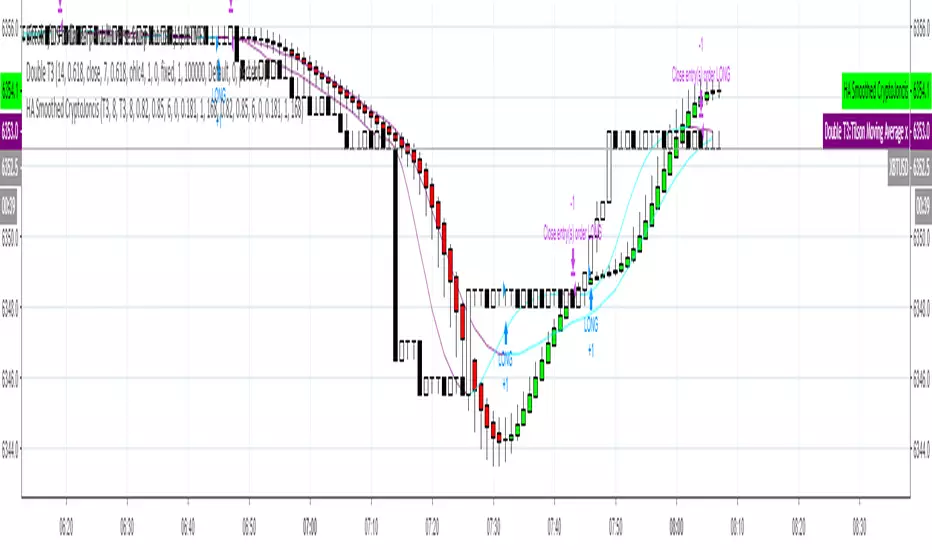
Heikin-Ashi Smoothed with option to change MA types CryptoJoncisPine Script version=3
Author CryptoJoncis
Heikin-Ashi Smoothed
The Heikin-Ashi Smoothed study is based upon the standard Heikin-Ashi study with additional moving average calculations. The following is the calculation formula for the bars:
1. The current bar Open, High, Low, Close values are smoothed individually by using the moving average type specified by the Moving Average Type 1 Input with a length/period specified by the Moving Average Period 1 Input.
2. The Heikin-Ashi bar Open, High, Low, Close values are set using the smoothed values from step 1. This is performed using the standard Heikin-Ashi formula.
3. The final Heikin-Ashi Open, High, Low, Close values are calculated by doing a second smoothing of the bar values from step 2 by using the moving average type specified by the Moving Average Type 2 Input with a length/period specified by the Moving Average Period 2 Input.
If you choose to tick the box where it offers to use only one smoothed HA then it skips the third/final step and you do not need to choose the second MA type for it to work.
Remember, using FRAMA, always make sure you use even number for length.
For simple Heikin-Ashi, please tick single smoothed and DEFAULT (Not smoothed as there are no MA used)
Heikin-Ashi bars are calculated:
1. Close = (Open + High + Low + Close) / 4
This is the average price of the current bar.
2. Open = (Open of Previous Bar + Close of Previous Bar) / 2
This is the midpoint of the previous bar.
3. High = Max of (High, Open, Close)
Highest value of the three.
4. Low = Min of (Low, Open, Close)
Lowest value of the three.
Any questions/suggestions/errors or spelling mistakes? Please leave a comment and let me know. I will try to fix it.
This took me few days to finish, so I hope you will find it useful.
Would you like to have more MA type choices? Please comment down with any other which aren't included in this indicator and I will research them and add.
MA included in this script:
Tillson Moving Average (T3)
Double Exponential Moving Average (DEMA)
Arnaud Legoux Moving Average (ALMA)
Least Squares Moving Average (LSMA)
Simple Moving Average (SMA)
Exponential Moving Average (EMA)
Weighted Moving Average (WMA)
Smoothed Moving Average (SMMA)
Triple Exponential Moving Average (TEMA)
Hull Moving Average (HMA)
Adaptive moving average (AMA)
Fractal Adaptive Moving Average (FAMA)
Variable Index Dynamic Average (VIDYA)
Triangular Moving Average (TRIMA)
You can use,publish,modify this code in any way as you wish, but only if you reference me after.
You are not allowed to sell it as it is.
If this code is useful to you, then consider to buy me a coffee (or better a pint of beer) by donating Bitcoin or Etherium to:
BTC: 3FiBnveHo3YW6DSiPEmoCFCyCnsrWS3JBR
ETH: 0xac290B4A721f5ef75b0971F1102e01E1942A4578
References:
www.sierrachart.com
www.investopedia.com
www.binarytribune.com
www.investopedia.com
www.stockfetcher.com
www.mql5.com
www.incrediblecharts.com
help.cqg.com
www.blastchart.com


All-in-One Solutions - Multiple Moving Average MTFHello,
This indicator is able to plot up to 5 moving averages.
You will have access to the following setting:
- How many moving averages to plot between 1 and 5
- Do you want to plot EMA or SMA or WMA ?
- Choose the length of each moving average separately
- Do you wish the color to change according to the trend of the line ?
- Do you want to use a different time frame (ex plot a Daily EMA on you 1H chart)
Here is a screenshot of the menu you will have access to:
imgur.com
The alerts are also fully functional if you want to be alerted on a change of trend or when a two moving averages crosses :
imgur.com
This indicator is also very useful for people having a limited number of indicators allowed at the same time on the screen when you are not willing to pay for a Pro Tradingview offer.
Please contact me in order to get access to this indicator. Please note that by subscribing to my offer, you will have access to all indicators I made and and the futur indicators I will develop according to the demand of the community.
After subscribing, all indicators will be added into your under invitation indicators list or you can have a look on my Tradingview page :https://fr.tradingview.com/u/KenLeShim/#published-scripts
I hope my indicators will help you !

EMA CrossThis is one of my personal Tradingview scripts that generate accurate Long and Short signals. If you want to use it as well, I'll charge you a symbolic monthly fee to pay the cost and time of my research.
Those signals are simply generated by EMA crossings.
Inputs and source are adjustable.
For any questions, hit me up on Telegram @kaiomoraes
//==== GET ACCESS ====//
To have access granted to this and all my other signals scripts, go to my website and subscribe: HERE
I will work to get you access to everything as quickly as possible. If you have any issues or questions, contact me!
(Optional MAs will be added soon)


ICC TREND CONDITIONSThis indicator shows you when suitable trend conditions are in place for high probability trades in the direction of 1-hour down to 5-minute trend.
- Red color indicates bearish trend
- Blue color indicates bullish trend
- 1st row (starting on top) is 1h trend - indicates that price is above (blue) or below (red) 365 WMA on 1h timeframe.
- 2nd row (starting on top) is 15min trend - indicates that price is above (blue) or below (red) 365 WMA on 15min timeframe.
- 3rd row (starting on top) is 5min trend - indicates that price is above (blue) or below (red) 365 WMA on 5min timeframe.
- 4th row (starting on top) is a combination of rows 1-3. It shows when row 1-3 are in line for high probability long or short trades.
- When the 4th row is colored RED, it means that the conditions for sell (short) trades are in place.
- When the 4th row is colored BLUE, it means that the conditions for buy (long) trades are in place.
- When the 4th row is colored GRAY, it means that there is indecision between buyers and sellers, the market is in process of rolling over or consolidating. This means that there are no favorable conditions for ICC wave trading and you should stay out of the market until there is a clear direction.

Moving Averages (SMA and EMA)Plot the simple moving averages (SMA) and/or exponential moving averages (EMA).
The length of the lookback period and the type of moving average can be changed in the inputs tab of the indicator.
Line-weight and colours can be edited in the style tab of the indicator.
The default is to plot the SMAs using a length of 20, 50, 100 and 200.

Elastic Volume Weighted Moving AverageElastic Volume Weighted Moving Average indicator script. This indicator was originally developed by Christian P. Fries (Technical Analysis of Stocks & Commodities, June 2001).

Normalized Relative Vigor IndexThis is the Relative Vigor Index indicator just multiplied by 100 to have non-zero integer part
