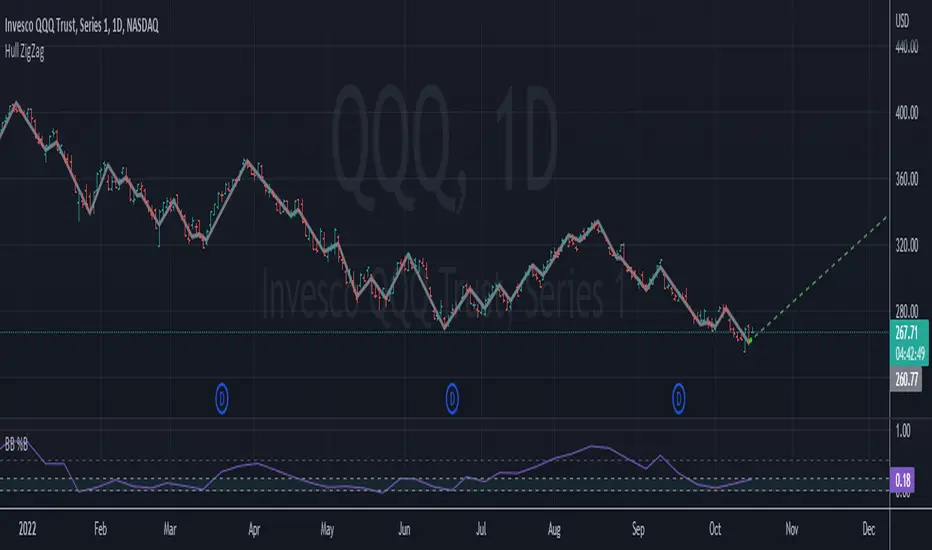
Hull ZigZagA simple indicator I use to filter out noise. it tracks reversals of a Hull Moving Average, which ultimately highlights short term trends and potential chart patterns. I've also included an option to project the most recent trend forward, if that is something you would like to tinker with.
轉折指標(Zig Zag)
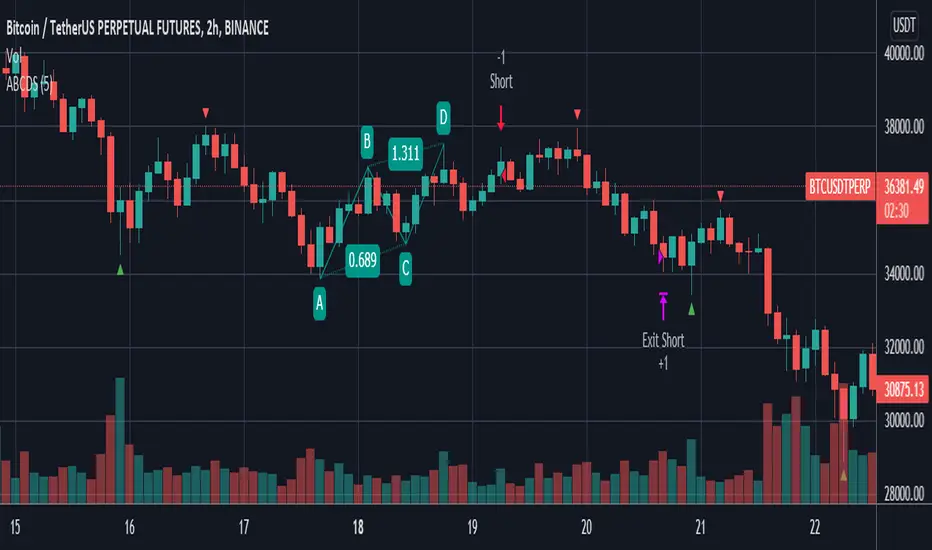
ABCD StrategyOne from many harmonic pattern that consists of two equivalent price legs. The ABCD pattern that helps traders predict when the price is about to change direction.
Tracing And Calculation
This code using pivot high and pivot low built-in method and calculate with Fibonacci Retracement.
Limitation
To find ABCD pattern is very difficult, just coming up a few from thousand candle. That why this code using little bit tolerance ratio to get more pattern.
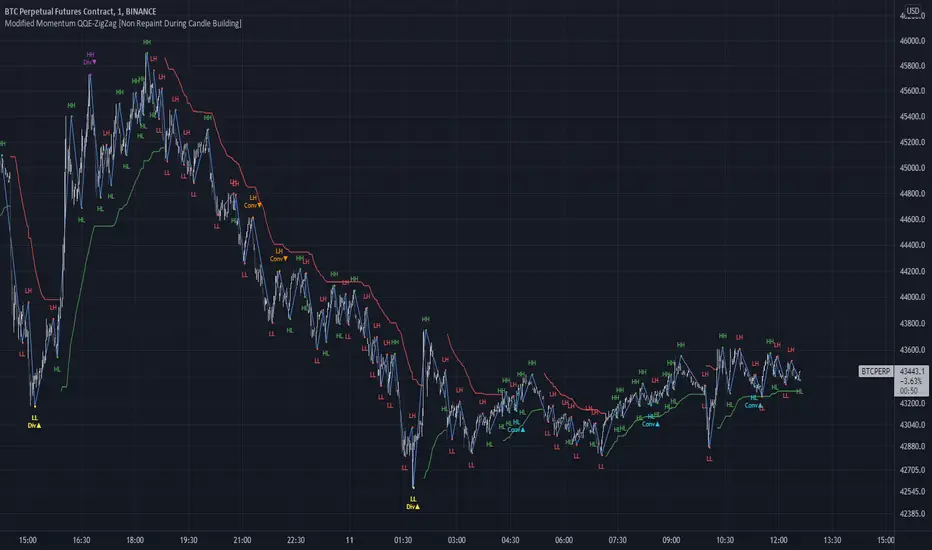
Modified QQE-ZigZag [Non Repaint During Candle Building]V V V V V V V Please Read V V V V V V V
I ask Peter and he is fine, that im published this script
Tell me if you have some ideas or criticism about that sricpt
>>>>>>>>>> This is a modified Version of Peter_O's Momentum Based ZigZag <<<<<<<<<<<
This is only a test, and i want to share it with the community
It works like other ZigZags
Because Peters_O's original Version is only non repaint on closed historical Data ,
during a Candle building process it can still repaint (signal appears / 21 seconds later signal disapears / 42 seconds later signal appears again in the same candle / etc.),
but that isnt important for backtesting, its only important for realtime PivotPoints during a candle.
My goal for this zigzag was to make it absolute non repaint neither during a candle building process (current candle),
so once the signal is shown there is no chance that it disapers and shown a few seconds later again on that same candle, it can only show up one time per candle an thats it,
and that makes it absolute non repaint in all time frames.
Credits to:
==> Thanks to @glaz , for bringing the QQE to Tradingview <3
==> Thanks to @Peter_O , for sharing his idea to use the QQE as base for a Zigzag
and for sharing his MTF RSI with the Community <3
Changes:
- I changed the MTF RSI a little bit, you can choose between two version
- I changed the QQE a little bit, its now using the MTF RSI , and its using High and Low values as Source to make it absolute non repaint during a candle is building
- I added a little Divergence Calculation beween price and the MTF RSI that is used for the ZigZag
Colors :
- Green for HH / HL Continuation
- Red for LL / LH Continuation
- Yellow for Positive Divergence
- Purple for Negative Divergence
Important:
It is not possible to backtest this script correctly with historical Data, its only possible in Realtime,
because the QQE is using crossunders with RSILowSource and the QQE Line to find the Tops and,
because the QQE is using crossovers with RSIHighSource and the QQE Line to find the Bottoms,
and that means it is not possible to find the correct Time/Moment when that crossovers / crossunders happens in historical Data
=============> So please be sure you understand the Calculation and Backtest it in Realtime when you want to use it,
because i didn't published this script for real trading
=============> Im not a financial advisor and youre using this script at your own risk
=============> Please do your own research
[Herif's] Wolfe WavesWolfe Waves™
This indicator draws wolfe wave patterns.
Some patterns need to be validated by the user.
When detecting Wolfe waves, two triangles are formed.
A target line is drawn from the origin of one of these triangles to the apex or trough of the other.
Bullish patterns are indicated by green triangles and bearish patterns by red triangles. The target line is black.
Care bullish wolfe wave rules
Understanding Wolfe Waves
Wolfe Wave patterns were first identified by Bill Wolfe and his son, Brian. According to Wolfe, they occur naturally in all markets. To recognize them, traders must identify a series of price oscillations that correspond to specific criteria:
-The waves must cycle at a consistent time interval.
-The third and fourth waves must stay within the channel created by the first and second waves.
-The third and fourth waves must show symmetry with the first and second waves.
-In a Wolfe Wave pattern, the fifth wave breaks out of the channel. According to the theory behind the pattern, a line drawn from the point at the beginning of the first wave and passing through the beginning of the fourth wave predicts a target price for the end of the fifth wave. If a trader properly identifies a Wolfe Wave as it forms, the beginning of the fifth wave represents an opportunity to take a long or short position. The target price predicts the end of the wave, and therefore the point at which the trader aims to profit off the position.

[Herif's] Harmonic PatternsFollowing things are displayed by default on the chart with harmonic patterns strategy. It can be use with automate trading platforms 3commas, zignally, frostybot, alertatron, wunderbit etc...
Bullish and bearish 5-point patterns are based on various Fibonacci retracement levels and signify potential reversal zones (PRZ).
As they become 80% complete, the dashed-line pattern will appear, displaying the PRZ and giving you time to prepare for a reversal.
Different combinations of specific fib retracements and extensions result in different patterns, and each is named for identification.
Bullish patterns signify a potential turn to the upside are colored green.
Bearish patterns signify a potential turn to the downside are colored red.
1- Live harmonic patterns which are still in trade with XABCD and ratio with labels.
2- Position Entry, Stop and Target levels on chart for all patterns.
3- Trades Stat table - Waves stat tables
in Settings:
Error Percent - This is error tollerance for matching pattern ratios. Cannot expect price ratios to be exactly as per books. Hence, adding few error tolerance will help identify patterns better.
When there are multiple patterns on chart, Entry, Stop, and Target labels and lines are created with specific distance from each other to provide clarity to the users.
Trailing and Targets
1-Trailing Start Stage - Defines when to start trailing stop-loss. It is recommended to set this value to either Target 1 or Target 2. Disabling the trailing or setting too far away may lead to being in trade on ranging market for too long. This may also result in drawing errors related to distance from current bar.
2- Custom Target Levels - Target and stop levels are set to optimal values based on individual patterns. If you want to override these levels, use the available input option to override targets and chose your custom Target1, Target2, Target3 and Target4
All Patterns you can enable or disable
Classic Patterns : Gartley, Bat, Butterfly, Crab, Deep Crab, Cypher, Shark, Nenstar
Anti Patterns: Anti Nenstar, Anti Shark, Anti Cypher, Anti Crab, Anti Butterfly, Anti Bat, Anti Gartley, Navarro 200
I will plan some updates and i will post some screen shots for settings as soon as possible.
Manual Harmonic Patterns - With interactive inputsThis script is a drawing tool which allows users to draw XABCD on the chart and script will tell whether there is any harmonic patterns on the drawings made. The script is based on interactive inputs and requires users to chose XABCD points.
Please note
This is not a scanner and it will not scan historical bars for harmonic patterns. This needs to be used rather as drawing tool instead.
Script will not check if selected pivots are correct. It assumes users to know how to select the right XABCD based on pivot high/lows. Bullish pattern will have X, B and D as pivot lows and A,C as pivot highs. Similarly bearish patterns will have X, B, D as pivot highs and A, C as pivot lows.
Script will not check for overflow conditions. For example, if price crosses, XB or BD line, then pattern is considered to be invalid. But, this check cannot be made in this script and we require users to be aware of this condition and select input accordingly.
Order of inputs should be in ascending order. X pivot should come before A and then, B, C, D and F. This again is users responsibility to select pivots in right order.
What happens after selecting XABCD?
If selected pattern is valid harmonic pattern, it will
Draw XABCD lines and labels
Fill harmonic triangles
Show PRZ box which shoes the name of valid patterns.
If it is not valid harmonic pattern, then users will see blank XABCD line without any PRZ or filled harmonic triangles.
Example:
1. When it is valid pattern
2. When it is not valid pattern

Cyclic RSI High Low With Noise Filter█ OVERVIEW
This indicator displays Cyclic Relative Strength Index based on Decoding the Hidden Market Rhythm, Part 1 written by Lars von Thienen.
To determine true or false for Overbought / Oversold are unnecessary, therefore these should be either strong or weak.
Noise for weak Overbought / Oversold can be filtered, especially for smaller timeframe.
█ FEATURES
Display calculated Cyclic Relative Strength Index.
Zigzag high low based on Cyclic Relative Strength Index.
Able to filter noise for high low.
█ LEGENDS
◍ Weak Overbought / Oversold
OB ▼ = Strong Overbought
OS ▲ = Strong Oversold
█ USAGE / TIPS
Recommend to be used for Harmonic Patterns such as XABCD and ABCD.
Condition 1 (XABCD) : When ▼ and ▲ exist side by side, usually this outline XA, while the next two ◍ can be BC.
Condition 2 (ABCD) : When ▼ and ▲ exist side by side, usually this outline AB, while the next one ◍ can be BC, strong ABCD.
Condition 3 (ABCD) : When ▼ or ▲ exist at Point A, the next two ◍ can be Point B and Point C, medium ABCD.
Condition 4 (ABCD) : When ◍ exist at Point a, the next two ◍ can be Point b and Point c, weak ABCD usually used as lower case as abcd.
█ CREDITS
LoneSomeTheBlue
WhenToTrade

[KK] ZigZag Percent Reversal - Forecast - patterns - labels Zig Zag indicator plots points on the chart whenever prices reverse
by a percentage greater than a pre-chosen variable.
• Forecasts area based on zigzag statistics.
• Displays labels with detected patterns.

Harmonic Patterns - Custom CandlesHello Traders,
Here is an experimental indicator created to plot harmonic patterns on indicators. This can be used for confirmation of oversold and overbought regions. However please note that oscillator movements does not always correlate with price movements. Hence, there was no concrete way to log the trade statistics and measure performance.
⬜ Process
▶ Derive custom candles
There are two types of candles used in this script
Oscillator Candles - derived based on oscillators - cci, cmo, cog, mfi, roc and rsi.
Band Candles - Candles derived based on percentage range of Bands. Available options - Bollinger Bands, Keltner Channel and Donchian Channel
▶ Draw zigzag
Single zigzag is used in this indicator. However, multiple zigzags can also be used.
▶ Apply harmonic pattern calculations
Use the logical calculations to derive harmonic patterns.
More experiments need to be done on using the indicator along with regular harmonic patterns on chart.

Martyv Technical Analysis KitThis indicator is being developed as a tool hopefully suited to both the beginner/amateur/hobbyist and possibly also the professional analyst/trader. The idea is that it would be a tool that can give you an instant ‘overview’ of a few different schools of measurement on any measurable asset. Makes for great training wheels or a primer for further analysis.
Out of the box settings will give you an AutoFib for the most recent low and high (with extension targets), a pair of commonly-used moving averages (50 SMA and 200 SMA), RSI (and/or many other) divergences on the chart, and candles colored according to current trend (Blue = Bullish Control, Purple = Neutral/Coasting, Red = Bearish Control) and intensity according to volume (Darker = High Volume/Increasing, Lighter = Low Volume/Decreasing). For more advanced traders/analysts, almost all settings can be customized, with multiple options and additional features.
*There are a lot of settings. Shrug. Wink. I tried to bundle them together, however there are a few that I use quite often and placed them at the top for easy access. If you have any suggestions as to what's super useful in the top area, lmk. Happy trading! -E
AutoFib
-Places an AutoFib for the most recent low and high (with extension targets)
-You can choose to "contain price action" inside a 0-1 fib retrace, or allow extension targets to automatically be used (potentially useful within Harmonic Trading among other things)
-Uses the Fast/Medium/Slow (Default) global inputs for fib lookback period (Defaults to 8/21/34 at the time of this writing, can be changed in settings)
-Customizable fib levels, colors, and styles
-Can choose between AutoFib with manually defined levels or SmartFib with levels automatically calculated, including extensions as needed
--Choose between only using the most recent confirmed fib retrace, or the currently developing (non-confirmed) fib retrace - this will also contain price action within a 0-1 fib
--Adds fib extensions as needed, you can define extension levels
-Can change the lookback period and turn the visible Zig Zag and/or AutoFib on/off
-Can turn Logarithmic on/off in settings
Divergence
-Can identify and mark divergences (regular and hidden) for MACD, MACD Histogram, RSI (Default), Stochastic (Default), CCI, Momentum, OBV, Diosc, VWmacd, and Chaikin Money Flow
-Can turn divergences on/off individually
-Can choose to show hidden divergence
-Uses the Fast/Medium/Slow global inputs (Defaults to 8/21/34 at the time of this writing, can be changed in settings)
Trend Channels
-Uses a Zig-Zag with a specified lookback period (can be changed in settings)
-Setting AutoFIb to a different lookback than Trend Channels yields interesting results imo
-Can turn channels on/off
-Can change the lookback period and turn the Zig Zag and/or Channels on/off
Trend Ribbon
-Uses the John F. Ehlers Supersmooth method on a specified lookback period (Default 14)
-Checks the current price action against the lookback period trend and if the Supersmooth signal aligns with the trend direction, it gives a strong signal (Bull/Bear). A continuation signal (Neutral) is given if these two don’t match, and often indicates trend continuation or trend reversal.
-Can turn supersmooth and/or matching bar repaint on/off
-Can choose between Bull/Bear/Neutral signals and only Bull/Bear signals
-Alerts available for Bullish or Bearish change
-Can choose current timeframe or any timeframe
Bar Repaint
-Candles colored according to current trend (Blue = Bullish Control, Purple = Neutral/Coasting, Red = Bearish Control) and intensity according to volume (Darker = High Volume/Increasing, Lighter = Low Volume/Decreasing). You can set candle color to reflect: Open/Close, Trend (Default), or an RSI Gradient. You can set candle intensity to reflect: Volume (Default), Momentum, RSI, or ADX.
Price Tag
-Price tag that sits neatly between the candles and the fib labels. You can turn this on or off.

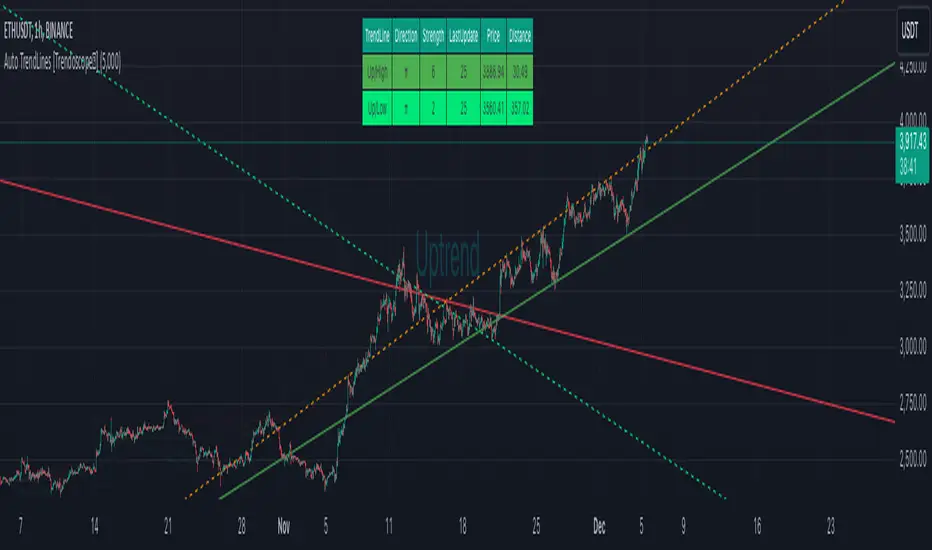
Auto TrendLines [HeWhoMustNotBeNamed]I started off with the intention of creating script to identify Wolfe wave projection. But, soon ran into problem with loops. Realized drawing wedge is more difficult than drawing converging triangle. Hence, took a step back and started working on wedges and triangle identification. Ended up with a messy output which looked like this.
Had to take another step back and hence decided to make Trendlines detection script and here we are :)
⬜ Process
▶ Scan pivots which are in trend. This means, series of pivot Highs or pivot lows either in ascending order or descending order.
▶ Draw trend line between each of the pivots in the trend series. For example, if there are 5 pivot high uptrend pivots, draw mXn lines between each of these points.
▶ Select the trend line which is more accurate or stronger. Accuracy is measured by number of candles/wicks touching the line and number of candles which fall outside the line. Stronger trendlines will touch more candles and pivots with less overflow.
▶ Remove all lines except the most accurate one for each direction.
At any point of time, you will see upto 4 trend lines in this script.
▶ Trendline joining pivot highs in uptrending condition
▶ Trendline joining pivot lows in uptrending condition
▶ Trendline joining pivot highs in downtrending condition
▶ Trendline joining pivot lows in downtrending conditions
The older line will remain until the new one comes through of same type. Hence, you will still be able to see uptrending high and low trend lines for downtrending instruments which are created way back!! Also, new trendlines replace old ones only if they are more stronger (connect to more pivots with less overflow)
⬜ Settings
Settings are simple.
User can select preferred Zigzag Length and Search Depth. Higher numbers for these two parameters will present longer term trends whereas lower numbers will display shorter ones.
Trend Lines controlls will allow users to enable/disable specific type of trend line, set color and line style to it.
⬜ Few Examples
▶ Uptrending Market : NASDAQ:NDX
▶ Downtrending Market : NYSE:BABA
▶ Ranging Market : NYSE:PLTR
RSI Linear Regression with ZigZag by zdmreBoth the RSI (Relative Strength Index) and the Linear Regression ( LR ) rank among the most popular momentum indicators used in trading. When used in combination with other technical indicators (ZigZag), both RSI, LR and ZigZag can offer value in validating trade opportunities to optimize your risk management practices.
Here’s a look at how to use RSI, LR and ZigZag (Can be used for divergence patterns.) as part of your trade analysis.
If you have new ideas to improve this indicator then let me know please.
***Use it at your own risk

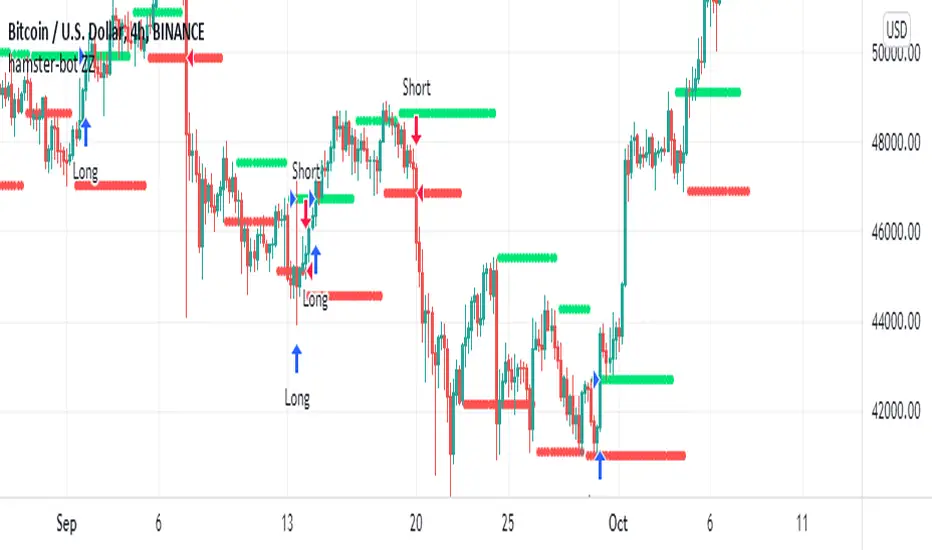
hamster-bot ZZCompilation of various modifications of the trend breakout reversal strategies based on the ZigZag .
Includes past versions of scripts:
version 1 ZZ2 Breakout reversal strategy
version 2 ZZ2 with experimental options hamster-bot ZZ Breakout reversal strategy
version 3 ZZ6 Noro's ZZ-6 by hamster-bot The original script is available here
The original script is available here
Description ZZ6 :
New version of ZZ-strategy.
Repaint?
Normal lines are not redrawn. Dotted lines repaint, but do not affect trading (do not affect backtests). You can turn off repaint in the script settings. Repaint (dotted lines) are needed only for clarity. To make it clear from which bar the level is created.
Levels
Lime lines above - level from a local high bar. To open a long position. Using a market stop order.
Red line at the bottom - the level from a local low bar. To open a short position. Using a market stop order.
Trading
You can trade without short positions. Then the red line is the level for a stop-loss order.
Reverse trading can be used. Without stop-loss orders.
Risk size
Order size depends on the risk size parameter and possible loss. If risk size = 2%, it means that the loss will be no more than 2%.
For crypto
Symbols: XBT/USD, BTC /USD, BTC /USDT, ETH/USD, etc - need USD(T)
Timeframes: 1h, 4h, 1d
This new ZZ strategy includes all the best practices for this strategy. the script has great flexibility of settings.
Instructions for script parameters:
Parameter ZZ Type - is responsible for the basic type of strategy used (usually it is responsible for building levels)
then you will need to configure the settings block corresponding to the selected ZZ type .
At the moment the script contains types: ZZ2 + ZZ6
The rest of the parameters are common for any type of ZZ.
Further development will be done in this script. The above scripts will not be updated.
At the moment the options are already available:
- Take Profit
- Stop Loss
- One entry Long/Short
- Single entry
- Levels offset
- Levels multiplier
- Levels angle
Divergence-Support/ResistenceAnother script based on zigzag, divergence, and to yield support and resistence levels.
This idea started with below two concepts:
▶ Support and resistence are simply levels where price has rejected to go further down or up. Usually, we can derive this based on pivots. But, if we start looking at every pivot, there will be many of them and may be confusing to understand which one to consider.
▶ Lot of people asked about one of my previous script on divergence detector on how to use it. I believe divergence should be considered as area of support and resistence because, they only amount to temporary weakness in momentum and nothing more. As per my understanding
Trend > Hidden Divergence > Divergence > Oscillator Levels of Overbought and Oversold
⬜ Process
▶ Now combining the above two concepts - what we are trying to do here is draw support resistence lines only on pivots which has observed either divergence or hidden divergence. Continuation and indecision pivots are ignored.
▶ Input requires only few parameters.
Zigzag lengths and oscillator to be used. Oscillator periods are automatically calculated based on zigzag length. Hence no other information required. You can also chose custom oscillator via external source.
▶ Display include horizontal lines of support/resistence which are drawn from the candle from where divergence or hidden divergence is detected.
▶ Support resistence lines are colored based on divergence. Green shades for bullish divergence and bullish hidden divergence whereas red shades for bearish divervence and bearish hidden divergence. Please note, red and green lines does not mean they only provide resistence or support. Any lines which are below the price should be treated as support and any line which are above the price should be treated as resistence.
▶ Divergence symbols are also printed on the bar from where divergence/hidden divergence is detected.
↗ - Bullish Hidden Divergence
↘ - Bearish Hidden Divergence
⤴ - Bullish Divergence
⤵ - Bearish Divergence
▶ Script also demonstrates usage of libraries effectively. I have used following libraries in this code.
import HeWhoMustNotBeNamed/ zigzag /2 as zg
import HeWhoMustNotBeNamed/enhanced_ta/8 as eta
import HeWhoMustNotBeNamed/ supertrend /4 as st
Can be good combination to use it with harmonic patterns.

3rd WaveHello All,
In Elliott Wave Theory, 3rd wave is not the shortest one in the waves 1/3/5 and it's usually longest one. so if we can catch it then we may get good opportunities to trade. This script finds 3rd wave experimentally. it can be also the 3rd waves in the waves 1, 3, 5, A and C. the 3rd wave should have greater volume than other waves, the script can check its volume and compare with the volumes of the waves 1 and 2 optionally.
Pine Team released Pine version 5! This script was developed in v5 and it uses Library feature of Pine v5 for the zigzag functions. This script is also an example for the Pine developers who learn Pine v5 and Libraries.
Options:
Zigzag Period: is the length that is used to calculate highest/lowest and the zigzag waves
Min/Max Retracements: is the retracement rates to check the wave 2 according to wave 1. for example; if min/max values are 0.500-0.618 then wave 2 must be minimum 0.500 of wave 1 and maximum 0.618 of wave 1.
Check Volume Support: is an option to compare the volumes of1. 2. and . waves. if you enable this option then the script checks their volume and 3rd wave volume must be greater then 1 and 2
there are 4 options for the targets. you can enable/disable and change their levels. targets are calculated using length of wave 1.
Options to show breakout zone, zigzag, wave 1 and 2.
and some options for the colors.
The Library that is used in this script:
P.S. This is an experimental work and can be improved. So do not hesitate to drop your comments under the script ;)
Enjoy!

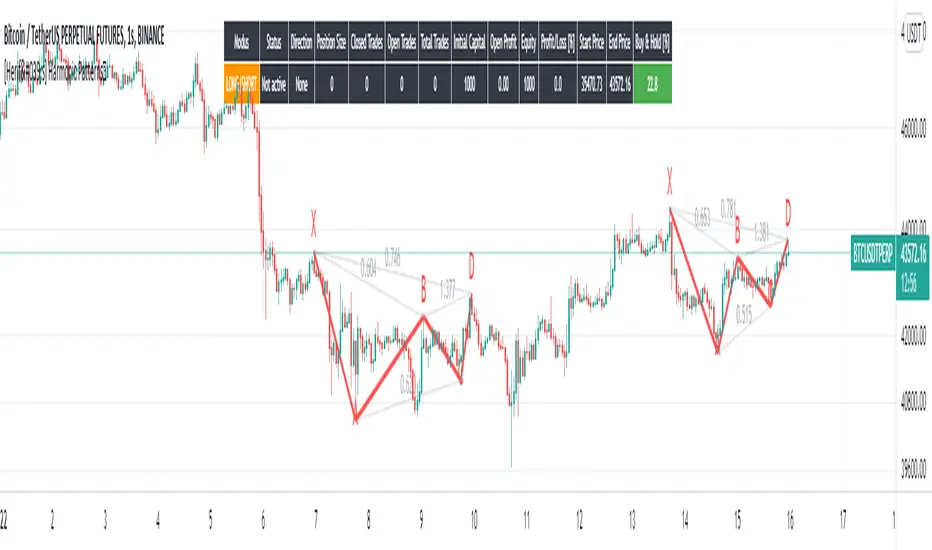
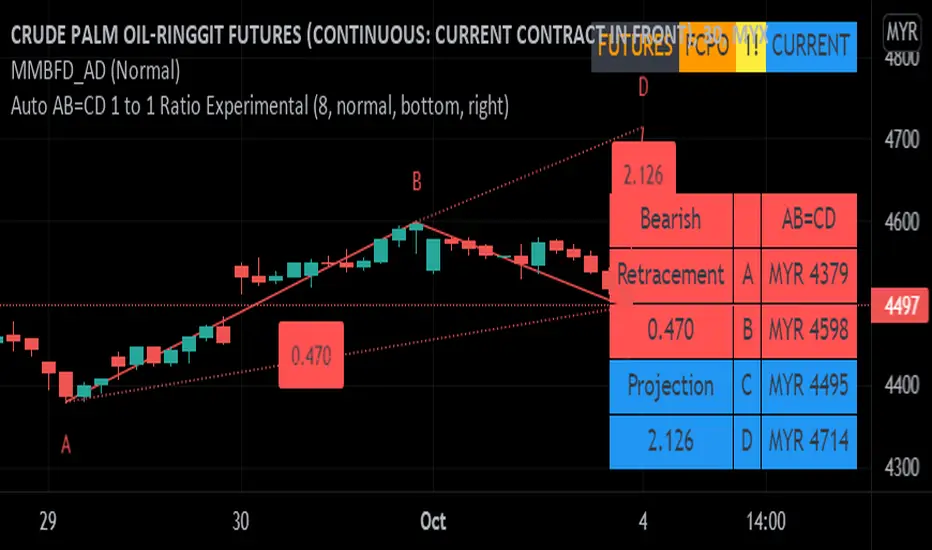
Auto AB=CD 1 to 1 Ratio ExperimentalThis indicator was experimental based AB=CD, shows last AB=CD either Standard AB=CD or Reciprocal AB=CD which uses time instead of bar_index.
This build is based upon educational materials (refer below resources).
ABCD are based on 1 to 1 Ratio for price and time.
Features / Pros:
1. Show last AB=CD points and lines including table value.
2. Customize table position and size.
3. For desktop display only, not for mobile.
Cons:
1. Time for point D less accurate for intraday timeframe (minute, hour, etc) which may including holidays and depends on price volatility.
2. Label ratio not shown properly depends on timeframe especially for intraday timeframe and maybe for Daily and Weekly timeframe.
3. Experimental code, use at your own risk.
FAQ
1. Credits
Scott M Carney, Harmonic Trading: Volume One and Two.
LonesomeTheBlue for zigzag array source code.
HeWhoMustNotBeNamed for some guidance and advice.
2. Previous Build / Resources
Link 1
Link 2
Link 3
Link 4
3. Code Usage
Free to use for personal usage.
Left : Bullish AB=CD, Right : Bullish Reciprocal AB=CD
Left : Bearish AB=CD, Right : Bearish Reciprocal AB=CD
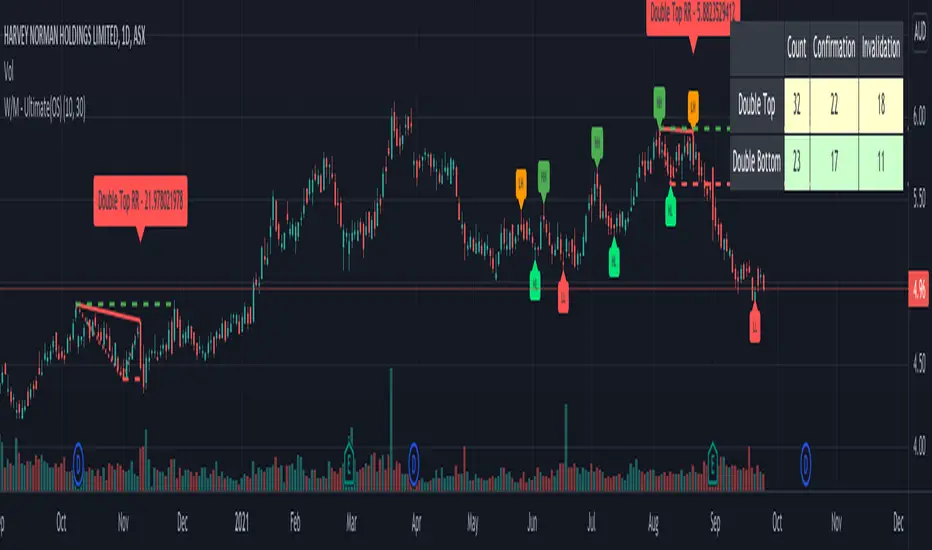
Double Top/Bottom - Ultimate (OS)This is zigzag based double top/bottom indicator. Code is same as : Double-Top-Bottom-Ultimate
But, republishing it to make it available open source.
Double Top:
Recognition - Checks on Zigzag if LH is followed by HH
Confirmation - When low crosses under last lower pivot point on zigzag
Invalidation - When high crosses over HH
Double Bottom:
Recognition - Checks on Zigzag if HL is followed by LL
Confirmation - When high crosses over last higher pivot point on zigzag
Invalidation - When low crosses under LL
Few input options:
Option to display risk per reward which defines how steep is the W-M triangle. This is simply the ratio of price difference between mid point to top most and bottom most points. In case of double top , downside is considered as reward and upside is considered as risk and with double bottom , downside is considered as risk and upside is considered as reward. Lower risk per reward signifies better trade.
Option to display stats which shows number of occurances of double top and bottom and how many times price crossed confirmation point and invalidation point (which are also marked with dashed lines) Stats are color coded. Higher confirmation rates are colored in shades of green, lower confirmation rates are colored in shades of orange whereas the neutral confirmation rates are coloed in light yellow.
Multi-ZigZag Multi-Oscillator Trend DetectorThis table is intended to give you snapshot of how price and oscillators are moving along with zigzag pivots.
This is done in the same lines of Zigzag-Trend-Divergence-Detector
But, here are the differences
Table shows multiple oscillator movements at a same time instead of one selected oscillator
Divergence is not calculated and also supertrend based trend. Trend can be calculated based on zigzag movements. However, lets keep this for future enhancements.
This system also uses multiple zigzags instead of just one.
⬜ Process
▶ Derive multiple zigzags - Code is taken from Multi-ZigZag
▶ Along with zigzags - also calculate different oscillators and attach it to zigzag pivot.
▶ Calculate directions of zigzag pivots and corresponding oscillators.
▶ Plot everything in the table on last bar.
⬜ Table components
Table contains following data:
Directional legends are:
⇈ - Higher High (Green)
⇊ - Lower Low (Red)
⭡- Lower High (Orange)
⭣ - Higher Low (Lime)
⬜ Input Parameters
▶ Source : Default is close. If Unchecked - uses high/low data for calculating pivots. Can also use external input such as OBV
▶ Stats : Gives option to select the depth of output (History) and also lets you chose text size and table position.
▶ Oscillators : Oscillator length is derived by multiplying multiplier to zigzag length. For example, for zigzag 5, with 4 as multiplier, all oscillators are calculated with length 20. But, same for zigzag 8 will be 32 and so on.
▶ Available oscillators :
CCI - Commodity Channel Index
CMO - Chande Momentum Oscillator
COG - Center Of Gravity
MFI - Money Flow Index (Shows only if volume is present)
MOM - Momentum oscillator
ROC - Rate Of Change
RSI - Relative Strength Index
TSI - Total Strength Index
WPR - William Percent R
BB - Bollinger Percent B
KC - Keltner Channel Percent K
DC - Donchian Channel Percent D
ADC - Adoptive Donchian Channel Percent D ( Adoptive-Donchian-Channel )
⬜ Challenges
There are 12 oscillators and each zigzag has different length. Which means, there are 48 combinations of the ocillators.
First challenge was generating these values without creating lots of static initialization. Also, note, if the functions are not called on each bar, then they will not yield correct result. This is achieved through initializer function which runs on every bar and stores the oscillator values in an array which emulates multi dimensional array oscillator X zigzag length.
Next challenge was getting these values within function when we need it. While doing so I realized that values stored in array also have historical series and calling array.get will actully get you the entire series and not just the value. This is an important takeaway for me and this can be used for further complex implementations.
Thanks to @LonesomeTheBlue and @LucF for some timely suggestions and interesting technical discussions :)

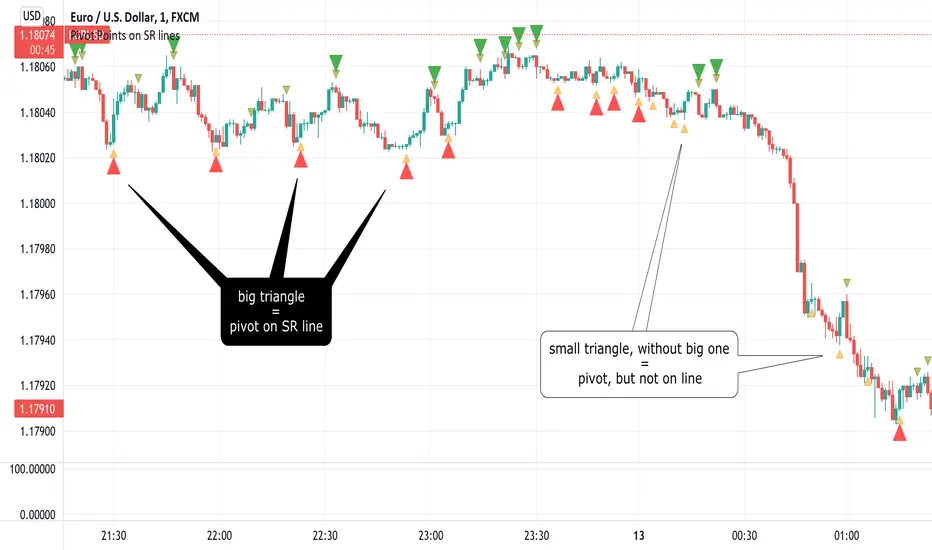
Pivot Points on SR linesAnalyzing price movements for a few years taught me one thing - markets always reverse bouncing off some horizontal Support/Resistance level. The only exception to this rule is when market pops new ATH (All Time High), which certainly happened in so-called "price discovery" run - this asset has never been in this space before, so no Support/Resistance could have been formed, while the rally had to stop at some point anyway.
In all other cases, analyzing past market movements, you will be able to find a place where the market reversed or gathered before. The difficulty is to understand (or guess?) from which S/R level market will reverse right now, because there are many of them. Even if this is probably not possible to make such guess correctly and always, it is good to know when potential reversal shown by whatever indicator you're using happened on SR line or in the middle of nowhere. That last case would turn out to be fake to your worst regrets. Ability to filter-out all those fake pivots is a value my indicator delivers.
Example? It is very often considered an entry signal when Stochastic %K and %D lines cross each other, especially in overbought/oversold area. It could work quite well in sideways markets, but when a trend begins, Stochastic would report CONSECUTIVE counter-trend signals, draining your trading balance to zero quickly. But this trend took place in price-discovery area (not necessarily when going for the new ATH ), so all those counter-trend signals happened not at S/R levels. Hence, they should be ignored.
Big triangles mark pivot point which happened on the S/R line. Small triangles - in the middle of nowhere.
How good is it? I compared it with one of my previous scripts, the "PivotPoints with Momentum confirmation" (), this new script confirms only 1/3 of pivots in the old script on 1m EURUSD chart. Filtering out 2/3 of potentially bad entries is a good result, I'd say :)
This script also fires alerts - alert is triggered as soon as PivotPoint is noticed, on a candle close.
I strongly recommend NOT using it not using this indicator as a standalone indicator. There is so much information you should take into consideration as well - market bias, volume , higher timeframe trend... To make it convenient to join PivotPoints information with other indicators, I have "exported" one plot so you can include it in your own - just use input.source in your own code to have it return 1 for PivotLow ( aka Long entry) and -1 for PivotHigh ( aka Short entry).
Pivot Points on SR lines DEMOAnalyzing price movements for a few years taught me one thing - markets always reverse bouncing off some horizontal Support/Resistance level. The only exception to this rule is when market pops new ATH (All Time High), which certainly happened in so-called "price discovery" run - this asset has never been in this space before, so no Support/Resistance could have been formed, while the rally had to stop at some point anyway.
In all other cases, analyzing past market movements, you will be able to find a place where the market reversed or gathered before. The difficulty is to understand (or guess?) from which S/R level market will reverse right now, because there are many of them. Even if this is probably not possible to make such guess correctly and always, it is good to know when potential reversal shown by whatever indicator you're using happened on SR line or in the middle of nowhere. That last case would turn out to be fake to your worst regrets. Ability to filter-out all those fake pivots is a value my indicator delivers.
Example? It is very often considered an entry signal when Stochastic %K and %D lines cross each other, especially in overbought/oversold area. It could work quite well in sideways markets, but when a trend begins, Stochastic would report CONSECUTIVE counter-trend signals, draining your trading balance to zero quickly. But this trend took place in price-discovery area (not necessarily when going for the new ATH ), so all those counter-trend signals happened not at S/R levels. Hence, they should be ignored.
Big triangles mark pivot point which happened on the S/R line. Small triangles - in the middle of nowhere.
How good is it? I compared it with one of my previous scripts, the "PivotPoints with Momentum confirmation" (), this new script confirms only 1/3 of pivots in the old script on 1m EURUSD chart. Filtering out 2/3 of potentially bad entries is a good result, I'd say :)
This script also fires alerts - alert is triggered as soon as PivotPoint is noticed, on a candle close.
I strongly recommend NOT using it not using this indicator as a standalone indicator. There is so much information you should take into consideration as well - market bias, volume , higher timeframe trend... To make it convenient to join PivotPoints information with other indicators, I have "exported" one plot so you can include it in your own - just use input.source in your own code to have it return 1 for PivotLow ( aka Long entry) and -1 for PivotHigh ( aka Short entry).

Zigzag Trend/Divergence DetectorPullbacks are always hardest part of the trade and when it happen, we struggle to make decision on whether to continue the trade and wait for recovery or cut losses. Similarly, when an instrument is trending well, it is often difficult decision to make if we want to take some profit off the table. This indicator is aimed to make these decisions easier by providing a combined opinion of sentiment based on trend and possible divergence.
⬜ Process
▶ Use any indicator to find trend bias. Here we are using simple supertrend
▶ Use any oscillator. I have added few inbuilt oscillators as option. Default used is RSI.
▶ Find divergence by using zigzag to detect pivot high/low of price and observing indicator movement difference between subsequent pivots in the same direction.
▶ Combine divregence type, divergence bias and trend bias to derive overall sentiment.
Complete details of all the possible combinations are present here along with table legend
⬜Chart Legend
C - Continuation
D - Divergence
H - Hidden Divergence
I - Indeterminate
⬜ Settings
▶ Zigzag parameters : These let you chose zigzag properties. If you check "Use confirmed pivots", then unconfirmed pivot will be ignored in the table and in the chart
▶ Oscillator parameters : Lets you select different oscillators and settings. Available oscillators involve
CCI - Commodity Channel Index
CMO - Chande Momentum Oscillator
COG - Center Of Gravity
DMI - Directional Movement Index (Only ADX is used here)
MACD - Moving average convergence divergence (Can chose either histogram or MACD line)
MFI - Money Flow Index
MOM - Momentum oscillator
ROC - Rate Of Change
RSI - Relative Strength Index
TSI - Total Strength Index
WPR - William Percent R
BB - Bollinger Percent B
KC - Keltner Channel Percent K
DC - Donchian Channel Percent D
ADC - Adoptive Donchian Channel Percent D ( Adoptive-Donchian-Channel )
▶ Trend bias : Supertrend is used for trend bias. Coloring option color candles in the direction of supertrend. More option for trend bias can be added in future.
▶ Stats : Enables you to display history in tabular format.
Overview of settings present here:
⬜ Notes
Trend detection is done only with respect to previous pivot in the same direction. Hence, if chart has too many zigzags in short period, try increasing the zigzag length or chart timeframe. Similarly, if there is a steep trend, use lower timeframe charts to dig further.
Oscillators does not always make pivots at same bar as price. Due to this some the divergence calculation may not be correct. Hence visual inspection is always recommended.
⬜ Possible future enhancements
More options for trend bias
Enhance divergence calculation. Possible options include using oscillator based zigzag as primary or using close prices based zigzag instead of high/low.
Multi level zigzag option - Can be messy to include more than one zigzag. Option can be added to chose either Level1 or Level2 zigzags.
Alerts - Alerts can only be added for confirmed pivots - otherwise it will generate too many unwanted alerts. Will think about it :)
If I get time, I will try to make a video.

Momentum-based ZigZag (incl. QQE) NON-REPAINTINGI spent a lot of time searching for the best ZigZag indicator. Difficulty with all of them is that they are always betting on some pre-defined rules which identify or confirm pivot points. Usually it is time factor - pivot point gets confirmed after a particular number of candles. This methodology is probably the best when market is moving relatively slow, but when price starts chopping up and down, there is no way the ZigZag follows accurately. On the other hand if you set it too tight (for example pivot confirmation after only 2 or even 1 candle), you will get hundreds of zigzag lines and they will tell you nothing.
My point of view is to follow the market. If it has reversed, then it has reversed, and there is no need to wait pre-defined number of candles for the confirmation. Such reversals will always be visible on momentum indicators, such as the most popular MACD. But a single-line moving average can be also good enough to notice reversals. Or my favourite one - QQE, which I borrowed (and improved) from JustUncleL, who borrowed it from Glaz, who borrowed it from... I don't even know where Quantitative Qualitative Estimation originates from. Thanks to all these guys for their input and code.
So whichever momentum indicator you choose - yes, there is a pick-your-poison-type selector as in in-famous Moving Average indicators - once it reverses, a highest (or lowest) point from the impulse is caught and ZigZag gets printed.
One thing I need to emphasize. This indicator DOES NOT REPAINT. It might look like the lines are a bit delayed, especially when compared to all the other ZigZag indicators on TradingView, but they are actually TRUE. There is a value in this - my indicator prints pivot points and Zigzag exactly on the moment they have been noticed, not earlier faking to be faster than they could be.
As a bonus, the indicator marks which impulse had strength in it. It is very nice to see a progressing impulse, but without force - a very likely that reversal on a bigger move is happening.
I'm about to publish some more scripts based on this ZigZag algo, so follow me on TradingView to get notified.
Enjoy!

zigzag support&resistance multi timeframe levels [LM]Hello Traders,
I would like to introduce you zigzag support&resistance multi timeframe levels. It is based on the ZigZag semafor script made by DevLucem so shout out to him
The Semafor is used to spot future multi-level Supports and Resistance zones.
It is also useful to spot HL or LL or HH or LH zones at different Depth settings.
I's the same zigzag indicator as my other zigzag indicator with distinction that supports multi timeframe levels as well, with depth setting for every timeframe.
I hope you will enjoy it as I enjoyed to write it.
Lukas
