4GOOGL交易想法


GOOG(谷歌) 站上布林线上限、三角旗形突破,目標226、239免責聲明:
我的全部視頻都是我個人觀點的分享,非投資建議,而且我的想法不一定全部都是正確,大家在做決定前一定要獨立思考、仔細評估。我無法為大家的盈利或損失負責。投資有風險,投資需謹慎。

12/12 谷歌(GOOG) 巨陽創高中繼再漲,近期目標價212、2231、 技術指標分析
布林軌道線
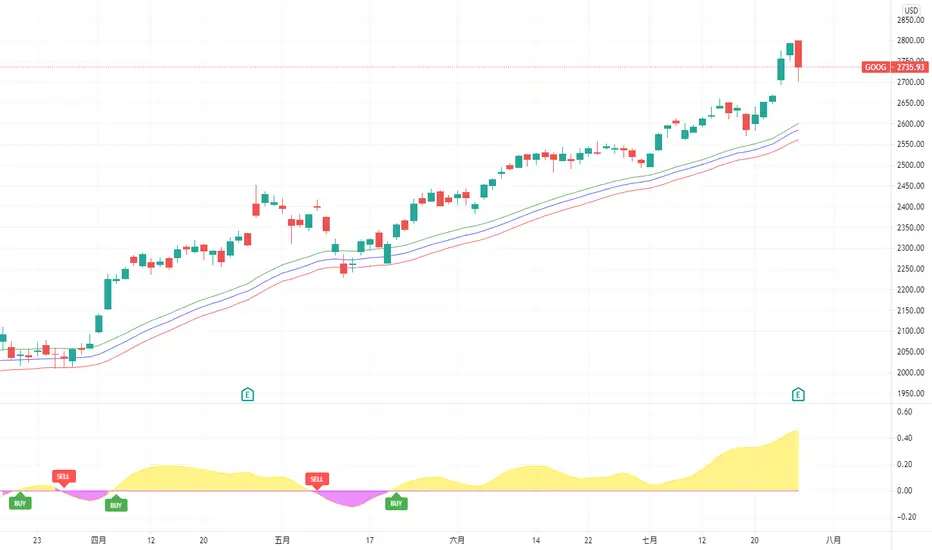
股價已突破布林上軌,並伴隨布林帶擴張與中軸上彎,顯示多頭趨勢強勢確立。
當股價位於布林中軸以上,建議偏多操作,尤其突破上軌後,多頭行情更為明確。
MACD
MACD 指標已翻多,柱狀體逐步放大,顯示上漲動能增強,短期內具備持續上漲的條件。
RSI
RSI 已進入超買區,但這並非行情結束的信號,而是多頭趨勢進一步確認。通常 RSI 超買區內股價仍可能持續攀升。
2.、波浪理論與目標價預測
根據波浪理論,谷歌目前處於 第三浪(主升浪),這是一波行情中通常最強、最長的一浪。
結合缺口理論與惠波納契擴展線計算,預測近期目標價為:
212.52 美元(缺口理論計算)
223 美元(惠波納契 1.618 延伸目標)
3、量價結構分析
累積增量
成交量顯示主力籌碼吸收完畢,量價結構呈現「量先價行」的多方格局,成交量創高後股價隨即上漲表態。若成交量出現遞減,需警惕主力可能開始逐步出貨。
支撐與壓力
近期突破的前高已轉化為重要支撐,建議投資者關注大陽線低點作為多單支撐參考。
4、操作建議
回調布局:若股價短期出現回調,建議將回調視為進場良機,可在關鍵支撐位附近逢低布局多單。
風險管理:合理設置停損,尤其當股價跌破重要支撐位時應及時止損,避免過度持倉風險。
👉 如果您覺得這份分析對您有幫助,請 點贊、留言與訂閱 支持金老師,未來將持續為您帶來更詳細的技術分析與市場解讀!
免責聲明:
我的全部視頻都是我個人觀點的分享,非投資建議,而且我的想法不一定全部都是正確,大家在做決定前一定要獨立思考、仔細評估。我無法為大家的盈利或損失負責。投資有風險,投資需謹慎。

GOOGLE: 谷歌:蝙蝠/黑天鵝/沃爾夫波。谷歌:蝙蝠/黑天鵝/沃爾夫波。
谷歌/Alphabet是“七巨頭”之一,近幾個月的表現無可爭議。 然而,即使基本面都是綠色的,山景社會中也可能存在一隻“黑天鵝”,這隻黑天鵝甚至可能長著司法部的面孔。 事實上,幾天來,法官們一直在挖掘過去的歷史,以查明谷歌是否會濫用和利用財務操縱來獲得在搜索引擎中的主導地位。
無論我們是否同意這個陰謀論,我們都不能忽視這樣一個事實:政府會想以身作則,剝奪谷歌目前的特權——比如成為蘋果的默認搜索引擎——這一假設甚至可能證明嚴重調整的可能性是合理的,即使從長遠來看,它也不應該產生太大的影響。 除此之外,七雄在 2023 年的集會後已經疲憊不堪,一場“完美風暴”即將籠罩山景城。

GOOGL, 10d+/16.25%上升周期 大於10天 16.25%
rising cycle 16.25% more than 10 days.
==================================================================================================================================================================
此數據為機器人分析。 根據亞當理論分析歷史趨勢(20移動平均線/60移動平均線/120移動平均線/240移動平均線),估計未來 10 天的趨勢。 白線為機器人預期價格,上下橫線為止損止盈價,無財務根據,結果僅供參考。
This data is analyzed by robots. Analyze historical trends based on The Adam Theory of Markets (20 moving averages/60 moving averages/120 moving averages/240 moving averages) and estimate the trend in the next 10 days. The white line is the robot's expected price, and the upper and lower horizontal line stop loss and stop profit prices have no financial basis. The results are for reference only.

GOOGL, 9d/-8.36%下降週期 9d/-8.36%
falling cycle -8.36% in 9 days
==================================================================================================================================================================
此數據為機器人分析。 根據亞當理論分析歷史趨勢(20移動平均線/60移動平均線/120移動平均線/240移動平均線),估計未來 10 天的趨勢。 白線為機器人預期價格,上下橫線為止損止盈價,無財務根據,結果僅供參考。
This data is analyzed by robots. Analyze historical trends based on The Adam Theory of Markets (20 moving averages/60 moving averages/120 moving averages/240 moving averages) and estimate the trend in the next 10 days. The white line is the robot's expected price, and the upper and lower horizontal line stop loss and stop profit prices have no financial basis. The results are for reference only.

GOOGL, 10d+/-25.23%下降週期 大於10天 -25.23%
falling cycle -25.23% more than 10 days.
==================================================================================================================================================================
此數據為機器人分析。 根據亞當理論分析歷史趨勢(20移動平均線/60移動平均線/120移動平均線/240移動平均線),估計未來 10 天的趨勢。 白線為機器人預期價格,上下橫線為止損止盈價,無財務根據,結果僅供參考。
This data is analyzed by robots. Analyze historical trends based on The Adam Theory of Markets (20 moving averages/60 moving averages/120 moving averages/240 moving averages) and estimate the trend in the next 10 days. The white line is the robot's expected price, and the upper and lower horizontal line stop loss and stop profit prices have no financial basis. The results are for reference only.

GOOGL, 10d+/26.84%上升週期 大於10天 26.84%
rising cycle 26.84% more than 10 days.
==================================================================================================================================================================
此數據為機器人分析。 根據亞當理論分析歷史趨勢(20移動平均線/60移動平均線/120移動平均線/240移動平均線),估計未來 10 天的趨勢。 白線為機器人預期價格,上下橫線為止損止盈價,無財務根據,結果僅供參考。
This data is analyzed by robots. Analyze historical trends based on The Adam Theory of Markets (20 moving averages/60 moving averages/120 moving averages/240 moving averages) and estimate the trend in the next 10 days. The white line is the robot's expected price, and the upper and lower horizontal line stop loss and stop profit prices have no financial basis. The results are for reference only.

GOOGL, 6d/-12.91%下降週期 6天 -12.91%
falling cycle -12.91% in 6 days.
==================================================================================================================================================================
此數據為機器人分析。 根據亞當理論分析歷史趨勢(20移動平均線/60移動平均線/120移動平均線/240移動平均線),估計未來 10 天的趨勢。 白線為機器人預期價格,上下橫線為止損止盈價,無財務根據,結果僅供參考。
This data is analyzed by robots. Analyze historical trends based on The Adam Theory of Markets (20 moving averages/60 moving averages/120 moving averages/240 moving averages) and estimate the trend in the next 10 days. The white line is the robot's expected price, and the upper and lower horizontal line stop loss and stop profit prices have no financial basis. The results are for reference only.

GOOGLE, 9d/8.34%上升週期 9d/8.34%
rising cycle 8.34% in 9 days.
==================================================================================================================================================================
此數據為機器人分析。 根據亞當理論分析歷史趨勢(20移動平均線/60移動平均線/120移動平均線/240移動平均線),估計未來 10 天的趨勢。 白線為機器人預期價格,上下橫線為止損止盈價,無財務根據,結果僅供參考。
This data is analyzed by robots. Analyze historical trends based on The Adam Theory of Markets (20 moving averages/60 moving averages/120 moving averages/240 moving averages) and estimate the trend in the next 10 days. The white line is the robot's expected price, and the upper and lower horizontal line stop loss and stop profit prices have no financial basis. The results are for reference only.


GOOGL 日線跌破 Future Carrera!!!GOOGL Future Carrera 日線轉銀燈,要開始注意風險!
日線轉銀燈後,首度跌破 FC,
從 2020 / 11 / 02 亮起藍燈後進入第一波牛市,
2021 / 06/ 09 再度亮起藍燈地入第二波牛市,
總漲幅高達 74.01 %!!
注意 11 月美債的到期日。

美股~Alphabet Inc~大型科技股進軍房地產~谷歌母公司 Alphabet科技巨頭公佈了在曼哈頓購買價值 21 億美元的辦公樓的計劃後,週二小幅上漲。
St. John's Terminal 將成為谷歌紐約園區的主要基地,該園區是該公司在加州以外最大的辦事處。這筆 21 億美元的投資是谷歌計劃用於增加其紐約業務的 2.5 億美元的補充。
今年5/27在Future Carrera指標的協助出現進場訊號,在9/21出現最後出場點訊號,至少可獲得13.94%的正回報。該指標用日線級別來使用,每日只需看一次,輕鬆愜意~當然配合倉位管理,是不可少的!

Google-三角指標示範Delta Compass indicators用來確定市場價格週期
Delta River indicators意味著價格數據中的記憶。任何指標都存在自然延遲,因為我們需要等待Delta Compass指標風向。一旦新的風向被確認,就可以買入/賣出。
每一週我們都會在真實市況和大家實戰,不紙上談兵,直接操作示範。
2021.01.03 NASDAQ GOOG 趨勢分析NASDAQ:GOOG
目前 Google 就是在一個區間中震盪
原來大量的黑 K 往下,但是有在區間低點拉回
現在就是看看能否拉回突破大量黑K 來挑戰區間上緣
不然被壓在大量黑 K 高點下,很容易再跌破區間下緣


