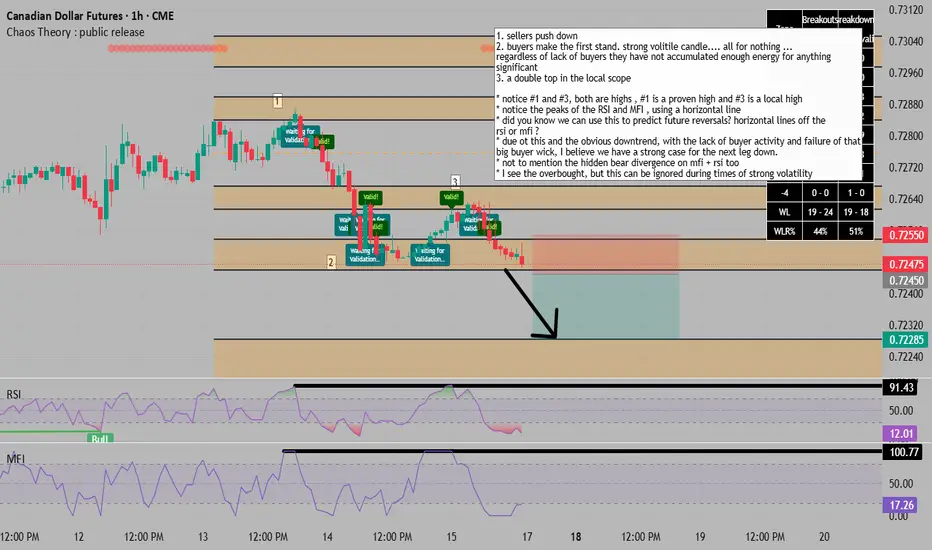
1. sellers push down
2. buyers make the first stand. strong volitile candle.... all for nothing ...
regardless of lack of buyers they have not accumulated enough energy for anything
significant
3. a double top in the local scope
* notice #1 and #3, both are highs , #1 is a proven high and #3 is a local high
* notice the peaks of the RSI and MFI , using a horizontal line
* did you know we can use this to predict future reversals? horizontal lines off the
rsi or mfi ?
* due ot this and the obvious downtrend, with the lack of buyer activity and failure of that
big buyer wick, I believe we have a strong case for the next leg down.
* not to mention the hidden bear divergence on mfi + rsi too
* I see the overbought, but this can be ignored during times of strong volatility
all my paid ( pro ) scripts can be obtained for a low price of 19.99 / month at : whop.com/sabr-pro-tools/access-to-all-pro-tools/
免責聲明
The information and publications are not meant to be, and do not constitute, financial, investment, trading, or other types of advice or recommendations supplied or endorsed by TradingView. Read more in the Terms of Use.