* Macro backdrop: U.S. futures are mixed after last week’s rally, with no major overnight catalysts. Tech remains the driver, but profit-taking is possible after recent gains.
* Sector tone: Large-cap tech is still attracting flows, though traders are selective. Apple is rebounding from a recent sharp drop.
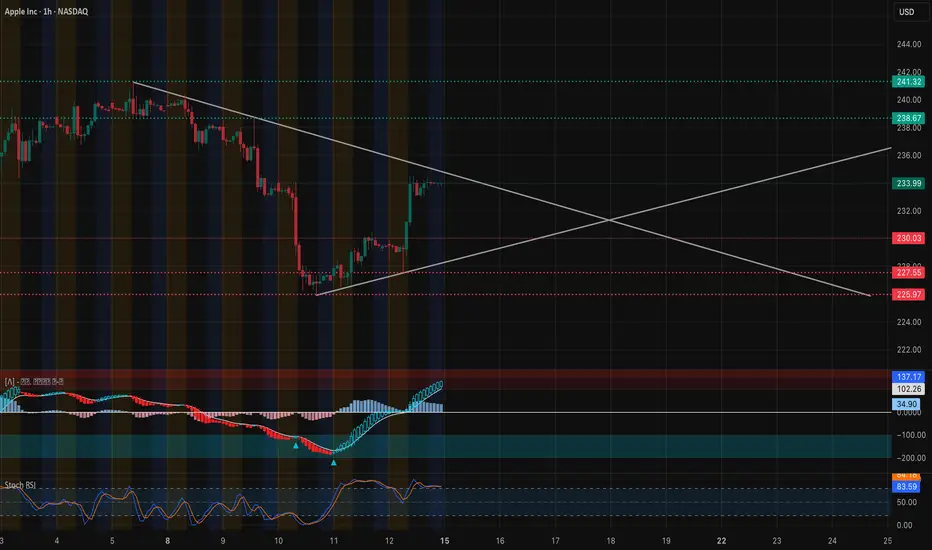
Technical Analysis – AAPL
Trend & Structure (1-Hour Chart)
* Price is forming a symmetrical triangle after bouncing from $226 lows.
* The triangle’s apex is near mid-week, suggesting an imminent breakout.
Key Levels
* Resistance: $235.8 (near-term breakout point), $238.7 (3rd Call Wall), $241.3 (Gamma Wall / major resistance).
* Support: $230.0 (short-term pivot), $227.5 (interim), $225.9 (major support).
Momentum & Indicators
* MACD on 1H is bullish and climbing.
* Stoch RSI is high but not yet diverging—watch for cooling before a move.
* Volume is improving on upward tests, signaling accumulation.
Options/GEX Insight
* Highest positive NETGEX and Call resistance sit near $241.3, aligning with chart resistance.
* IVR 13.1 and IVx avg 25.4 indicate modest volatility and room for expansion if a breakout occurs.
Trade Scenarios for Sept 15
* Bullish Plan:
* Entry: Break and hold above $235.8.
* Targets: $238.7 → $241.3.
* Stop: Below $230.0.
* Bearish/defensive (if triangle breaks down):
* Entry: Break below $230.0.
* Targets: $227.5 → $225.9.
* Stop: Above $235.8.
Summary
Apple enters Monday inside a tightening triangle. A breakout above $235.8 may target $238.7–241.3, while a breakdown below $230 could pull price back to the mid-$220s.
Disclaimer: This analysis is for educational purposes only and does not constitute financial advice. Always do your own research and manage risk before trading.
免責聲明
這些資訊和出版物並非旨在提供,也不構成TradingView提供或認可的任何形式的財務、投資、交易或其他類型的建議或推薦。請閱讀使用條款以了解更多資訊。
免責聲明
這些資訊和出版物並非旨在提供,也不構成TradingView提供或認可的任何形式的財務、投資、交易或其他類型的建議或推薦。請閱讀使用條款以了解更多資訊。