Hello?
Dear traders, nice to meet you.
"Like" is a huge force for me.
By "following" you can always get new information quickly.
Thank you for always supporting me.
-------------------------------------------------- -----
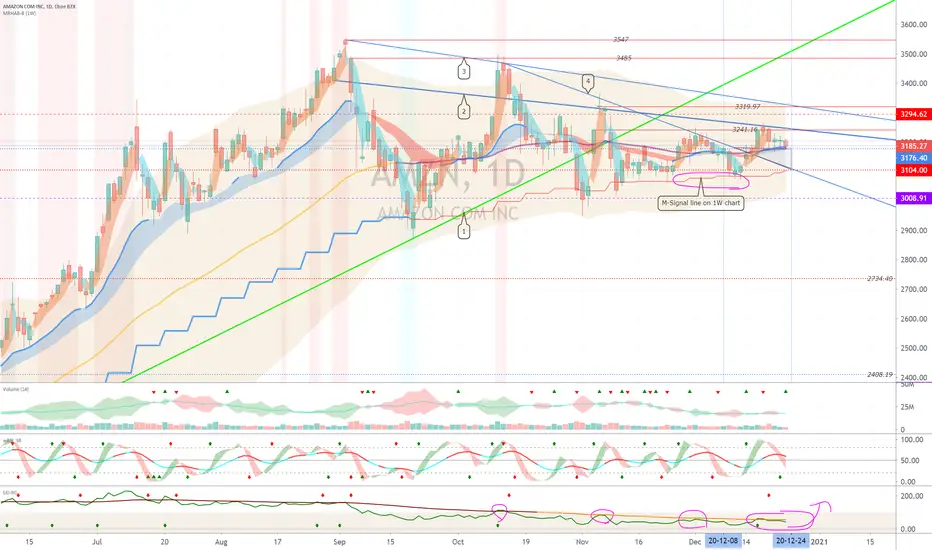
It remains to be seen if the volatility around December 24 leads to a movement that deviates from the 3104.0-3294.62 range.
It is of paramount importance to get support at the 3176.40 point.
We need a volume to break above the downtrend line (2)-(3).
If you move down from the downtrend line (4), you may fall below the 3008.91 point, so you need to trade carefully.
----------------------------
(DJI 1D chart)

It started with an increase in the gap (30015.5-30046.7) and closed at 0.38%.
We have to see if it can be maintained above the 29933.8 point.
-----------------------------
(IXIC 1D chart)

It started with the gap (12807.9-12834.9) rising and closed at -0.29%.
We need to see if it can rise along the uptrend line (2).
-------------------------------
(SPX 1D chart)

It started with the gap (3687.3-3693.4) rising and closed at 0.07%.
We have to see if it can rise in the rising channel.
-------------------------------
(XAUUSD 1D chart)

You should watch for any movement that deviates from the 1830.705-1899.330 segment.
--------------------------------------
(USOIL 1D chart)

You should watch for any movement that deviates from the 42.76-49.17 segment.
It remains to be seen if the volatility around December 30 could break above the 49.17 point.
-------------------------------------------------- -------------------------------------------
** All indicators are lagging indicators.
So, it's important to be aware that the indicator moves accordingly with the movement of price and volume.
Just for convenience, we are talking upside down for interpretation of the indicators.
** The wRSI_SR indicator is an indicator created by adding settings and options from the existing Stochastic RSI indicator. Hence, the interpretation is the same as the conventional Stochastic RSI indicator. (K, D line -> R, S line)
** CCI-RC indicator is an indicator created by changing the set value from the existing CCI indicator. Therefore, the interpretation is the same as the existing CCI indicator.
** Check support, resistance, and abbreviation points.
** Support or resistance is based on the closing price of the 1D chart.
** All explanations are for reference only and do not guarantee profit or loss on investment.
Explanation of abbreviations displayed on the chart
R: A point or section of resistance that requires a response to preserve profits
S-L: Stop-Loss point or section
S: A point or segment that can be bought for profit generation as a support point or segment
(Short-term Stop Loss can be said to be a point where profits and losses can be preserved or additionally entered through installment trading. You should trade from a short-term investment perspective.)
GAP refers to the difference in prices that occurred when the stock market, CME and BAKKT exchanges were closed because they do not trade 24 hours a day.
G1: Closed price
G2: Market price at the time of opening
(Example) Gap (G1-G2)
Dear traders, nice to meet you.
"Like" is a huge force for me.
By "following" you can always get new information quickly.
Thank you for always supporting me.
-------------------------------------------------- -----
It remains to be seen if the volatility around December 24 leads to a movement that deviates from the 3104.0-3294.62 range.
It is of paramount importance to get support at the 3176.40 point.
We need a volume to break above the downtrend line (2)-(3).
If you move down from the downtrend line (4), you may fall below the 3008.91 point, so you need to trade carefully.
----------------------------
(DJI 1D chart)
It started with an increase in the gap (30015.5-30046.7) and closed at 0.38%.
We have to see if it can be maintained above the 29933.8 point.
-----------------------------
(IXIC 1D chart)
It started with the gap (12807.9-12834.9) rising and closed at -0.29%.
We need to see if it can rise along the uptrend line (2).
-------------------------------
(SPX 1D chart)
It started with the gap (3687.3-3693.4) rising and closed at 0.07%.
We have to see if it can rise in the rising channel.
-------------------------------
(XAUUSD 1D chart)
You should watch for any movement that deviates from the 1830.705-1899.330 segment.
--------------------------------------
(USOIL 1D chart)
You should watch for any movement that deviates from the 42.76-49.17 segment.
It remains to be seen if the volatility around December 30 could break above the 49.17 point.
-------------------------------------------------- -------------------------------------------
** All indicators are lagging indicators.
So, it's important to be aware that the indicator moves accordingly with the movement of price and volume.
Just for convenience, we are talking upside down for interpretation of the indicators.
** The wRSI_SR indicator is an indicator created by adding settings and options from the existing Stochastic RSI indicator. Hence, the interpretation is the same as the conventional Stochastic RSI indicator. (K, D line -> R, S line)
** CCI-RC indicator is an indicator created by changing the set value from the existing CCI indicator. Therefore, the interpretation is the same as the existing CCI indicator.
** Check support, resistance, and abbreviation points.
** Support or resistance is based on the closing price of the 1D chart.
** All explanations are for reference only and do not guarantee profit or loss on investment.
Explanation of abbreviations displayed on the chart
R: A point or section of resistance that requires a response to preserve profits
S-L: Stop-Loss point or section
S: A point or segment that can be bought for profit generation as a support point or segment
(Short-term Stop Loss can be said to be a point where profits and losses can be preserved or additionally entered through installment trading. You should trade from a short-term investment perspective.)
GAP refers to the difference in prices that occurred when the stock market, CME and BAKKT exchanges were closed because they do not trade 24 hours a day.
G1: Closed price
G2: Market price at the time of opening
(Example) Gap (G1-G2)
註釋
(FCEL 1W chart)It broke above the 11.53 point, an important point.
You'll have to get the support at 11.53 and see if you're out of the minimum range to climb.
We have to see if we can climb above the 23.04 point.
註釋
(AAPL 1D chart)We have to see if we can get support at 131.40.
With volatility around December 30th, it remains to be seen if there is any movement that deviates from the 126.91 (upward trend line (6))-137.98 section.
註釋
(NIO 1D chart)We have to see if we can get support and climb at 44.56.
註釋
(GE 1D chart)We have to see if we can climb to the 10.88-11.34 section and get support.
註釋
(MVIS 1M chart)We must climb to the 10.32-13.36 section and see if we can complete the'U'.
If it falls from the 5.60 point, it is a short stop loss.
If it falls from the 3.25 point, a Stop Loss is required to preserve profit and loss.
We have to climb to the 10.32-13.36 section and see if we can create a new wave.
註釋
(FORD (F) 1D chart)If it falls at 8.80, it is a short-term Stop Loss.
It remains to be seen if the volatility around December 28 leads to a movement outside the 8.46-9.41 range.
You also have to see if you can go up along the uptrend line (4).
註釋
(BAC 1D chart)You need to make sure you can get support at the 29.99 point.
You also need to see if you can climb along the uptrend line.
We need to see if we can move up between the uptrend line (3) and the downtrend line (4).
If it falls from the uptrend line, it is a short-term stop loss.
註釋
(NNDM 1D chart)It is expected to create a new wave as it rises above 8.0 points.
We must see if it can rise to the 11.10-13.40 section and break through the volume profile section.
If it falls at 8.0, it is a short-term Stop Loss.
註釋
(FIREEYE INC (FEYE) 1W chart)Ascend to the 21.05-27.89 section and see if you can get off the bottom section
If it falls at the 21.05 point, a Stop Loss is required to preserve profit and loss.
If you climb above 27.89 and get support, you'll have to see if you can create a new wave.
註釋
(MARA 1W chart)If it can move sideways between 6.05-12.84, it is expected to break above 12.84.
If it falls from the 6.05 point, a Stop Loss is required to preserve profit and loss.
註釋
(PLUG 1W chart)You need to make sure you can get support at the 34.90 point.
If it rises above the 38.90 point, it is expected to create a new wave.
If it falls at 34.90, it is a short-term stop loss.
If it falls from the 27.0 point, a Stop Loss is needed to preserve profit and loss.
註釋
(TSLA 1D chart)We have to see if we can get support and climb at 641.76.
If you fall from 627.95, you can touch the 589.56-600.08 section, so it's a short stop loss.
It remains to be seen if there is any movement outside the 600.08-663.20 range due to volatility around December 30th.
Other content (coins, stocks, etc.) is frequently posted on X.
X에 다른 내용(코인, 주식 등)이 자주 게시.
◆ t.me/readCryptoChannel
[HA-MS Indicator]
bit.ly/3YxHgvN
[OBV Indicator]
bit.ly/4dcyny3
X에 다른 내용(코인, 주식 등)이 자주 게시.
◆ t.me/readCryptoChannel
[HA-MS Indicator]
bit.ly/3YxHgvN
[OBV Indicator]
bit.ly/4dcyny3
相關出版品
免責聲明
這些資訊和出版物並不意味著也不構成TradingView提供或認可的金融、投資、交易或其他類型的意見或建議。請在使用條款閱讀更多資訊。