Hello?
Dear traders, nice to meet you.
"Like" is a huge force for me.
By "following" you can always get new information quickly.
Thank you for always supporting me.
-------------------------------------------------- -----
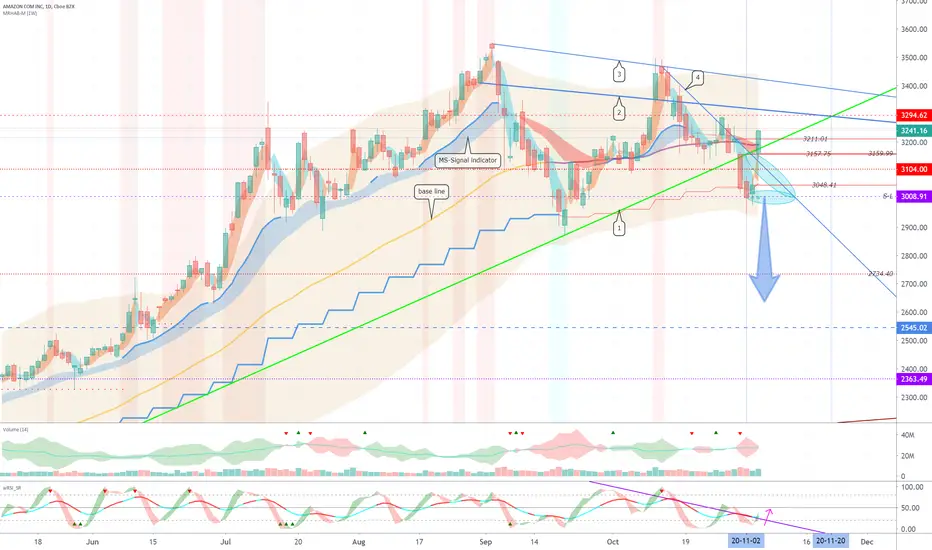
The gap (3048.41-3159.99) started with an increase and ended higher.
We believe that expectations for an uptrend exploded by breaking above the downtrend line (4) and the uptrend line (1).
We need to see if we can get support at 3211.01, the top of the previous gap, and the uptrend line (1).
The possibility is open to drop to 3104.0 to fill the gap.
Therefore, I think careful trading is necessary.
It remains to be seen if it can rise above the resistance zone of the downtrend line (2)-(3).
By around November 20th, we have to watch for movements that deviate from the 3008.91-3296.62 section.
If you fail to keep the 3008.91-3104.0 range, it is likely to fall to 2545.02, making it an important support area.
-------------------------------------------------- ---------------
(DJI 1D chart)

It broke above and closed the MS-Signal indicator, base line, uptrend line (3) and downtrend line (4).
It remains to be seen whether the uptrend will continue along the uptrend line (3).
The gap has continued to rise sharply, so it is possible to reconfirm support at 27272.3.
-------------------------------------------------- -------
(IXIC 1D chart)

It started with the gap (10957.6-11443.8) rising and closed above the uptrend line (2).
It remains to be seen whether the uptrend continues along the uptrend line (2).
It is possible to reconfirm support at 11458.1.
We also have to see if we can climb above the weak support point of 11695.6.
-------------------------------------------------- -----------
(SPX 1D chart)

It started with the gap (3369.2-3406.5) rising and ended higher.
We need to see if it can rise along the uptrend line (3).
You also need to check if you can climb above the 3455.1 point.
-------------------------------------------------- -------------
What the DJI, IXIC, and SPX index charts have in common is that they have risen in succession with gaps.
I think this means that the support base is weak and can lead to a decline at any time.
So, you need to make sure you're getting support from the support points mentioned in each index chart description.
-------------------------------------------------- -------------------------------------------
** Check support, resistance, and abbreviation points.
** Support or resistance is based on the closing price of the 1D chart.
** All explanations are for reference only and do not guarantee profit or loss on investment.
Explanation of abbreviations displayed on the chart
R: A point or section of resistance that requires a response to preserve profits
S-L: Stop-Loss point or section
S: A point or segment that can be bought for profit generation as a support point or segment
(Short-term Stop Loss can be said to be a point where profits and losses can be preserved or additionally entered through installment trading. You should trade from a short-term investment perspective.)
GAP refers to the difference in prices that occurred when the stock market, CME and BAKKT exchanges were closed because they are not trading 24 hours a day.
G1: closing price when closed
G2: Market price at the time of opening
Dear traders, nice to meet you.
"Like" is a huge force for me.
By "following" you can always get new information quickly.
Thank you for always supporting me.
-------------------------------------------------- -----
The gap (3048.41-3159.99) started with an increase and ended higher.
We believe that expectations for an uptrend exploded by breaking above the downtrend line (4) and the uptrend line (1).
We need to see if we can get support at 3211.01, the top of the previous gap, and the uptrend line (1).
The possibility is open to drop to 3104.0 to fill the gap.
Therefore, I think careful trading is necessary.
It remains to be seen if it can rise above the resistance zone of the downtrend line (2)-(3).
By around November 20th, we have to watch for movements that deviate from the 3008.91-3296.62 section.
If you fail to keep the 3008.91-3104.0 range, it is likely to fall to 2545.02, making it an important support area.
-------------------------------------------------- ---------------
(DJI 1D chart)
It broke above and closed the MS-Signal indicator, base line, uptrend line (3) and downtrend line (4).
It remains to be seen whether the uptrend will continue along the uptrend line (3).
The gap has continued to rise sharply, so it is possible to reconfirm support at 27272.3.
-------------------------------------------------- -------
(IXIC 1D chart)
It started with the gap (10957.6-11443.8) rising and closed above the uptrend line (2).
It remains to be seen whether the uptrend continues along the uptrend line (2).
It is possible to reconfirm support at 11458.1.
We also have to see if we can climb above the weak support point of 11695.6.
-------------------------------------------------- -----------
(SPX 1D chart)
It started with the gap (3369.2-3406.5) rising and ended higher.
We need to see if it can rise along the uptrend line (3).
You also need to check if you can climb above the 3455.1 point.
-------------------------------------------------- -------------
What the DJI, IXIC, and SPX index charts have in common is that they have risen in succession with gaps.
I think this means that the support base is weak and can lead to a decline at any time.
So, you need to make sure you're getting support from the support points mentioned in each index chart description.
-------------------------------------------------- -------------------------------------------
** Check support, resistance, and abbreviation points.
** Support or resistance is based on the closing price of the 1D chart.
** All explanations are for reference only and do not guarantee profit or loss on investment.
Explanation of abbreviations displayed on the chart
R: A point or section of resistance that requires a response to preserve profits
S-L: Stop-Loss point or section
S: A point or segment that can be bought for profit generation as a support point or segment
(Short-term Stop Loss can be said to be a point where profits and losses can be preserved or additionally entered through installment trading. You should trade from a short-term investment perspective.)
GAP refers to the difference in prices that occurred when the stock market, CME and BAKKT exchanges were closed because they are not trading 24 hours a day.
G1: closing price when closed
G2: Market price at the time of opening
註釋
(NDAQ 1D chart)It started with the gap (124.91-126.04) rising and closed above the trending point of 128.87.
You need to make sure you get the support at point 128.87.
You should check if you have the force to break through the resistance section of the downtrend line (3)-(4).
If you fall below the 127.03 point, you can touch the 118.83 point, so I think it's the point where you need to trade to preserve profit and loss.
註釋
(NFLX 1D chart)The gap (487.22-495.36) started with a rise and ended higher.
If it falls from the 485.23 point, it could fall below the 465.91 point, which is the point where you need to trade to preserve the profit and loss.
At this point, the gap rose and ended higher above the uptrend line (2).
In order to gain the strength to break above the downtrend line (3) on the 1W chart, I think it is better to start by increasing the volume with an explosive buying or breaking upward with a gap increase.
The reason is that it is located below the MS-Signal index and the base line, so it is in a position that receives a lot of resistance.
Currently, I think it's important to be able to get support at the uptrend line (2) and climb along the trend line.
註釋
(NIO 1D chart)It is rising with successive gap increases.
As a result, it is also moving away from the most recent uptrend line (1).
I think it's time for individual traders to feel psychological pressure due to anxiety about the decline after looking at the charts of successive gap increases.
I think there is a possibility that a test will come out to see where you can get support.
If this test gets support at the uptrend line (1) and rises along the uptrend line (1), I think it's a great trend.
However, the slope of the uptrend line (1) is too steep, so if the support test begins, I think there is a high probability of falling at the uptrend line (1).
Accordingly, it is possible to touch the 32.20 point.
If it falls below the 29.40 point, there is a possibility that it will touch the 21.47 point, so I think you need to trade to preserve the profit and loss.
New investments are not recommended due to a steep uptrend.
註釋
(AAPL 1D chart)The gap (110.44-114.14) started with an increase and ended higher.
We have to see if we can get support above 115.32, the top of the previous gap.
Since the 115.32 point is located above the MS-Signal indicator and base line, it is expected to boost expectations for an uptrend.
It remains to be seen if the downtrend line (5)-(4) can rise above the 120.96 point around November 10, when it intersects.
You also need to see if you can get support from the uptrend line (2) and climb along the trend line.
If the 115.32-111.06 gap is filled, it could fall below the 106.86 point, so I think careful trading is necessary.
註釋
(TWTR 1D chart)It started with the gap (41.73-42.33) rising and ended above the critical point of 42.63.
You need to make sure you get support at 42.63.
If support is gained by an important point located above the 40.97 point of the volume profile, the trend is expected to rise above the 45.33 point of the turning point.
註釋
(FORD (F) 1D chart)Make sure you get the support at 7.62.
If it falls from 7.62, it can fall below 7.24, so this is a short-term Stop Loss.
To rise, you must break above the downtrend line (3).
In addition, while receiving support from the 8.10 point or higher, you must climb through the 8.10-8.80 section, which is the volume profile section, with force.
If you start above 8.80 with a gap rise, you must be supported and climb at 8.50.
If you climb above 8.80 points, I think you are in a position to create a new wave.
Other content (coins, stocks, etc.) is frequently posted on X.
X에 다른 내용(코인, 주식 등)이 자주 게시.
◆ t.me/readCryptoChannel
[HA-MS Indicator]
bit.ly/3YxHgvN
[OBV Indicator]
bit.ly/4dcyny3
X에 다른 내용(코인, 주식 등)이 자주 게시.
◆ t.me/readCryptoChannel
[HA-MS Indicator]
bit.ly/3YxHgvN
[OBV Indicator]
bit.ly/4dcyny3
相關出版品
免責聲明
這些資訊和出版物並不意味著也不構成TradingView提供或認可的金融、投資、交易或其他類型的意見或建議。請在使用條款閱讀更多資訊。