Hello?
Dear traders, nice to meet you.
"Like" is a huge force for me.
By "following" you can always get new information quickly.
Thank you for always supporting me.
-------------------------------------------------- -----
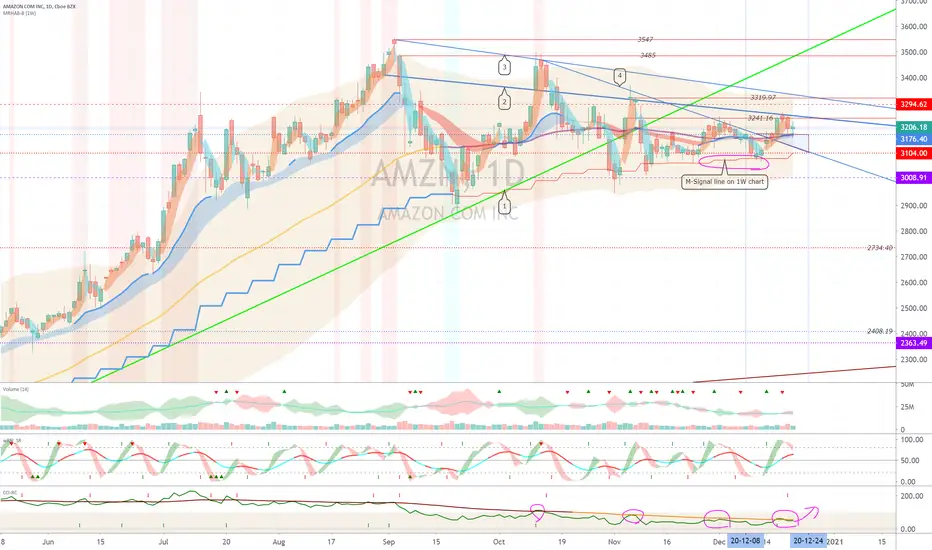
We need to see if we can get support at 3176.4 and break through the downtrend line (2)-(3).
You also need to see if you can climb up and get support at 3294.62.
The M-Signal line on the 1W chart has risen near the 3104.0 point.
Accordingly, if it falls at 3104.0 point, Stop Loss is necessary to preserve profit and loss.
However, you need to be careful because you can touch 3008.91 and rebound.
-----------------------------
(DJI 1D chart)

It started with a drop in the gap (30179.1-30159.0) and closed at 0.12%.
It remains to be seen if the index can be maintained above the 29933.8 point.
-------------------------------
(IXIC 1D chart)

It started with the fall of the gap (12755.6-12596.1) and closed at -0.10%.
The previous gap segment, 12658.2-12730.8, has been filled.
We need to see if it can rise along the uptrend line (2).
---------------------------------
(SPX 1D chart)

It started with a decline in the gap (3709.4-3684.3) and closed at -0.39%.
We have to see if we can climb along the ascent channel.
----------------------------------
(XAUUSD 1D chart)

We have to see if we can get support at 1871.828.
You should watch for any movement that deviates from the uptrend line (4)-downtrend line (5).
This can be interpreted as a movement that deviates from the 1830.705-1899.330 section.
----------------------------------------
(USOIL 1D chart)

We need to see if it can rise along the uptrend line (3).
Also, we have to see if we can get support at 45.76.
-------------------------------------------------- -------------------------------------------
** All indicators are lagging indicators.
So, it's important to be aware that the indicator moves accordingly with the movement of price and volume.
Just for convenience, we are talking upside down for interpretation of the indicators.
** Check support, resistance, and abbreviation points.
** Support or resistance is based on the closing price of the 1D chart.
** All explanations are for reference only and do not guarantee profit or loss on investment.
Explanation of abbreviations displayed on the chart
R: A point or section of resistance that requires a response to preserve profits
S-L: Stop-Loss point or section
S: A point or segment that can be bought for profit generation as a support point or segment
(Short-term Stop Loss can be said to be a point where profits and losses can be preserved or additionally entered through installment trading. You should trade from a short-term investment perspective.)
GAP refers to the difference in prices that occurred when the stock market, CME and BAKKT exchanges were closed because they do not trade 24 hours a day.
G1: Closed price
G2: Market price at the time of opening
(Example) Gap (G1-G2)
Dear traders, nice to meet you.
"Like" is a huge force for me.
By "following" you can always get new information quickly.
Thank you for always supporting me.
-------------------------------------------------- -----
We need to see if we can get support at 3176.4 and break through the downtrend line (2)-(3).
You also need to see if you can climb up and get support at 3294.62.
The M-Signal line on the 1W chart has risen near the 3104.0 point.
Accordingly, if it falls at 3104.0 point, Stop Loss is necessary to preserve profit and loss.
However, you need to be careful because you can touch 3008.91 and rebound.
-----------------------------
(DJI 1D chart)
It started with a drop in the gap (30179.1-30159.0) and closed at 0.12%.
It remains to be seen if the index can be maintained above the 29933.8 point.
-------------------------------
(IXIC 1D chart)
It started with the fall of the gap (12755.6-12596.1) and closed at -0.10%.
The previous gap segment, 12658.2-12730.8, has been filled.
We need to see if it can rise along the uptrend line (2).
---------------------------------
(SPX 1D chart)
It started with a decline in the gap (3709.4-3684.3) and closed at -0.39%.
We have to see if we can climb along the ascent channel.
----------------------------------
(XAUUSD 1D chart)
We have to see if we can get support at 1871.828.
You should watch for any movement that deviates from the uptrend line (4)-downtrend line (5).
This can be interpreted as a movement that deviates from the 1830.705-1899.330 section.
----------------------------------------
(USOIL 1D chart)
We need to see if it can rise along the uptrend line (3).
Also, we have to see if we can get support at 45.76.
-------------------------------------------------- -------------------------------------------
** All indicators are lagging indicators.
So, it's important to be aware that the indicator moves accordingly with the movement of price and volume.
Just for convenience, we are talking upside down for interpretation of the indicators.
** Check support, resistance, and abbreviation points.
** Support or resistance is based on the closing price of the 1D chart.
** All explanations are for reference only and do not guarantee profit or loss on investment.
Explanation of abbreviations displayed on the chart
R: A point or section of resistance that requires a response to preserve profits
S-L: Stop-Loss point or section
S: A point or segment that can be bought for profit generation as a support point or segment
(Short-term Stop Loss can be said to be a point where profits and losses can be preserved or additionally entered through installment trading. You should trade from a short-term investment perspective.)
GAP refers to the difference in prices that occurred when the stock market, CME and BAKKT exchanges were closed because they do not trade 24 hours a day.
G1: Closed price
G2: Market price at the time of opening
(Example) Gap (G1-G2)
註釋
(NIO 1D chart)It remains to be seen if the volatility around December 22nd (December 21-23) could lead to a movement that deviates from the 37.71-53.51 range.
If it falls at 44.56, it is a short-term Stop Loss.
註釋
(AAPL 1D chart)We have to see if we can go up along the uptrend line.
We have to see if we can climb above the 131.40 point.
If it falls at 119.21, it is a short-term Stop Loss.
註釋
(BAC 1D chart)We have to see if we can rise above 29.99 points for support.
If you get support at 29.99, you'll have to see if there can be any movement to create a new wave.
We need to see if we can move up between the uptrend line (3) and the downtrend line (4).
If it falls at 28.40, it is a short-term Stop Loss.
註釋
(GE 1D chart)Failed to break above 10.88 point.
If it doesn't rise above 10.88 points, it is expected to hit 9.77 points eventually.
If it falls between 9.43-9.77, Stop Loss is required to preserve profit and loss.
註釋
(FORD (F) 1D chart)If it falls at 8.80, it is a short-term Stop Loss.
We have to see if we can climb above the 9.01 point.
It remains to be seen if the volatility around December 28 leads to a movement that deviates from the 8.46-9.41 interval.
註釋
(TSLA 1D chart)The gap fell with no support above the 694.76 point.
We need to see if we can move up along the newly created uptrend line (6).
If you fall from the 627.95 point, you can touch below the 604.48 point, so this is a short stop loss.
If you fall in the 589.56-600.08 section, you can touch the 502.49-521.85 section, so you need a Stop Loss to preserve profit or loss.
Since the Stop Loss width is large, you need to think about how to proceed with Stop Loss.
The next period of volatility is around December 30th, and we have to see where it gets support.
Other content (coins, stocks, etc.) is frequently posted on X.
X에 다른 내용(코인, 주식 등)이 자주 게시.
◆ t.me/readCryptoChannel
[HA-MS Indicator]
bit.ly/3YxHgvN
[OBV Indicator]
bit.ly/4dcyny3
X에 다른 내용(코인, 주식 등)이 자주 게시.
◆ t.me/readCryptoChannel
[HA-MS Indicator]
bit.ly/3YxHgvN
[OBV Indicator]
bit.ly/4dcyny3
相關出版品
免責聲明
這些資訊和出版物並不意味著也不構成TradingView提供或認可的金融、投資、交易或其他類型的意見或建議。請在使用條款閱讀更多資訊。