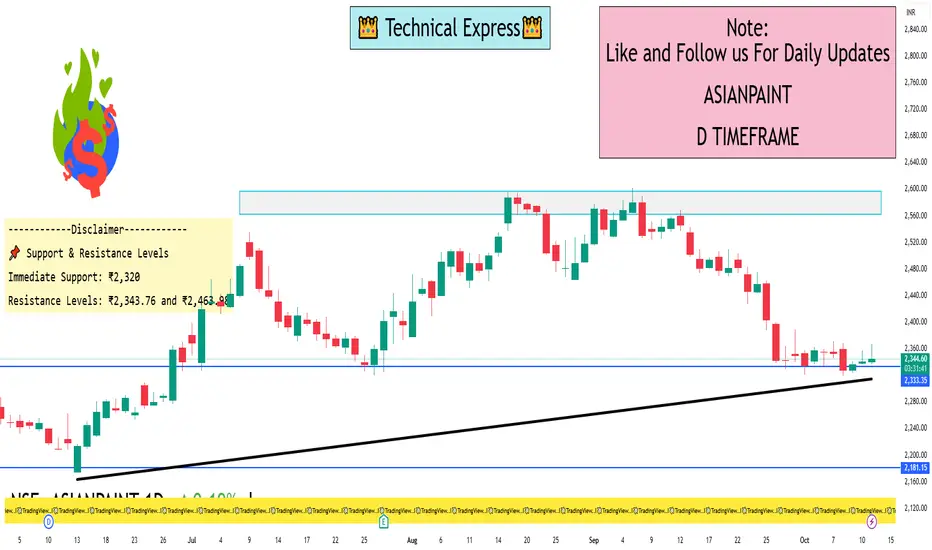
📈 Current Price & Trading Range
Current Price: ₹2,357.70
Day’s Range: ₹2,337.00 – ₹2,366.60
Previous Close: ₹2,340.20
52-Week Range: ₹2,124.75 – ₹3,103.55
📊 Technical Indicators
RSI (14-day): 38.17 — indicating a neutral to bearish condition.
MACD: -41.59 — suggesting bearish momentum.
Stochastic RSI: 10.76 — points to an oversold condition, possibly signaling a reversal.
Rate of Change (ROC): -1.93 — reflects downward momentum.
Commodity Channel Index (CCI): -1.93 — supports the bearish outlook.
Average Directional Index (ADX): 32.54 — indicates a strong trend, confirming the downtrend.
Parabolic SAR: ₹2,320 — suggests a bearish trend continuation.
Supertrend: ₹2,444 — aligns with the bearish trend.
📌 Summary
Asian Paints Ltd. is currently in a bearish phase on the 1-day timeframe. Key support at ₹2,320 is crucial; a breach could lead to further declines. Conversely, a rebound above ₹2,463.98 might indicate a potential trend reversal.
I built a Buy & Sell Signal Indicator with 85% accuracy.
📈 Get access via DM or
WhatsApp: wa.link/d997q0
Contact - +91 76782 40962
| Email: techncialexpress@gmail.com
| Script Coder | Trader | Investor | From India
📈 Get access via DM or
WhatsApp: wa.link/d997q0
Contact - +91 76782 40962
| Email: techncialexpress@gmail.com
| Script Coder | Trader | Investor | From India
相關出版品
免責聲明
這些資訊和出版物並不意味著也不構成TradingView提供或認可的金融、投資、交易或其他類型的意見或建議。請在使用條款閱讀更多資訊。