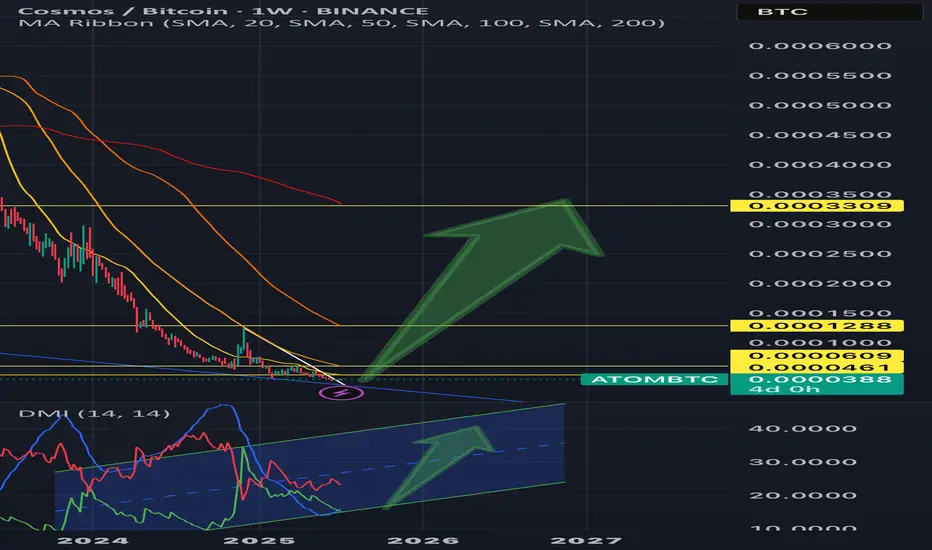
💫Here’s a detailed weekly ATOM/BTC analysis—focusing heavily on the Directional Movement Index (DMI) combo—and a forward-looking forecast.
💫 While ATOM/BTC is currently in a strong downtrend, the presence of bullish RSI divergence on a weekly scale suggests that the strength of this trend may be fading, opening the door for a possible upside shift.
💫 Trend Shift Scenarios:
👎 Bearish continuation if:
• –DI remains above +DI, AND
• ADX sustains above 30, reinforcing downtrend strength.
👍Bullish reversal begins when:
• +DI crosses above –DI on the weekly chart, and its starting to curve;)
• ADX remains elevated or climbs, confirming the new uptrend.
📉 Bear scenario:
If +DI continues to lag and ADX remains strong—price may retest recent support levels in BTC terms (around 0.000037–0.000038 levels.)
📈 Bull scenario:
Look for +DI to crossover above –DI while ADX sustains high values. Weekly RSI divergence (already visible!!!!) supports this &suggests potential 30–50% upside if ATOM breaks out against BTC resistance.
💫 Price Target:
In such a breakout, expect ATOM to outperform BTC by ~30–40% short-term, with room for up to 100% upside if momentum builds more!
💫 Summary
Weekly ATOM/BTC shows a strong downtrend (–DI > +DI, ADX ~33), but bullish RSI divergence hints at a possible reversal.
💢Catalyst: +DI crossing above –DI with ADX sustaining signal strength.
💢Potential: 30–50% upside short-term, 100% mid-term if breakout holds.
💢Plan: watch weekly DMI/ADX and price action in 0.000037–0.000038 BTC range, manage risk with stop-loss under support.
*Noteable: Also Watch RSI confirmation: upward breakout off of divergence is a strong signal.
免責聲明
這些資訊和出版物並不意味著也不構成TradingView提供或認可的金融、投資、交易或其他類型的意見或建議。請在使用條款閱讀更多資訊。
免責聲明
這些資訊和出版物並不意味著也不構成TradingView提供或認可的金融、投資、交易或其他類型的意見或建議。請在使用條款閱讀更多資訊。