Technical Summary:
Elliott Wave Structure:
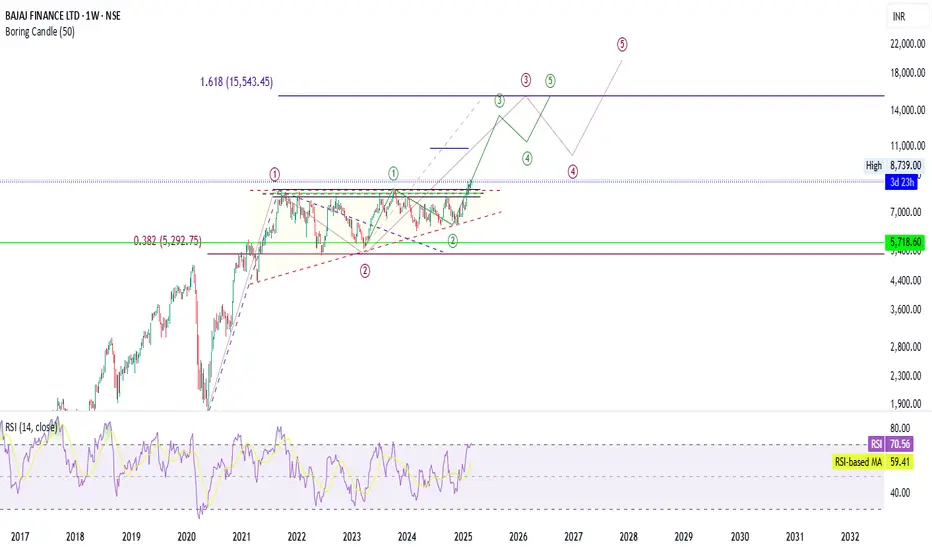
The chart suggests an ongoing impulse wave (Wave 3 in green) after completing Wave 2 correction.
Future projections indicate the completion of Wave 5 around 15,543 as a 1.618 Fibonacci extension.
Support & Resistance Levels:
Strong Support:
5,718.60 (highlighted in green) – a crucial support area.
5,292.75 (Fibonacci 38.2% retracement) – historical support level.
Resistance:
8,739 (current high) – breaking above this could confirm a bullish continuation.
15,543 (Wave 5 target) – major long-term price target.
RSI Analysis:
RSI at 70.56, near overbought territory.
RSI-based moving average at 59.41, indicating strong momentum.
Key Observations & Potential Risks:
✅ Bullish Scenario:
If price sustains above 8,739, the next major move could lead towards 15,543.
Strong wave structure confirms long-term bullish potential.
❌ Bearish Risk:
If price fails to hold above 8,739, a correction toward 5,718 – 5,292 levels is possible.
RSI in overbought territory suggests a potential short-term pullback before further upward movement.
Recommendations & Strategy:
Monitor breakout confirmation above 8,739 for further upside.
Be cautious of a short-term pullback, especially if RSI starts declining.
Long-term investors can hold positions, while traders may wait for a retracement entry near 7,500 – 6,500.
Elliott Wave Structure:
The chart suggests an ongoing impulse wave (Wave 3 in green) after completing Wave 2 correction.
Future projections indicate the completion of Wave 5 around 15,543 as a 1.618 Fibonacci extension.
Support & Resistance Levels:
Strong Support:
5,718.60 (highlighted in green) – a crucial support area.
5,292.75 (Fibonacci 38.2% retracement) – historical support level.
Resistance:
8,739 (current high) – breaking above this could confirm a bullish continuation.
15,543 (Wave 5 target) – major long-term price target.
RSI Analysis:
RSI at 70.56, near overbought territory.
RSI-based moving average at 59.41, indicating strong momentum.
Key Observations & Potential Risks:
✅ Bullish Scenario:
If price sustains above 8,739, the next major move could lead towards 15,543.
Strong wave structure confirms long-term bullish potential.
❌ Bearish Risk:
If price fails to hold above 8,739, a correction toward 5,718 – 5,292 levels is possible.
RSI in overbought territory suggests a potential short-term pullback before further upward movement.
Recommendations & Strategy:
Monitor breakout confirmation above 8,739 for further upside.
Be cautious of a short-term pullback, especially if RSI starts declining.
Long-term investors can hold positions, while traders may wait for a retracement entry near 7,500 – 6,500.
免責聲明
這些資訊和出版物並不意味著也不構成TradingView提供或認可的金融、投資、交易或其他類型的意見或建議。請在使用條款閱讀更多資訊。