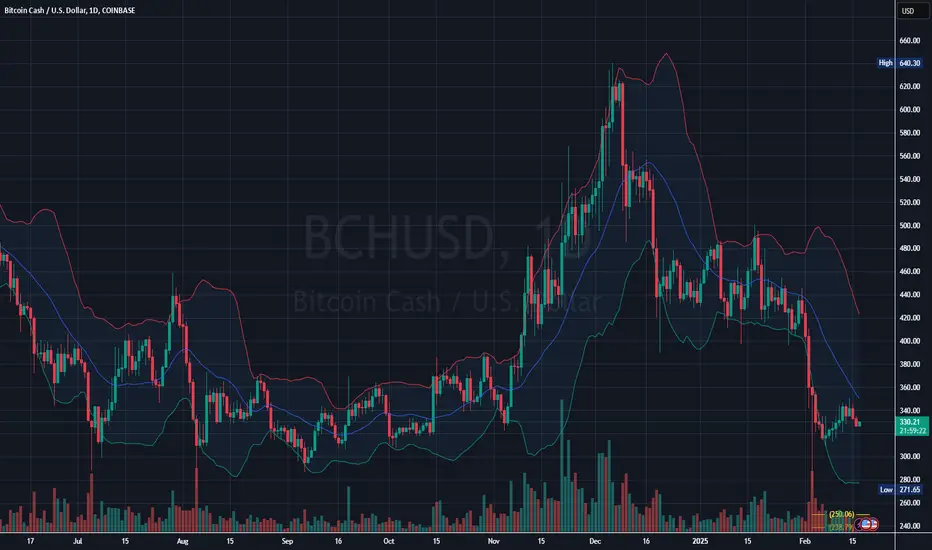
- Downtrend Confirmation: The price recently broke below the mid-Bollinger Band (20-day SMA), signaling bearish momentum.
- Lower Bollinger Band Touch: The price recently reached the lower band, suggesting oversold conditions or a continuation of the downtrend.
- Volume Spike in Down Move: Increased volume during the price drop indicates strong selling pressure.
- Support Around $300: The price has recently bounced from near $300, a psychological and historical support level.
- Resistance Near $380-$400: The mid-Bollinger Band and previous price rejections suggest resistance in this range.
- Bullish Reversal: If BCH can reclaim the mid-Bollinger Band ($380 area) and hold, it may trigger a move toward the upper band ($480+).
- Further Downside: A failure to hold $300 may open the door for further declines toward $280 or lower.
- Consolidation Phase: If BCH stabilizes between $300-$380, sideways movement may occur before a new breakout.
➀➁➂➃➄
免責聲明
這些資訊和出版物並不意味著也不構成TradingView提供或認可的金融、投資、交易或其他類型的意見或建議。請在使用條款閱讀更多資訊。