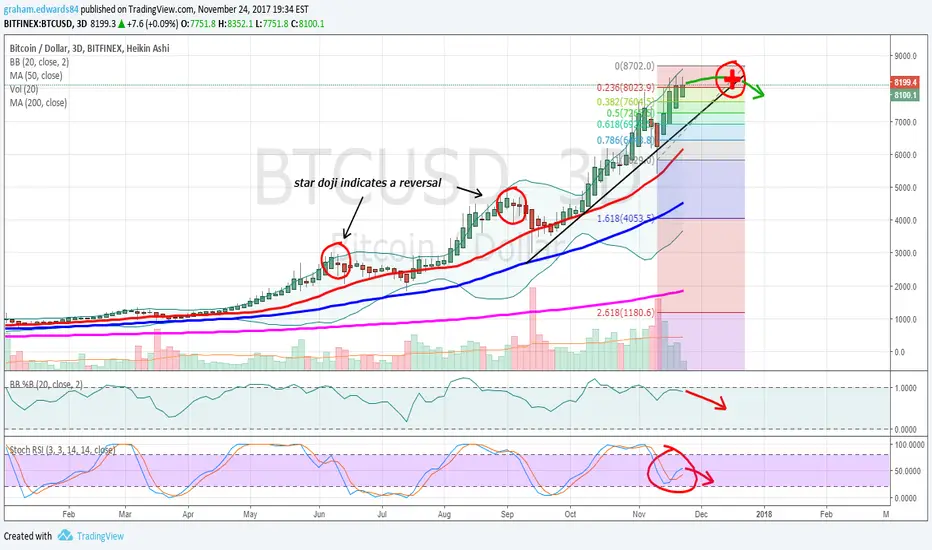
Looking at BTCUSD on this 3 day chart we can see that previous reversals have been indicated by star dojis. But now we are not seeing this yet. This leads me to believe that there will be some sideways consolidation at the top that is yet to come as this relatively stable price points will produce the doji on longer time frames such as this three day chart.
Indicators at the bottom are also displaying some bearish signs although hard to pinpoint movements using indicators at this time frame it does look a bit bearish. It will be interesting to see here if bitcoin can muster a sideways rising consolidation or a falling one and will there be a considerable fall to previous support levels or will it be a relatively smooth mostly sideways move?
Generally after the third wave in the series there is some type of correction to a previous wave top so we could be looking at the 500 range as a good entry target if this happens.
免責聲明
這些資訊和出版物並不意味著也不構成TradingView提供或認可的金融、投資、交易或其他類型的意見或建議。請在使用條款閱讀更多資訊。
免責聲明
這些資訊和出版物並不意味著也不構成TradingView提供或認可的金融、投資、交易或其他類型的意見或建議。請在使用條款閱讀更多資訊。