A publication for my personal historical reference ...
Not financial advice
Do your own research
Looking at various indicators and thoughts for the weekly close of 19.10.20#
Sideways price action is bullish price action
10.5k is the new buy the dip
10 K would be a treat in my personal view ...
Stack sats before the train leaves the station ...
Not financial advice
Do your own research
Looking at various indicators and thoughts for the weekly close of 19.10.20#
Sideways price action is bullish price action
10.5k is the new buy the dip
10 K would be a treat in my personal view ...
Stack sats before the train leaves the station ...
註釋
註釋
1W candle close above VPVR @ 12k would be bullish in my view three zones of accumulation
1# 12000 down to $11300
2# $11300 down to $10650
3# 10650 down to $9900
註釋
註釋
Fib retrace註釋
註釋
Bollinger Bands註釋
註釋
© corgalicious Responsive Linear Regression註釋
註釋
註釋
RSI Slow Stoch
Ema Ribbon
HH, HL, LH, LL
註釋
Slow stoch K:14, D:3, Smooth:6, Length:6, Rsi Ema : 21
註釋
註釋
close up of ema Levels ... Literally as bullish as they could be :)
could we test down to the cyan ema 21 @ $10492.79 sure could
But that would be to buy the dip :)
I would be bullish all the way down to $10124.10
as long as price action closes the weekly candle
above $9985.58 I am bullish on BTC
註釋
註釋
Trend lines by © Copyright 2019 to present, Joris Duyck (JD)
@ author Joris Duyck
註釋
註釋
Vwap Ribbon - JD set to 1M © Copyright 2019 to present, Joris Duyck (JD)
@ author Joris Duyck
註釋
註釋
Thanks, Top Bottom Finder Public version- @ Jayy註釋
BTC and this bull run cross the start line when we close above the orange @$15172.30 or the red above it @ $16787.83
Might be to soon to say but $10988.71 might be the new buy the dip super low ...
註釋
Either way a retest of $12545.50 looks inevitable :)註釋
註釋
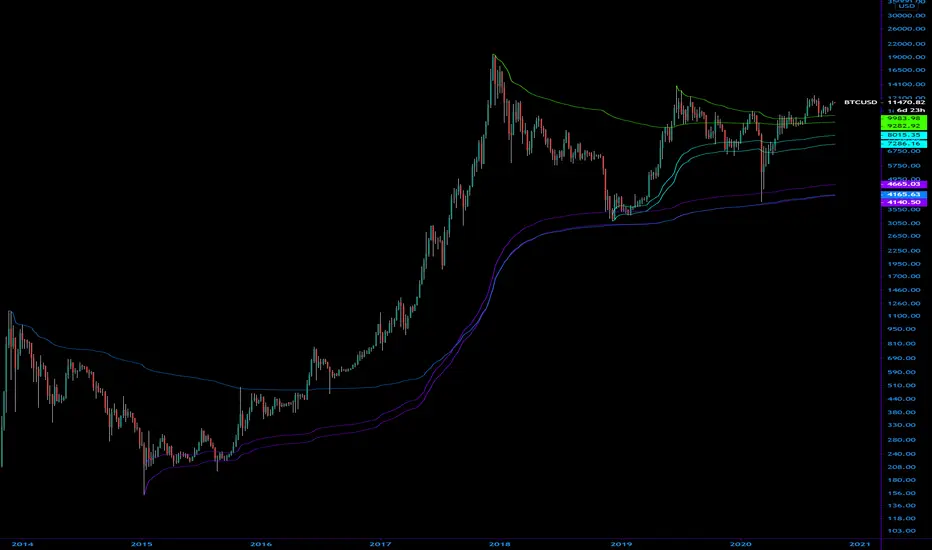
Sma + Ema 200 moving averages ...免責聲明
這些資訊和出版物並不意味著也不構成TradingView提供或認可的金融、投資、交易或其他類型的意見或建議。請在使用條款閱讀更多資訊。