BITCOIN - A Possible BUY Opportunity!

Two day's ago we had a higher high candle close (the candle which got a close above $8,000), a few hours ago we got a higher high candle close on the 1H.
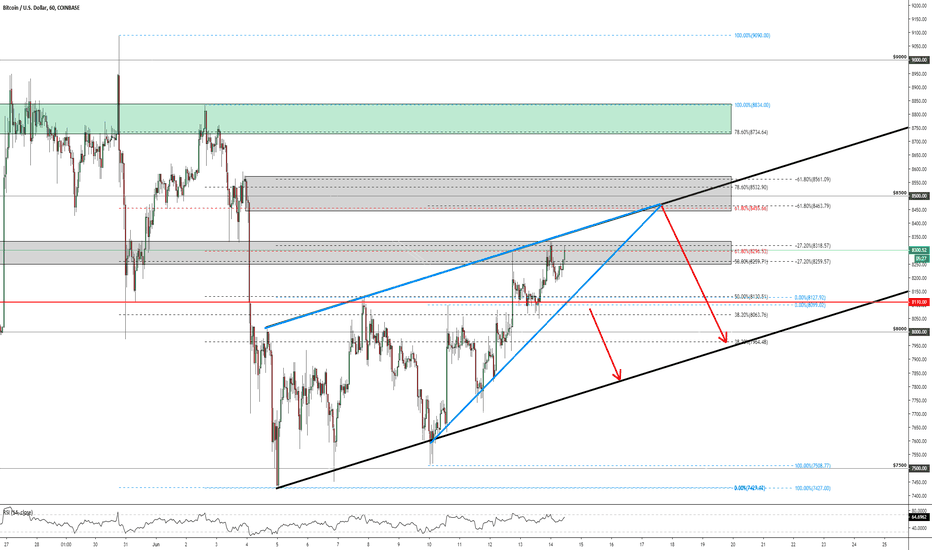
This 1H candle was pretty powerful and the buyers pushed it straight through the blue counter trendline (down-trendline). Yesterday, I said that those two blue trendlines make a Triangle chart pattern. Triangle chart pattern has breakout opportunities to either direction and currently, we have upwards breakout confirmed on the 1H and on the 4H timeframes.
That's why I think we might see a small push upwards. I said small push because of the higher timeframe bearish sign, remember my last idea post, the last Weekly candle close gave us a really powerful bearish candlestick pattern called Evening Star but currently, we have a pretty good short-term buy setup.
If the market makers don't start to ruin some current action then we might see something like this:

The trade criteria:
1. Some hidden higher high candle closes on different timeframes.
2. The blue counter trendline got cracked with a powerful candle. It shows that there is a lot of buyers and they together managed to push it above.
3. The blue counter trendline worked previously as a resistance, the strong candle breakthrough gives us an indication that this trendline should start to act as a support.
4. As you see on the 15 min. chart then there is previously worked resistance level which now becomes support.
5. 1H EMA200 should act as a support level.
6. Altcoins area on the recovery mode.
7. The tiny short-term trend is upwards
8. Golden crosses between different EMA's
The trade becomes invalid if the price starts to fall below the lower blue trendline.
The first target area should stay around $8,200
The second target should stay around $8,500
Do your own research and if it matches with mine idea post then you should be ready to go!
Feel free to support my effort by hitting the "LIKE", it is my only fee from You!
Best regards,
Vaido - Analysts for Swipex
This 1H candle was pretty powerful and the buyers pushed it straight through the blue counter trendline (down-trendline). Yesterday, I said that those two blue trendlines make a Triangle chart pattern. Triangle chart pattern has breakout opportunities to either direction and currently, we have upwards breakout confirmed on the 1H and on the 4H timeframes.
That's why I think we might see a small push upwards. I said small push because of the higher timeframe bearish sign, remember my last idea post, the last Weekly candle close gave us a really powerful bearish candlestick pattern called Evening Star but currently, we have a pretty good short-term buy setup.
If the market makers don't start to ruin some current action then we might see something like this:
The trade criteria:
1. Some hidden higher high candle closes on different timeframes.
2. The blue counter trendline got cracked with a powerful candle. It shows that there is a lot of buyers and they together managed to push it above.
3. The blue counter trendline worked previously as a resistance, the strong candle breakthrough gives us an indication that this trendline should start to act as a support.
4. As you see on the 15 min. chart then there is previously worked resistance level which now becomes support.
5. 1H EMA200 should act as a support level.
6. Altcoins area on the recovery mode.
7. The tiny short-term trend is upwards
8. Golden crosses between different EMA's
The trade becomes invalid if the price starts to fall below the lower blue trendline.
The first target area should stay around $8,200
The second target should stay around $8,500
Do your own research and if it matches with mine idea post then you should be ready to go!
Feel free to support my effort by hitting the "LIKE", it is my only fee from You!
Best regards,
Vaido - Analysts for Swipex
註釋
That was a perfect trade!First target reached!
Regards!
註釋
The first target is reached and it was a perfect catch.The keywords:
- Break above the counter trendline (which was also a triangle upper trendline)
- Breakout has occurred with a strong and powerful candle which was an indication that the trendline retest should work as a support level
- EMA golden crosses were supporting that breakout on 1H and on the 4H timeframes.
- Breakout candle closed above the counter trendline, above the previously worked resistance and above the psychological number - simultaneously
The bounce came and it ended up exactly on the target 1. area, around $8,200. There is a channel projection, which should act as a resistance, there is Fibonacci 50% retracement and actually the well-known $8,200 itself (I have mentioned this area on my previous analysis), so, a pretty decent resistance area.
Currently, the price drifts between the channel trendline and the strong price level of $8,110.
At the moment, can't predict precisely any bigger movements because we don't have enough data to predict it here after the pump. If the price starts to fall lower then we might(!) get something from $8,000 but nothing significant and we can't forget that Weekly bearish candlestick pattern Evening Star which can drag price easily into the lower levels. If the price starts to go higher then the next leg into the second target should get confirmed after the higher high close, candle close (at least 1H) above $8,200.
NB: Thank you for the support, it means a lot to me!
Best regards,
Vaido - Analysts for Swipex
交易結束:目標達成
免責聲明
這些資訊和出版物並不意味著也不構成TradingView提供或認可的金融、投資、交易或其他類型的意見或建議。請在使用條款閱讀更多資訊。
