1️⃣ Key Market Structure - Elliott Wave Analysis
📉 Elliott Wave Progression:
BTC is in Wave 5️⃣, which historically marks the last bullish impulse before a potential correction.
Wave 3️⃣ was strong, confirming the trend continuation.
Now BTC is approaching the potential Bull Market Top 🚀.
🟢 Current Market Position:
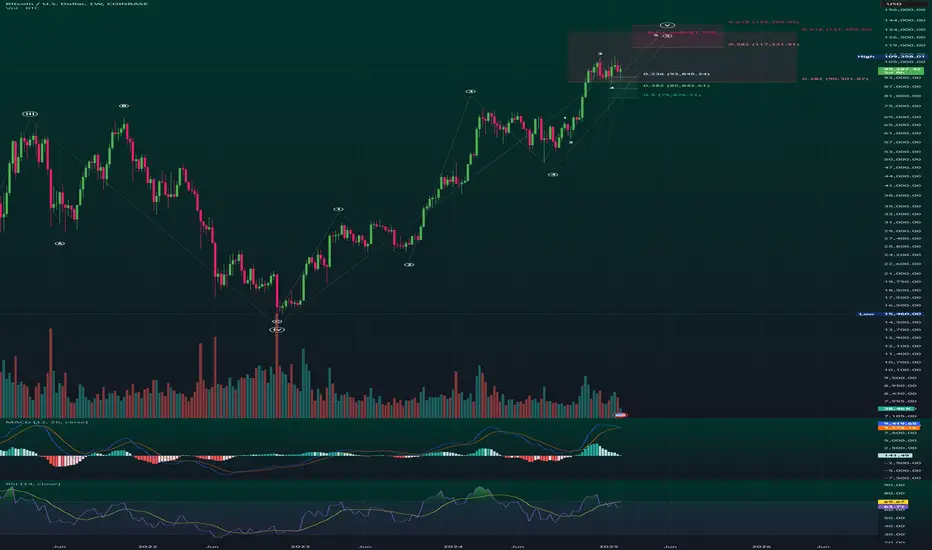
BTC is forming Wave 5, targeting $117K - $139K as per Fibonacci extensions.
The final Wave 5 completion zone is projected within this range.
2️⃣ Fibonacci Retracement & Extension Levels
📊 Fibonacci Levels to Watch:
📍 0.236 Retracement: $93,845.34 ✅ (Minor pullback support)
📍 0.382 Retracement: $85,842.61 ✅ (Stronger correction zone)
📍 0.5 Retracement: $79,876.11 ⚠️ (Critical mid-level support)
🎯 0.382 Extension: $117,331.51 (Potential first target resistance)
🎯 0.618 Extension: $139,205.03 (Bull Market Top Projection)
📌 BTC Weekly High: $109,358.01
📈 BTC Current Price: ~$99,449.97
3️⃣ Technical Indicators - Confirmation Signals
📊 MACD (Momentum Indicator)
✅ MACD Histogram is still positive ➝ Confirming bullish momentum.
⚠️ Flattening MACD lines ➝ Indicates momentum might be slowing.
📊 RSI (Relative Strength Index):
🔼 RSI is near overbought zone (~69-70)
⚠️ Possible local top - BTC might need a correction before further upside
4️⃣ Key Support & Resistance Zones
🛑 Major Support Levels:
🟢 $93,800 (0.236 Fib - Short-term pullback zone)
🟢 $85,800 (0.382 Fib - Stronger correction zone)
🟢 $79,800 (0.5 Fib - Must hold support for long-term bullish trend)
🎯 Resistance Levels - Price Targets:
🔴 $109,000 (Current High - Short-term resistance)
🔴 $117,000 (First Major Resistance - 0.382 Fib Extension)
🚀 $131,000 - $139,000 (Bull Market Top Zone - 0.618 Fib Extension)
5️⃣ Trading Strategy & Market Outlook
💹 Bullish Bias Until BTC Breaks Below $93,800
🎯 Target Areas for TP (Take Profit):
✅ Conservative Traders: Exit near $109,000 - $117,000
✅ Higher Risk Targets: $131,000 - $139,000
⚠️ Risk Management:
🛑 Stop-loss: Below $93,000 to protect against a deeper correction.
📈 Scaling In: Consider adding positions if BTC retraces to the 0.382 ($85,800) or 0.5 ($79,800) Fibonacci level.
💡 Summary & Final Thoughts:
✅ BTC is in the final Elliott Wave 5 move, targeting a potential Bull Market Top of $131K - $139K based on Fibonacci extensions.
⚠️ However, RSI is overbought, and MACD momentum is slowing, meaning a pullback to $93K or $85K is possible before the next move higher.
🚀 Bullish until BTC breaks below key supports. Watch $109K and $117K for short-term resistance.
📊 Strategy: Hold long positions with profit-taking targets at $117K, $131K, and $139K. Use $93K as a support level for risk management.
📉 Elliott Wave Progression:
BTC is in Wave 5️⃣, which historically marks the last bullish impulse before a potential correction.
Wave 3️⃣ was strong, confirming the trend continuation.
Now BTC is approaching the potential Bull Market Top 🚀.
🟢 Current Market Position:
BTC is forming Wave 5, targeting $117K - $139K as per Fibonacci extensions.
The final Wave 5 completion zone is projected within this range.
2️⃣ Fibonacci Retracement & Extension Levels
📊 Fibonacci Levels to Watch:
📍 0.236 Retracement: $93,845.34 ✅ (Minor pullback support)
📍 0.382 Retracement: $85,842.61 ✅ (Stronger correction zone)
📍 0.5 Retracement: $79,876.11 ⚠️ (Critical mid-level support)
🎯 0.382 Extension: $117,331.51 (Potential first target resistance)
🎯 0.618 Extension: $139,205.03 (Bull Market Top Projection)
📌 BTC Weekly High: $109,358.01
📈 BTC Current Price: ~$99,449.97
3️⃣ Technical Indicators - Confirmation Signals
📊 MACD (Momentum Indicator)
✅ MACD Histogram is still positive ➝ Confirming bullish momentum.
⚠️ Flattening MACD lines ➝ Indicates momentum might be slowing.
📊 RSI (Relative Strength Index):
🔼 RSI is near overbought zone (~69-70)
⚠️ Possible local top - BTC might need a correction before further upside
4️⃣ Key Support & Resistance Zones
🛑 Major Support Levels:
🟢 $93,800 (0.236 Fib - Short-term pullback zone)
🟢 $85,800 (0.382 Fib - Stronger correction zone)
🟢 $79,800 (0.5 Fib - Must hold support for long-term bullish trend)
🎯 Resistance Levels - Price Targets:
🔴 $109,000 (Current High - Short-term resistance)
🔴 $117,000 (First Major Resistance - 0.382 Fib Extension)
🚀 $131,000 - $139,000 (Bull Market Top Zone - 0.618 Fib Extension)
5️⃣ Trading Strategy & Market Outlook
💹 Bullish Bias Until BTC Breaks Below $93,800
🎯 Target Areas for TP (Take Profit):
✅ Conservative Traders: Exit near $109,000 - $117,000
✅ Higher Risk Targets: $131,000 - $139,000
⚠️ Risk Management:
🛑 Stop-loss: Below $93,000 to protect against a deeper correction.
📈 Scaling In: Consider adding positions if BTC retraces to the 0.382 ($85,800) or 0.5 ($79,800) Fibonacci level.
💡 Summary & Final Thoughts:
✅ BTC is in the final Elliott Wave 5 move, targeting a potential Bull Market Top of $131K - $139K based on Fibonacci extensions.
⚠️ However, RSI is overbought, and MACD momentum is slowing, meaning a pullback to $93K or $85K is possible before the next move higher.
🚀 Bullish until BTC breaks below key supports. Watch $109K and $117K for short-term resistance.
📊 Strategy: Hold long positions with profit-taking targets at $117K, $131K, and $139K. Use $93K as a support level for risk management.
免責聲明
這些資訊和出版物並不意味著也不構成TradingView提供或認可的金融、投資、交易或其他類型的意見或建議。請在使用條款閱讀更多資訊。