As of May 30, 2025, Concord Biotech Ltd (NSE: CONCORDBIO) closed at ₹1,748.50, marking a 4.9% increase from the previous close of ₹1,666.90 .
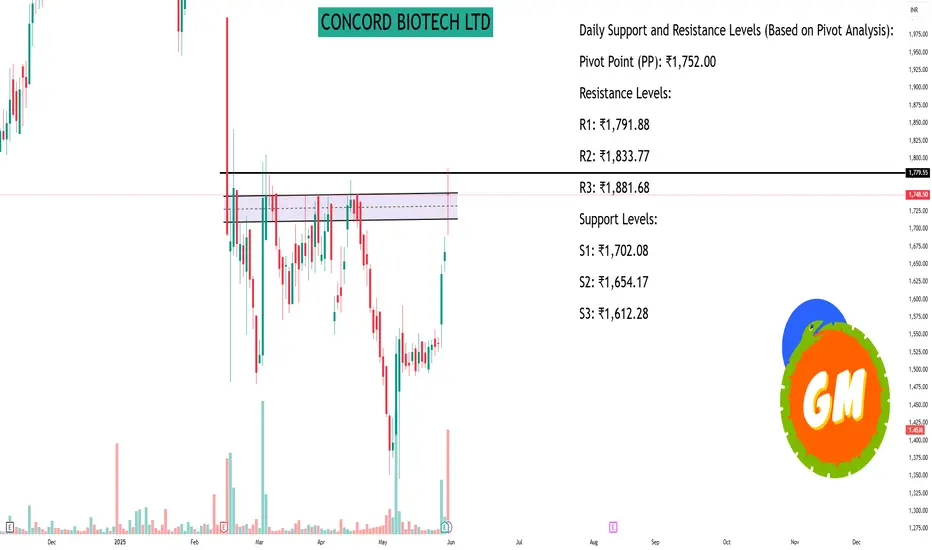
Daily Support and Resistance Levels (Based on Pivot Analysis):
Pivot Point (PP): ₹1,743.97
Resistance Levels:
R1: ₹1,791.88
R2: ₹1,833.77
R3: ₹1,881.68
Support Levels:
S1: ₹1,702.08
S2: ₹1,654.17
S3: ₹1,612.28
These levels are derived from the previous day's trading range and can serve as reference points for intraday trading decisions .
Technical Indicators:
Relative Strength Index (RSI): Over 65, indicating bullish momentum.
MACD: The MACD line has crossed above the signal line, suggesting a potential upward trend.
Volume: An increase in trading volume supports the bullish sentiment.
These indicators suggest that the stock is experiencing positive momentum, but it's essential to monitor for any changes in trend .
Key Observations:
Short-Term Range: The stock is trading between ₹1,600 (support) and ₹1,800 (resistance). A breakout above ₹1,800 could signal further upside potential.
Recent Performance: The stock has shown a 15.14% increase over the past month, indicating strong short-term performance .
Conclusion:
Concord Biotech Ltd is exhibiting bullish technical indicators with key support at ₹1,600 and resistance at ₹1,800. Traders should watch for a breakout above ₹1,800 for potential upward movement, while also being cautious of any reversal signals.
Hello Guys ..
WhatsApp link- wa.link/d997q0
Email - techncialexpress@gmail.com ...
Script Coder/Trader//Investor from India. Drop a comment or DM if you have any questions! Let’s grow together!
WhatsApp link- wa.link/d997q0
Email - techncialexpress@gmail.com ...
Script Coder/Trader//Investor from India. Drop a comment or DM if you have any questions! Let’s grow together!
相關出版品
免責聲明
這些資訊和出版物並不意味著也不構成TradingView提供或認可的金融、投資、交易或其他類型的意見或建議。請在使用條款閱讀更多資訊。