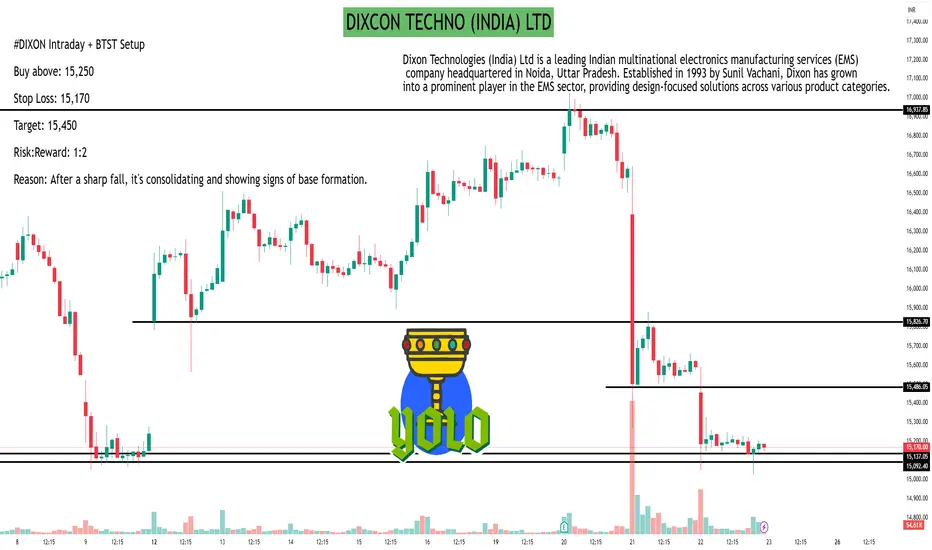
As of May 22, 2025, Dixon Technologies (India) Ltd (NSE: DIXON) closed at ₹15,170.00, reflecting a 2.84% decline from the previous close of ₹15,612.00.
30-Minute Support and Resistance Levels
Based on the 30-minute technical analysis, the following pivot points have been identified:
Classic Pivot Points:
Resistance Levels:
R1: ₹15,184.66
R2: ₹15,305.33
R3: ₹15,383.66
Support Levels:
S1: ₹14,985.66
S2: ₹14,907.33
S3: ₹14,786.66
Pivot Point: ₹15,106.33
Fibonacci Pivot Points:
Resistance Levels:
R1: ₹15,182.35
R2: ₹15,229.31
R3: ₹15,305.33
Support Levels:
S1: ₹15,030.31
S2: ₹14,983.35
S3: ₹14,907.33
Pivot Point: ₹15,106.33
Camarilla Pivot Points:
Resistance Levels:
R1: ₹15,082.24
R2: ₹15,100.48
R3: ₹15,118.73
Support Levels:
S1: ₹15,045.76
S2: ₹15,027.52
S3: ₹15,009.27
Pivot Point: ₹15,106.33
These levels can serve as reference points for intraday trading strategies.
Technical Indicators Overview
The current technical indicators suggest a bearish outlook:
Relative Strength Index (RSI): 30.31, indicating the stock is approaching oversold territory.
Moving Average Convergence Divergence (MACD): -311.32, signaling downward momentum.
Average Directional Index (ADX): 53.38, suggesting a strong trend.
Commodity Channel Index (CCI): -112.93, indicating a potential oversold condition.
Rate of Change (ROC): -8.43, reflecting negative momentum.
Bull/Bear Power: -681.10, emphasizing bearish dominance.
Overall, the technical analysis points to a strong sell signal.
Analyst Ratings
Analyst consensus on Dixon Technologies is mixed:
Strong Buy: 8 analysts
Buy: 8 analysts
Hold: 3 analysts
Sell: 6 analysts
Strong Sell: 1 analyst
This distribution indicates a cautious stance among analysts, with a notable number recommending buying the stock, while others advise selling.
Hello Guys ..
WhatsApp link- wa.link/d997q0
Email - techncialexpress@gmail.com ...
Script Coder/Trader//Investor from India. Drop a comment or DM if you have any questions! Let’s grow together!
WhatsApp link- wa.link/d997q0
Email - techncialexpress@gmail.com ...
Script Coder/Trader//Investor from India. Drop a comment or DM if you have any questions! Let’s grow together!
相關出版品
免責聲明
這些資訊和出版物並不意味著也不構成TradingView提供或認可的金融、投資、交易或其他類型的意見或建議。請在使用條款閱讀更多資訊。