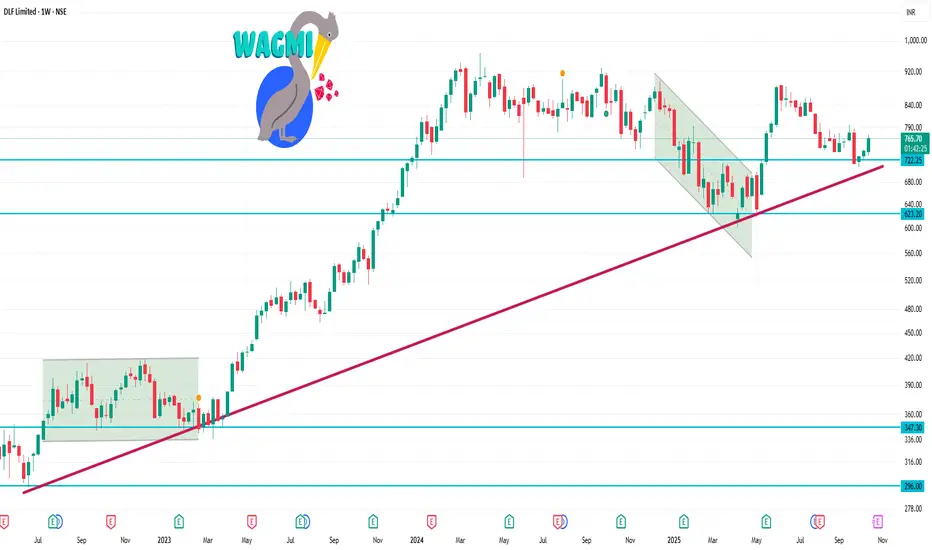
📈 Technical Indicators (1-Week Outlook)
Relative Strength Index (RSI): Currently at 66.74, indicating bullish momentum but approaching overbought territory.
Moving Averages:
5-Day EMA: ₹741.61 (Buy)
10-Day EMA: ₹735.62 (Buy)
50-Day SMA: ₹754.14 (Buy)
100-Day SMA: ₹789.39 (Sell)
200-Day SMA: ₹745.29 (Buy)
MACD (12,26): 7.21, suggesting a bullish trend.
Stochastic RSI: 79.63, nearing overbought levels.
相關出版品
免責聲明
這些資訊和出版物並非旨在提供,也不構成TradingView提供或認可的任何形式的財務、投資、交易或其他類型的建議或推薦。請閱讀使用條款以了解更多資訊。
